Military Connectors Market Size 2025-2029
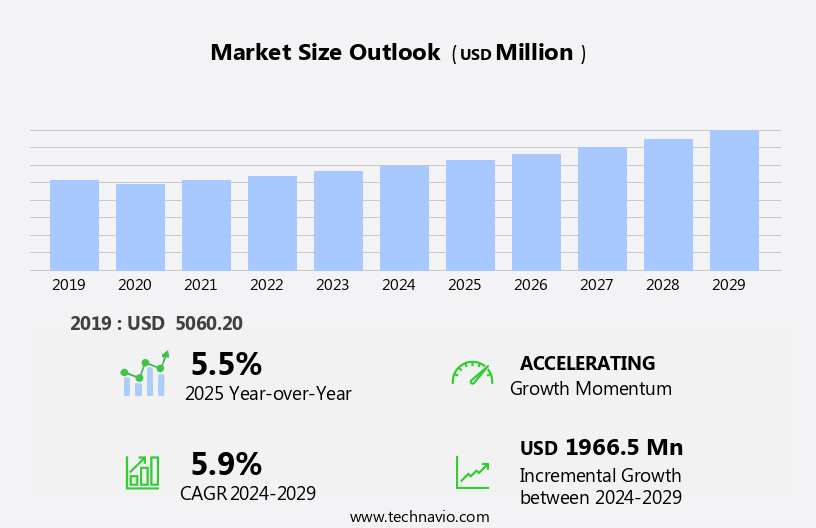
The military connectors market size is forecast to increase by USD 1.97 billion at a CAGR of 5.9% between 2024 and 2029.
- The market is experiencing significant growth due to increasing geopolitical tensions and security threats, leading to heightened demand for advanced military technology, communication and equipment. Another key driver is the ongoing upgrading and modernization of aircraft, necessitating the use of advanced connectors to ensure seamless communication and data center transfer between various components. However, the market also faces challenges, including the need for high reliability and durability in harsh military environments. These connectors must withstand extreme temperatures, vibrations, and electromagnetic interference, making the development of robust and reliable solutions a priority for market participants.
- Additionally, the complexity of military systems and the need for interoperability between different platforms add to the challenges faced by connector manufacturers. Companies seeking to capitalize on market opportunities must focus on innovation and collaboration to address these challenges and meet the evolving needs of military customers.
What will be the Size of the Military Connectors Market during the forecast period?
- The market showcases a continuous and evolving landscape, driven by the ever-evolving requirements of various sectors. Bayonet connectors, fiber optic connectors, and connector sockets are integral components, each offering distinct advantages. Fiber optic connectors ensure minimal signal loss, while bayonet connectors provide easy and secure mating. Strain reliefs and RFI shielding enhance connector durability and electromagnetic interference protection. Miniature connectors and custom connectors cater to space-constrained applications, while rectangular connectors offer high current rating and voltage handling capabilities. Environmental sealing and temperature resistance are essential considerations for military applications. Connector design and durability are paramount, with hermetic and mil-spec connectors ensuring reliability.
- Connector testing and mating cycles ensure optimal performance under harsh conditions. Solder contacts and crimp contacts offer different advantages, while rf connectors and emi shielding ensure signal integrity. Shock resistance and vibration resistance are crucial for military applications. Cable assemblies and wire harnesses ensure seamless connectivity. Connector housings and quick-disconnect connectors offer convenience and ease of use. IP67 and IP68 connectors provide superior environmental sealing, while aerospace connectors and naval connectors cater to specific applications. Contact resistance and temperature resistance are essential factors in connector performance. The market's dynamism is reflected in the ongoing development of new connector technologies, including modular connectors and high-current connectors.These advancements ensure the market remains at the forefront of technology and innovation.
How is this Military Connectors Industry segmented?
The military connectors industry research report provides comprehensive data (region-wise segment analysis), with forecasts and estimates in "USD million" for the period 2025-2029, as well as historical data from 2019-2023 for the following segments.
- Type
- Circular connectors
- Rectangular connectors
- Fiber optic connectors
- RF coaxial connectors
- Others
- Application
- Airforce
- Army
- Navy and marine
- Product Type
- Ruggedized connectors
- Sealed/waterproof connectors
- EMI/RFI shielded connectors
- High-temperature resistant connectors
- Geography
- North America
- US
- Europe
- France
- Germany
- UK
- APAC
- Australia
- China
- India
- Japan
- South Korea
- Rest of World (ROW)
- North America
By Type Insights
The circular connectors segment is estimated to witness significant growth during the forecast period.
Circular connectors, a type of multi-pin electrical connector with cylindrical shape and contacts for powering devices, transmitting data, or signaling, are widely used in military, transportation, industrial, and medical applications. In the military sector, MIL-STD or MIL-SPEC circular connectors are preferred due to their robust environmental sealing, often with metal outer shells. These connectors adhere to military specifications, ensuring protection against harsh conditions for use in military and aerospace applications. Connector reliability is a critical factor in various industries, including military connector, where connector inserts undergo rigorous testing for voltage rating, current capacity, and mating cycles. Circular connectors come in various sizes, such as hermetic, miniature, and subminiature, catering to diverse requirements.
Power connectors, such as those with high-voltage ratings, are essential for military applications, while fiber optic connectors transmit data in communication systems. Connector design includes features like strain reliefs, RFI and EMI shielding, shock resistance, and temperature resistance. Connector housings, push-pull, screw-type, and quick-disconnect connectors are some common types. Custom connectors are designed to meet specific application needs, while wire harnesses and cable assemblies provide a reliable connection between various components. Military applications require connectors to be durable, corrosion-resistant, and capable of handling high currents. Solder and crimp contacts are used for making electrical connections. Connector pins, signal connectors, and defense connectors are other essential components.
Connectors must also meet specific environmental requirements, such as IP67 or IP68 ratings, for water and dust resistance. In summary, the circular connector market is dynamic, driven by the need for reliable, durable, and environmentally sealed connectors for various applications, particularly in the military and aerospace sectors. These connectors must meet stringent specifications for voltage, current, and mating cycles, and come in various sizes and designs to cater to diverse requirements.
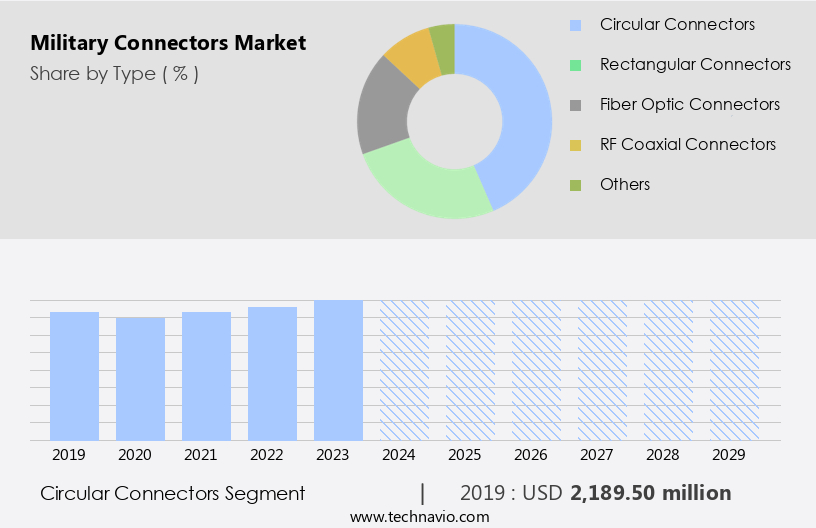
The Circular connectors segment was valued at USD 2.19 billion in 2019 and showed a gradual increase during the forecast period.
Regional Analysis
North America is estimated to contribute 32% to the growth of the global market during the forecast period.Technavio's analysts have elaborately explained the regional trends and drivers that shape the market during the forecast period.
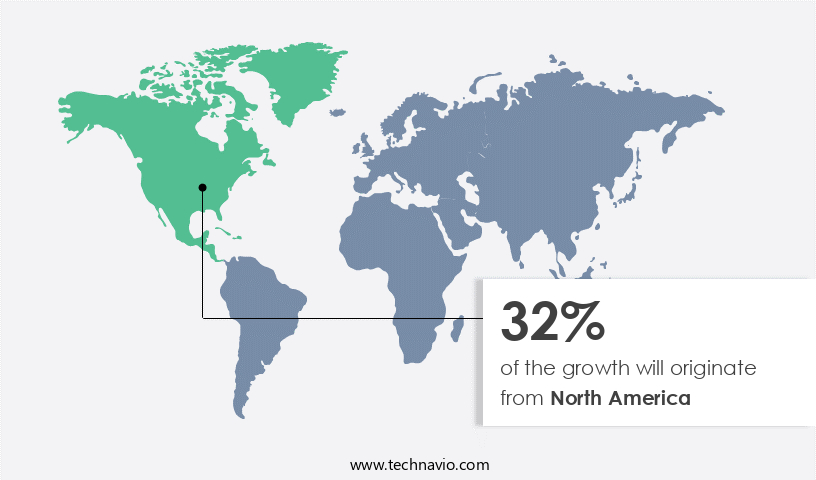
The market in North America is experiencing consistent growth, driven by the presence of leading military and defense companies and the high demand from various military applications in the region, particularly in the US. The market encompasses various types of connectors, including ground vehicle connectors, circular connectors, rectangular connectors, custom connectors, and more. These connectors exhibit robust reliability and come with diverse specifications such as voltage rating, current rating, mating cycles, and environmental sealing. Connector testing is a crucial aspect of the market, ensuring the highest level of performance and durability. Mil-spec connectors and hermetic connectors are widely used due to their ability to withstand harsh military environments.
Power connectors, fiber optic connectors, and signal connectors are essential components of military applications, ensuring seamless data and power transmission. Miniature connectors, such as subminiature connectors and push-pull connectors, are increasingly popular due to their compact size and high-current handling capabilities. Aerospace connectors, cable assemblies, and wire harnesses are other significant market segments. The market also focuses on connector design, durability, and corrosion resistance, with solder contacts and crimp contacts providing reliable connections. The market in North America is characterized by the development of advanced technologies, such as RF connectors, EMI shielding, and RFI shielding, ensuring optimal signal quality and resistance to electromagnetic interference.
The market also prioritizes shock resistance, temperature resistance, and vibration resistance to meet the stringent requirements of military applications. Overall, the market is expected to continue its growth trajectory, driven by the increasing demand for advanced and reliable connectivity solutions in military and defense applications.
Market Dynamics
Our researchers analyzed the data with 2024 as the base year, along with the key drivers, trends, and challenges. A holistic analysis of drivers will help companies refine their marketing strategies to gain a competitive advantage.
What are the key market drivers leading to the rise in the adoption of Military Connectors Industry?
- Geopolitical tensions and security threats serve as primary drivers for market instability and growth in various sectors.
- The market is experiencing significant growth due to escalating geopolitical tensions and the resulting need for enhanced military preparedness. Governments worldwide are increasing defense spending to modernize their infrastructure, focusing on advanced communication systems, weaponry, and surveillance equipment. Military connectors play a crucial role in ensuring reliable and secure connections for these systems. Military connectors come in various types, including bayonet connectors, fiber optic connectors, connector sockets, miniature connectors, rectangular connectors, and custom connectors. These connectors offer features such as strain reliefs, RFI shielding, EMI shielding, and shock resistance to meet the demanding requirements of military applications.
- Wire harnesses are another essential component that utilizes military connectors to ensure the proper functioning of complex defense systems. The market for military connectors is expected to continue growing as governments invest in defense modernization and upgrades to maintain their military capabilities.
What are the market trends shaping the Military Connectors Industry?
- The trend in the aviation market is shifting towards more frequent upgrading and modernization of aircraft. It is essential for companies to keep their fleets current to remain competitive.
- The market is experiencing notable growth due to the ongoing modernization and upgrading of military aircraft. This trend is driven by the integration of advanced electronics and systems, which enhance operational capabilities and ensure safer flying conditions. These modern electronics are not only more accurate but also lighter, contributing to overall aircraft efficiency. For instance, UPS's avionics display upgrade program for its Boeing 757s and 767s is a testament to this trend. This program replaced older display and flight instruments with large, flat-panel display screens, addressing the obsolescence of cathode ray tube (CRT) displays. Military connector designs prioritize environmental sealing, durability, and corrosion resistance to meet the rigorous demands of military applications.
- Connector types include solder contacts, RF connectors, crimp contacts, high-voltage connectors, connector housings, push-pull connectors, and screw-type connectors. Aerospace connectors, in particular, require stringent specifications for high-reliability applications. These connectors are designed to operate in extreme temperatures, harsh environments, and high-stress conditions. Connector durability and reliability are essential factors in military applications, where downtime can have significant consequences. Military connectors are engineered to meet these requirements, with robust designs that ensure reliable performance under extreme conditions. Additionally, connector designs prioritize corrosion resistance to ensure long-term reliability in humid and corrosive environments. In conclusion, The market is experiencing significant growth due to the increasing demand for advanced electronics and systems in military aircraft.
- The market is driven by the need for reliable, durable, and corrosion-resistant connectors that can operate in extreme conditions. Military connector designs prioritize environmental sealing, durability, and corrosion resistance to meet these requirements, ensuring the reliability and efficiency of military technology. Recent research indicates that this trend is expected to continue, with the market experiencing steady growth in the coming years.
What challenges does the Military Connectors Industry face during its growth?
- The reliability and durability issues pose a significant challenge to the industry's growth, necessitating continuous research and innovation to ensure product longevity and consumer confidence.
- The market faces challenges due to the critical requirements for reliability and durability in various applications. Connectors used in military applications are subjected to harsh environments, including voltage fluctuations, temperature extremes, and mechanical forces. These conditions can lead to issues such as contact resistance, broken latches, separation of mating joints, and overheating, which can compromise the safety of both the connected device and the user. To address these challenges, military connectors are engineered to meet stringent specifications, including IP67 and IP68 ratings for water and dust protection, temperature resistance, and vibration resistance. These connectors incorporate robust design features, such as quick-disconnect mechanisms and modular construction, to ensure reliable performance under demanding conditions.
- Signal connectors, naval connectors, and defense connectors are among the key types of military connectors, each designed to meet specific application requirements. Contact resistance, a critical factor in connector performance, is minimized through the use of precision-engineered connector pins and mating surfaces. In conclusion, the market requires continuous innovation to meet the evolving needs of defense applications. The focus on reliability and durability, along with advanced design features, will drive the growth of the market, enabling military personnel to operate in challenging environments with confidence. Recent research suggests that the market for military connectors is expected to grow steadily, driven by increasing demand for advanced military technology and the need for reliable communication and power distribution systems.
Exclusive Customer Landscape
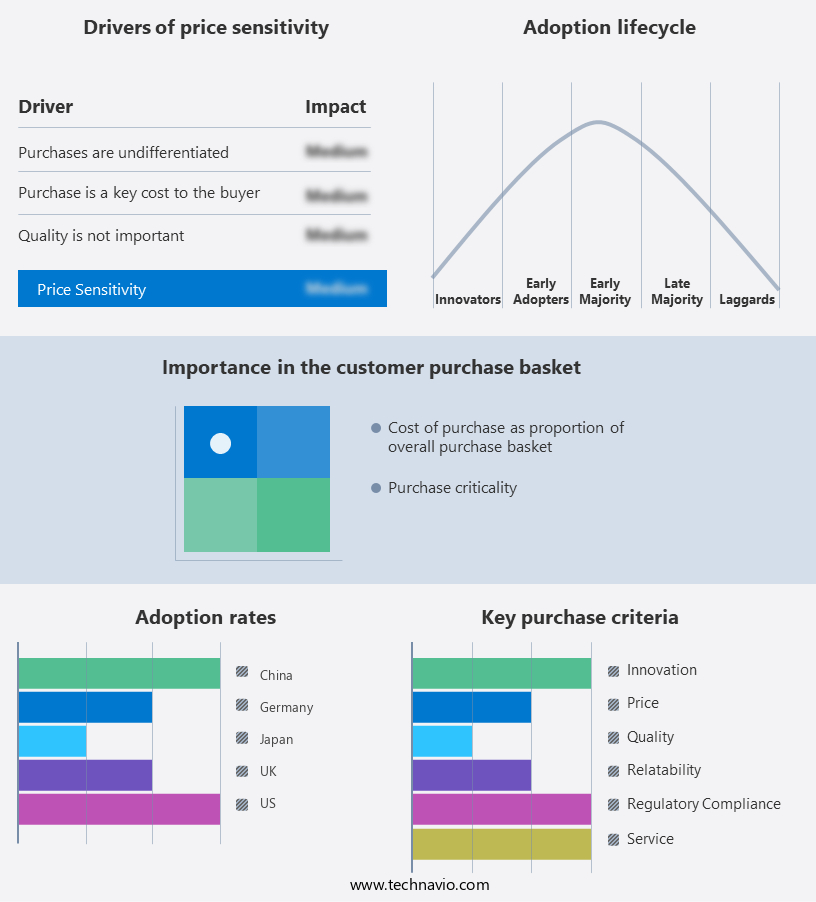
The military connectors market forecasting report includes the adoption lifecycle of the market, covering from the innovator's stage to the laggard's stage. It focuses on adoption rates in different regions based on penetration. Furthermore, the military connectors market report also includes key purchase criteria and drivers of price sensitivity to help companies evaluate and develop their market growth analysis strategies.
Customer Landscape
Key Companies & Market Insights
Companies are implementing various strategies, such as strategic alliances, military connectors market forecast, partnerships, mergers and acquisitions, geographical expansion, and product/service launches, to enhance their presence in the industry.
ALFAR SL - The company specializes in providing an extensive selection of military-grade connectors, including MIL-DTL-38999 Series I and MIL-DTL-5015 Rear Release connectors. These connectors cater to stringent military specifications, ensuring reliable performance under extreme conditions. Our offerings undergo rigorous testing to meet the highest industry standards, enabling seamless integration into defense applications. With a commitment to innovation, we continually expand our product portfolio to address evolving military connectivity needs.
The industry research and growth report includes detailed analyses of the competitive landscape of the market and information about key companies, including:
- ALFAR SL
- Allied Automation Inc.
- Amphenol Corp.
- Conesys
- Eaton Corp. plc
- ept GmbH
- Fischer Connectors Holding SA
- Glenair Inc.
- Hans Turck GmbH and Co. KG
- ITT Inc.
- Koehlke Components Inc
- Molex LLC
- ODU GmbH and Co. KG
- Omnetics Connector Corp.
- Ray Service a.s.
- Renhotec Group Ltd
- Rojone Pty Ltd
- Smiths Group Plc
- TE Connectivity Ltd.
- Weald Electronics Ltd.
Qualitative and quantitative analysis of companies has been conducted to help clients understand the wider business environment as well as the strengths and weaknesses of key industry players. Data is qualitatively analyzed to categorize companies as pure play, category-focused, industry-focused, and diversified; it is quantitatively analyzed to categorize companies as dominant, leading, strong, tentative, and weak.
Recent Development and News in Military Connectors Market
- In February 2023, TE Connectivity, a leading technology and manufacturing company, announced the launch of its new line of high-performance military connectors, the HDK Series. These connectors are designed to meet the stringent requirements of military applications, offering high reliability, ruggedness, and resistance to harsh environments (TE Connectivity press release, 2023).
- In August 2024, Hirose Electric Co. Ltd., a Japanese connector manufacturer, formed a strategic partnership with Elma Electronic GmbH, a German manufacturer of electronic components and systems. The collaboration aims to expand Hirose's product offerings in the military and aerospace sectors by leveraging Elma's expertise in military connectors and ruggedized components (Hirose Electric press release, 2024).
- In March 2025, Amphenol Corporation, a global interconnect technology company, completed the acquisition of Cinch Connectivity Solutions from Smiths Group. This acquisition significantly strengthened Amphenol's position in the military and aerospace connectors market, adding Cinch's extensive product portfolio and expanding its customer base (Amphenol Corporation press release, 2025).
- In October 2025, the U.S. Department of Defense (DoD) announced a new initiative to invest USD150 million in research and development for advanced military connectors. This funding will support the development of next-generation connectors with improved performance, reliability, and miniaturization for various military applications (DoD press release, 2025).
Research Analyst Overview
The market encompasses a diverse range of products designed for use in extreme environments, supporting data transmission and power distribution for weapon systems, aerospace systems, ground vehicles, and naval systems. Ruggedized connectors, engineered to withstand harsh conditions, are essential for reliable signal transmission and communication systems in military applications. Connector performance is a critical factor in defense systems, particularly in high-frequency applications such as radar systems and military electronics. Manufacturers prioritize connector certification and adherence to stringent standards to ensure optimal functionality and longevity. Connector maintenance, repair, and replacement are integral aspects of the market. As military technology advances, so too do the demands placed on connector specifications and assembly techniques.
The connector life cycle, from design and manufacturing to testing and simulation, is a continuous process aimed at improving connector performance and reliability. Power distribution and sensor systems also rely on robust connectors for efficient operation in challenging conditions. Navigation systems and communication networks require reliable, high-performance connectors to ensure accurate data transmission and effective system integration. In the market, innovation and adaptability are key. As defense technology evolves, so too must connector technology, enabling seamless integration and optimal functionality in the most demanding applications.
Dive into Technavio's robust research methodology, blending expert interviews, extensive data synthesis, and validated models for unparalleled Military Connectors Market insights. See full methodology.
|
Market Scope |
|
|
Report Coverage |
Details |
|
Page number |
233 |
|
Base year |
2024 |
|
Historic period |
2019-2023 |
|
Forecast period |
2025-2029 |
|
Growth momentum & CAGR |
Accelerate at a CAGR of 5.9% |
|
Market growth 2025-2029 |
USD 1966.5 million |
|
Market structure |
Fragmented |
|
YoY growth 2024-2025(%) |
5.5 |
|
Key countries |
US, UK, Germany, France, Japan, China, India, South Korea, Israel, and Australia |
|
Competitive landscape |
Leading Companies, Market Positioning of Companies, Competitive Strategies, and Industry Risks |
What are the Key Data Covered in this Military Connectors Market Research and Growth Report?
- CAGR of the Military Connectors industry during the forecast period
- Detailed information on factors that will drive the growth and forecasting between 2025 and 2029
- Precise estimation of the size of the market and its contribution of the industry in focus to the parent market
- Accurate predictions about upcoming growth and trends and changes in consumer behaviour
- Growth of the market across North America, APAC, Europe, South America, and Middle East and Africa
- Thorough analysis of the market's competitive landscape and detailed information about companies
- Comprehensive analysis of factors that will challenge the military connectors market growth of industry companies
We can help! Our analysts can customize this military connectors market research report to meet your requirements.
 RIA -
RIA - 
