Milk Protein Concentrates Market Size 2026-2030
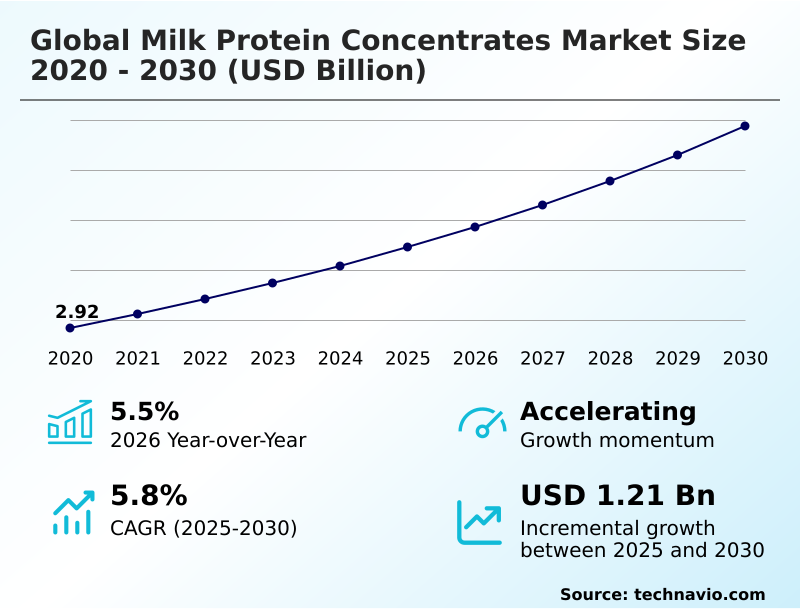
The milk protein concentrates market size is valued to increase by USD 1.21 billion, at a CAGR of 5.8% from 2025 to 2030. Rising global demand for sports and performance nutrition will drive the milk protein concentrates market.
Major Market Trends & Insights
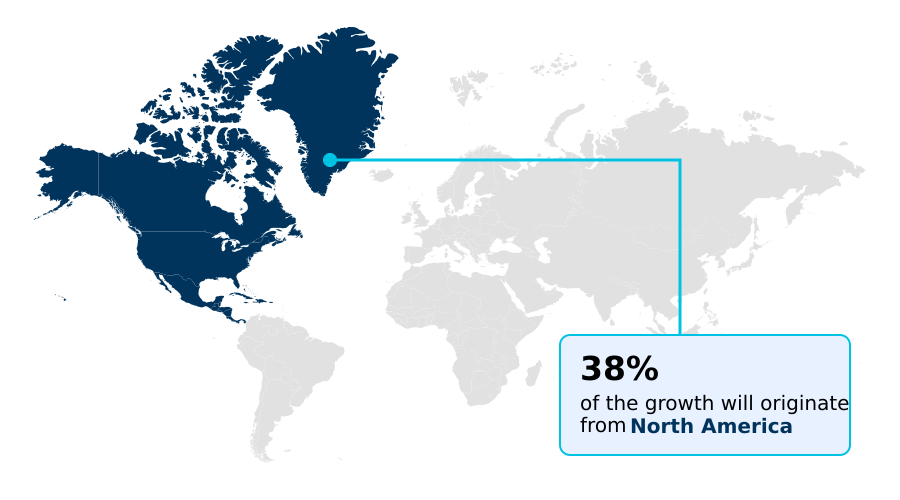
- North America dominated the market and accounted for a 38.5% growth during the forecast period.
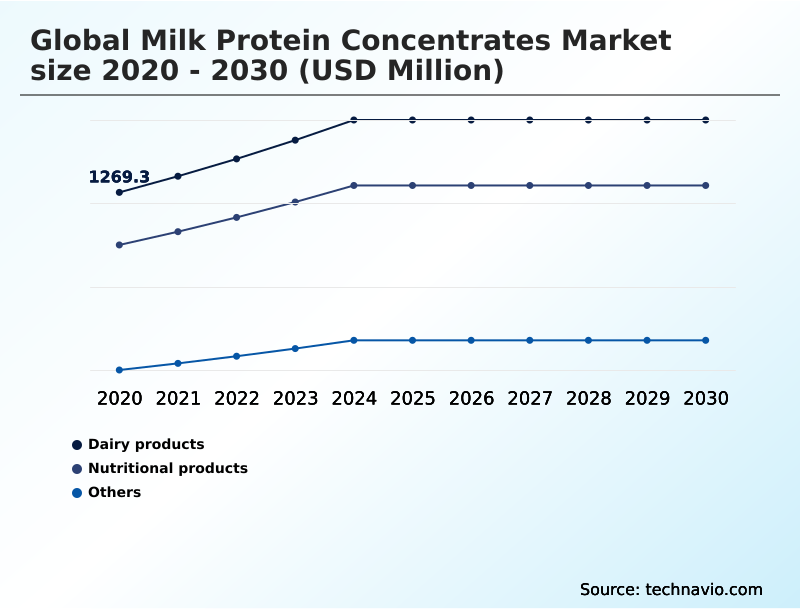
- By Product - Dairy products segment was valued at USD 1.55 billion in 2024
- By Distribution Channel - Offline segment accounted for the largest market revenue share in 2024
Market Size & Forecast
- Market Opportunities: USD 2.02 billion
- Market Future Opportunities: USD 1.21 billion
- CAGR from 2025 to 2030 : 5.8%
Market Summary
- The milk protein concentrates market is shaped by robust demand from the nutritional products sector, where ingredients are essential for sports nutrition, infant formula, and clinical applications. A significant trend involves the industry's pivot toward clean-label ingredients and sustainable manufacturing, emphasizing the use of cold filtration methods to preserve the native protein structure and bioavailability.
- However, the market faces competition from plant-based alternatives and the technical complexities of ensuring high solubility and heat stability in ready-to-drink beverages. For instance, a beverage manufacturer seeking to launch a high-protein, shelf-stable drink must carefully select a milk protein isolate with a specific micellar casein structure to prevent age gelation, a common issue that impacts texture and consumer acceptance.
- This scenario highlights the need for advanced protein hydrolysates and precise formulation expertise to balance nutritional goals with product quality, a key dynamic influencing purchasing decisions and R&D investment across the industry.
What will be the Size of the Milk Protein Concentrates Market during the forecast period?
Get Key Insights on Market Forecast (PDF) Get Free Sample
How is the Milk Protein Concentrates Market Segmented?
The milk protein concentrates industry research report provides comprehensive data (region-wise segment analysis), with forecasts and estimates in "USD million" for the period 2026-2030, as well as historical data from 2020-2024 for the following segments.
- Product
- Dairy products
- Nutritional products
- Others
- Distribution channel
- Offline
- Online
- Type
- MPC 40
- MPC 50
- MPC 60
- MPC 70
- MPC 80 and above
- Source
- Powder
- Liquid
- Geography
- North America
- US
- Canada
- Mexico
- Europe
- Germany
- France
- The Netherlands
- APAC
- China
- India
- Japan
- South America
- Brazil
- Argentina
- Middle East and Africa
- Saudi Arabia
- UAE
- South Africa
- Rest of World (ROW)
- North America
By Product Insights
The dairy products segment is estimated to witness significant growth during the forecast period.
The dairy products segment leverages milk protein concentrates to standardize protein content, enhancing consistency in fluid milk and cheese manufacturing.
These ingredients are critical for improving curd strength and optimizing production, with some processors reporting up to a 15% increase in cheese yield. In yogurt and fermented items, they improve viscosity and mouthfeel, supporting clean-label formulations.
The emulsification properties and heat stability of concentrates are vital for dairy desserts and creams, ensuring product integrity.
As demand for low-fat and reduced-sugar options grows, the role of these proteins in providing structural integrity and richness becomes more pronounced, solidifying their importance in dairy product innovation and cost optimization across global markets.
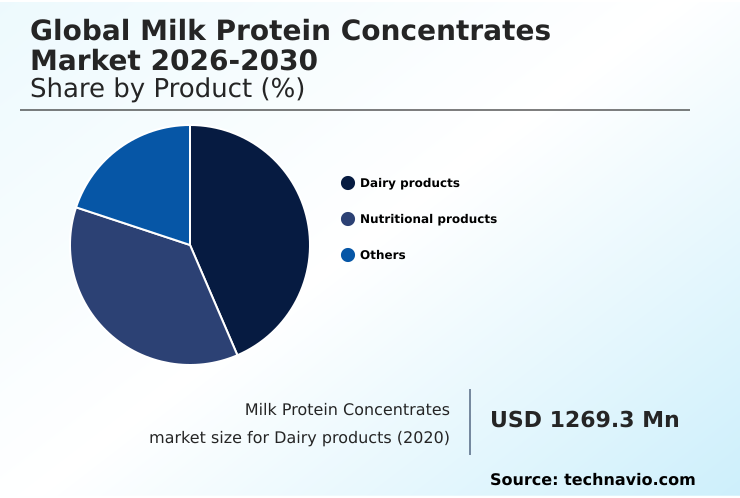
The Dairy products segment was valued at USD 1.55 billion in 2024 and showed a gradual increase during the forecast period.
Regional Analysis
North America is estimated to contribute 38.5% to the growth of the global market during the forecast period.Technavio’s analysts have elaborately explained the regional trends and drivers that shape the market during the forecast period.
See How Milk Protein Concentrates Market Demand is Rising in North America Get Free Sample
The geographic landscape is led by North America, which is projected to account for over 38% of the market's incremental growth, driven by innovation in high-performance dieting and specialized dairy ingredient solutions.
In this region, a focus on advanced protein fractionation has improved yields by 12%. Meanwhile, the APAC region is witnessing a surge in demand for dairy protein powder, particularly for infant nutrition.
European processors are leaders in sustainability, with some achieving a 10% reduction in water consumption through next-generation diafiltration techniques.
South America and the Middle East and Africa are emerging as key consumers, focusing on functional protein innovation to meet local nutritional needs, though they contend with challenges related to the dairy commodity market and require robust supply chain stabilization strategies.
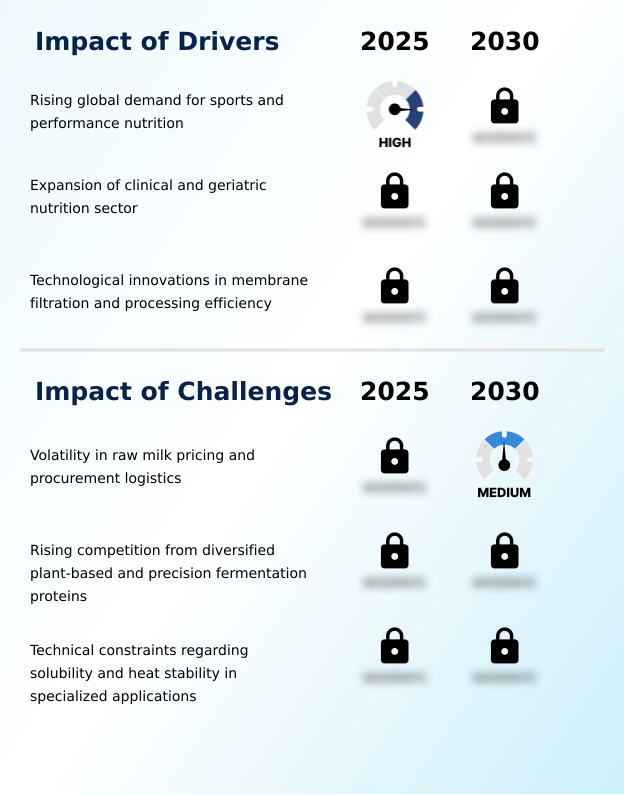
Market Dynamics
Our researchers analyzed the data with 2025 as the base year, along with the key drivers, trends, and challenges. A holistic analysis of drivers will help companies refine their marketing strategies to gain a competitive advantage.
- The global milk protein concentrates market 2026-2030 is evolving through targeted applications and technical advancements. The use of milk protein concentrates in sports nutrition continues to expand, driven by the demand for products that support muscle recovery. Simultaneously, a focus on milk protein concentrates for geriatric health addresses the needs of an aging population.
- Formulators are focused on improving the solubility of milk protein concentrate and ensuring heat stability in high-protein beverages to prevent issues like age gelation in RTDs. In production, there is a clear distinction between native vs hydrolyzed milk protein, with each offering unique functional properties. The industry is also responding to consumer preferences with clean-label milk protein concentrate applications.
- Key industrial uses include milk protein concentrate in infant formula and using milk protein concentrate in yogurt to enhance texture. Furthermore, milk protein concentrate for cheese making is crucial for yield optimization. In response to market shifts, the industry is analyzing plant-based vs milk protein concentrate dynamics and promoting milk protein concentrate for weight management.
- The role of mpc in clinical nutrition is expanding, though the cost-effectiveness of milk protein concentrate remains a key consideration. Technological innovations in mpc production are vital, alongside efforts toward reducing lactose with milk protein concentrate. Formulating ready-to-drink protein shakes with a long shelf life of products with mpc is a primary R&D focus.
- The environmental impact of mpc processing and supply chain challenges for dairy proteins are also significant concerns. The functional properties of different mpc grades, such as milk protein concentrate emulsification benefits, are being leveraged in new areas like mpc application in processed meat products.
- This strategic focus can improve supply chain reliability by more than 25% compared to sourcing commoditized ingredients. The future of milk protein in functional foods depends on balancing these technical, economic, and environmental factors.
What are the key market drivers leading to the rise in the adoption of Milk Protein Concentrates Industry?
- The primary market driver is the rising global demand for sports and performance nutrition, fueled by increasing health consciousness among consumers.
- Market growth is primarily driven by the expanding applications of concentrates in specialized health and nutritional products.
- The demand for ingredients supporting proactive wellness food and nutritional medicine ingredient applications has surged, with the clinical nutrition formula segment growing by 18% in key regions.
- This is fueled by the need for products targeting post-operative recovery and geriatric nutrition support, where high emulsification properties and a dense nutritional profile density are critical.
- The development of specialized health products and liquid nutritional supplements relies on the clean-label formulation and consistent heat stability performance of these ingredients.
- Innovations in processing, resulting in a superior protein-to-fat ratio and high ingredient solubility, have enhanced their use in ready-to-drink beverages and other complex food systems, further propelling market expansion.
What are the market trends shaping the Milk Protein Concentrates Industry?
- A key market trend is the transition toward sustainable and carbon-neutral dairy processing. This shift reflects increasing regulatory pressures and consumer demand for environmentally responsible products.
- Key trends are shaping the market, driven by consumer demand for sustainable and transparent products. A significant shift is the move toward carbon-neutral processing and sustainable dairy processing, with some facilities reducing their water usage by over 15% through advanced filtration.
- This aligns with the growing preference for products with clean-label certification, which has seen a 25% increase in consumer trust. Manufacturers are adopting the cold filtration method and other gentle techniques to preserve the native protein structure. The demand for proactive wellness food and personalized wellness food is fueling innovation in high-value applications and therapeutic supplements.
- These trends are supported by the availability of high calcium content and phosphorus mineral profile ingredients, as well as specialized bioactive dairy solutions and protein recovery powders.
What challenges does the Milk Protein Concentrates Industry face during its growth?
- A key challenge affecting industry growth is the volatility in raw milk pricing and the complexities of procurement logistics.
- The market faces significant challenges from the volatility of raw milk procurement and the rising prominence of alternative protein sources. Fluctuations in the dairy commodity market can increase production costs by over 20% in a single quarter, impacting profit margins. Concurrently, competition from precision fermentation protein and plant-based protein blends is intensifying, with hybrid nutritional supplements gaining market share.
- This requires incumbents to focus on supply chain stabilization and therapeutic supplement innovations to differentiate their offerings. Furthermore, technical hurdles such as age gelation prevention, sedimentation control, and ensuring a stable native protein structure in high-protein formulations remain.
- Overcoming these requires significant R&D, particularly for applications like enteral feeding component and weight management food, where product stability and texture are paramount.
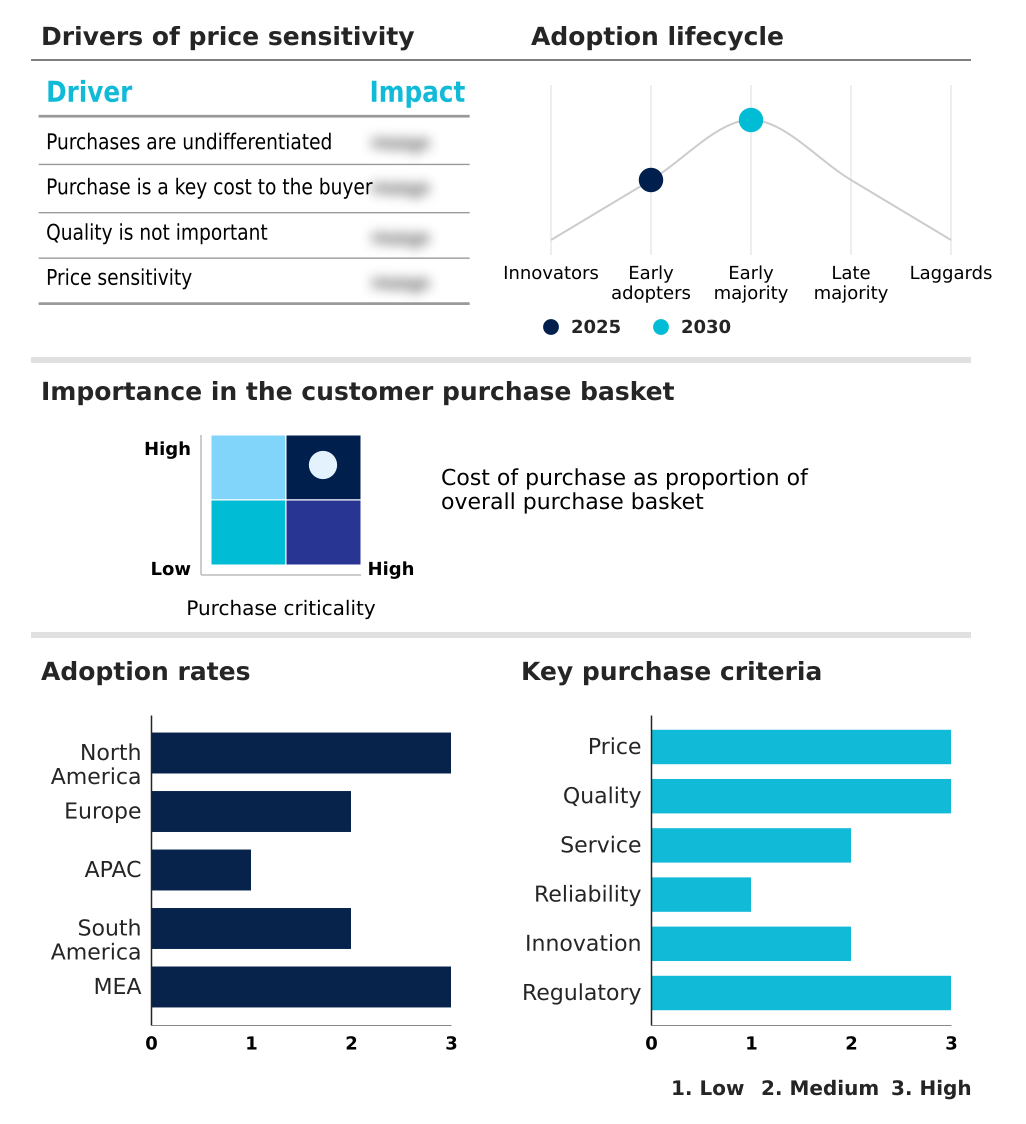
Exclusive Technavio Analysis on Customer Landscape
The milk protein concentrates market forecasting report includes the adoption lifecycle of the market, covering from the innovator’s stage to the laggard’s stage. It focuses on adoption rates in different regions based on penetration. Furthermore, the milk protein concentrates market report also includes key purchase criteria and drivers of price sensitivity to help companies evaluate and develop their market growth analysis strategies.
Customer Landscape of Milk Protein Concentrates Industry
Competitive Landscape
Companies are implementing various strategies, such as strategic alliances, milk protein concentrates market forecast, partnerships, mergers and acquisitions, geographical expansion, and product/service launches, to enhance their presence in the industry.
Agropur Dairy Cooperative - Delivers a portfolio of specialized dairy ingredient solutions, including high-purity milk protein concentrates and isolates for advanced nutritional and functional applications.
The industry research and growth report includes detailed analyses of the competitive landscape of the market and information about key companies, including:
- Agropur Dairy Cooperative
- Arla Foods Ingredients Group
- Bega Cheese Ltd.
- Carbery Food Ingredients Ltd.
- Dairy Farmers of America Inc.
- DMK Deutsches Milchkontor GmbH
- EUROSERUM
- Frieslandcampina NV
- Glanbia plc
- Hilmar Cheese Co. Inc.
- Hoogwegt
- Idaho Milk Products Inc.
- Ingredia SA
- Kerry Group Plc
- LACTALIS Ingredients
- Leprino Foods Co.
- MILEI GmbH
- Saputo Dairy Australia Pty Ltd
- Saputo Inc.
- Synlait Milk Ltd.
Qualitative and quantitative analysis of companies has been conducted to help clients understand the wider business environment as well as the strengths and weaknesses of key industry players. Data is qualitatively analyzed to categorize companies as pure play, category-focused, industry-focused, and diversified; it is quantitatively analyzed to categorize companies as dominant, leading, strong, tentative, and weak.
Recent Development and News in Milk protein concentrates market
- In May 2025, Saputo Inc. unveiled a new strategic partnership with a group of dairy producers to implement a closed-loop processing system that optimizes the recovery of proteins while minimizing water waste during the concentration phase.
- In March 2025, Glanbia Performance Nutrition announced the launch of a new series of specialized protein recovery powders that utilize a proprietary blend of cold-processed milk protein concentrates to maximize the retention of bioactive peptides.
- In June 2025, Danone Nutricia unveiled a clinical-grade liquid supplement specifically formulated for post-operative recovery that incorporates a novel milk protein concentrate designed to accelerate muscle protein synthesis in immobilized patients.
- In August 2025, FrieslandCampina Ingredients successfully implemented a next-generation membrane technology at its primary production facility that significantly reduces the water footprint of the milk protein concentration process while enhancing the purity of the protein fractions.
Dive into Technavio’s robust research methodology, blending expert interviews, extensive data synthesis, and validated models for unparalleled Milk Protein Concentrates Market insights. See full methodology.
| Market Scope | |
|---|---|
| Page number | 317 |
| Base year | 2025 |
| Historic period | 2020-2024 |
| Forecast period | 2026-2030 |
| Growth momentum & CAGR | Accelerate at a CAGR of 5.8% |
| Market growth 2026-2030 | USD 1206.6 million |
| Market structure | Fragmented |
| YoY growth 2025-2026(%) | 5.5% |
| Key countries | US, Canada, Mexico, Germany, France, The Netherlands, UK, Italy, Spain, China, India, Japan, South Korea, Australia, Indonesia, Brazil, Argentina, Chile, Saudi Arabia, UAE, South Africa, Turkey and Israel |
| Competitive landscape | Leading Companies, Market Positioning of Companies, Competitive Strategies, and Industry Risks |
Research Analyst Overview
- The market is defined by its continuous innovation in ingredient science, driven by demand across diverse end-user segments. A key boardroom consideration is the investment in advanced processing technologies like the cold filtration method and spray drying technology to align with the clean-label formulation trend.
- Firms are leveraging membrane filtration technology, including ultrafiltration process and diafiltration techniques, to produce milk protein isolate and enhance protein concentration levels. The development of cold-processed protein using enzymatic modification is crucial for bioactive peptide retention. These advancements directly impact ingredient solubility, heat stability performance, and liquid formulation viscosity, ensuring a superior nutritional profile density and sustained amino acid release.
- For example, precise control over the protein-to-fat ratio in functional dairy solids improves product quality. This focus on technical excellence allows for the creation of high-value products for sports nutrition ingredient, clinical nutrition formula, and geriatric nutrition support applications.
- Advanced formulations also address challenges like age gelation prevention and sedimentation control in ready-to-drink beverage formats, while specialized ingredients such as milk fat globule membrane are being developed for infant formula base and meal replacement shake products.
- The ultimate goal is to enhance muscle protein synthesis in applications ranging from high-protein snack food to enteral feeding components and weight management food, with some processes improving bioactive retention by over 15%.
What are the Key Data Covered in this Milk Protein Concentrates Market Research and Growth Report?
-
What is the expected growth of the Milk Protein Concentrates Market between 2026 and 2030?
-
USD 1.21 billion, at a CAGR of 5.8%
-
-
What segmentation does the market report cover?
-
The report is segmented by Product (Dairy products, Nutritional products, and Others), Distribution Channel (Offline, and Online), Type (MPC 40, MPC 50, MPC 60, MPC 70, and MPC 80 and above), Source (Powder, and Liquid) and Geography (North America, Europe, APAC, South America, Middle East and Africa)
-
-
Which regions are analyzed in the report?
-
North America, Europe, APAC, South America and Middle East and Africa
-
-
What are the key growth drivers and market challenges?
-
Rising global demand for sports and performance nutrition, Volatility in raw milk pricing and procurement logistics
-
-
Who are the major players in the Milk Protein Concentrates Market?
-
Agropur Dairy Cooperative, Arla Foods Ingredients Group, Bega Cheese Ltd., Carbery Food Ingredients Ltd., Dairy Farmers of America Inc., DMK Deutsches Milchkontor GmbH, EUROSERUM, Frieslandcampina NV, Glanbia plc, Hilmar Cheese Co. Inc., Hoogwegt, Idaho Milk Products Inc., Ingredia SA, Kerry Group Plc, LACTALIS Ingredients, Leprino Foods Co., MILEI GmbH, Saputo Dairy Australia Pty Ltd, Saputo Inc. and Synlait Milk Ltd.
-
Market Research Insights
- Market dynamics are increasingly influenced by the demand for functional ingredient solutions that support proactive wellness food trends and ensure food system stability. The adoption of advanced protein fortification techniques has enabled manufacturers to improve food processing efficiency by 15%, reducing energy consumption.
- Simultaneously, the development of specialized health products and liquid nutritional supplements has led to formulations with a 20% reduction in artificial stabilizers, meeting consumer demand for cleaner labels. The strategic use of nutrient-dense ingredients in satiety-inducing snacks and meal replacements is driving a shift toward high-value applications, where nutritional medicine ingredients provide tangible health benefits.
We can help! Our analysts can customize this milk protein concentrates market research report to meet your requirements.
 RIA -
RIA - 
