Natural Gas Liquids (NGLs) Market Size 2025-2029
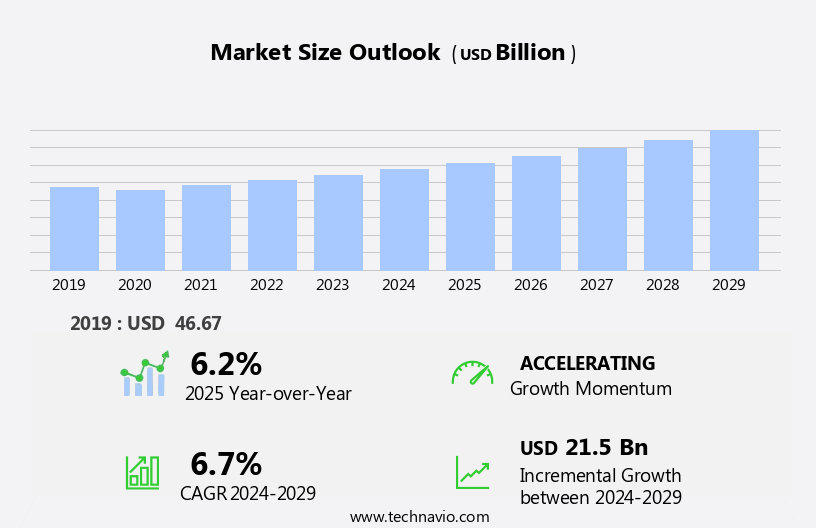
The natural gas liquids (NGLs) market size is forecast to increase by USD 21.5 billion, at a CAGR of 6.7% between 2024 and 2029.
- The market is experiencing significant growth, driven by the expanding petrochemical industry and increasing demand for renewable energy. The petrochemical sector's growth is fueled by the rising production of plastics and other chemicals, which require NGLs as feedstocks. Moreover, the shift towards cleaner energy sources is creating new opportunities for NGLs as they are often used as feedstocks in the production of biofuels and other renewable energy applications. However, the market faces challenges as well. Growing environmental concerns are pushing for stricter regulations on the production and use of NGLs due to their carbon footprint. Additionally, the volatility of crude oil prices and the availability of alternative feedstocks can impact the profitability of NGLs.
- Companies operating in the NGLs market must navigate these challenges by investing in sustainable production methods, exploring alternative feedstocks, and building strategic partnerships to stay competitive. By capitalizing on the growth opportunities and addressing these challenges effectively, players in the NGLs market can secure a strong market position and drive long-term success.
What will be the Size of the Natural Gas Liquids (NGLs) Market during the forecast period?
Explore in-depth regional segment analysis with market size data - historical 2019-2023 and forecasts 2025-2029 - in the full report.
Request Free Sample
The natural gas liquids (NGL) market is a dynamic and evolving sector, characterized by continuous shifts in supply and demand patterns and applications across various industries. NGLs, including propane, butane, and pentane, are derived from the natural gas value chain through a process called natural gas processing. These liquids find extensive use in various sectors, such as diesel production, hydrogen generation, and synthetic rubber manufacturing. Environmental regulations continue to shape the NGL market, with a focus on reducing greenhouse gas emissions and promoting carbon capture and energy efficiency. Cryogenic separation is a critical process in NGL production, enabling the separation of NGLs from natural gas through low-temperature distillation.
Fuel blending is another significant application of NGLs, with propane and butane used as fuel additives in gasoline and diesel to enhance combustion efficiency and reduce emissions. The ongoing transition towards renewable resources and sustainable development has led to the emergence of bio-based NGLs derived from renewable feedstocks. The NGL market is subject to market volatility due to price fluctuations and supply and demand imbalances. LNG terminals and LNG carriers play a crucial role in facilitating global trade, enabling the transportation of NGLs to markets where demand is high. The circular economy concept is gaining traction in the NGL industry, with a focus on maximizing the value of by-products and minimizing waste.
Fischer-tropsch synthesis is an emerging technology in the NGL market, enabling the conversion of natural gas into liquid hydrocarbons, including jet fuel and diesel. The potential for CO2 sequestration and emissions reduction through the utilization of NGLs in industrial processes and power generation is a significant area of research and development. Overall, the NGL market is a dynamic and evolving sector, with ongoing innovations and regulatory developments shaping its future.
How is this Natural Gas Liquids (NGLs) Industry segmented?
The natural gas liquids (NGLs) industry research report provides comprehensive data (region-wise segment analysis), with forecasts and estimates in "USD billion" for the period 2025-2029, as well as historical data from 2019-2023 for the following segments.
- Application
- Industrial
- Residential
- Commercial
- Product
- Propane
- Butane
- Pentane
- Ethane
- Geography
- North America
- US
- Canada
- Europe
- Norway
- Russia
- Middle East and Africa
- Iran
- Qatar
- UAE
- APAC
- Australia
- China
- Rest of World (ROW)
- North America
.
By Application Insights
The industrial segment is estimated to witness significant growth during the forecast period.
NGLs, such as ethane and propane, are vital components in the petrochemical industry, serving as essential feedstocks for the production of chemicals and plastics like ethylene, propylene, butadiene, and synthetic rubber. These building blocks are integral to various products, including plastics, synthetic rubber, detergents, and solvents. Propane and butane are also widely used as heating fuels for residential and industrial applications and as fuel for vehicles in areas with limited natural gas access or as LPG for cooking and heating. In refining operations, NGLs play a significant role. They undergo cryogenic separation to isolate individual components, which are then transported via pipelines or tankers for further processing.
Hydrogen production is another application for NGLs, which is increasingly gaining traction due to its use in hydrogen fuel cells and as a feedstock for ammonia and methanol production. The value chain of NGLs includes natural gas processing, storage, transportation, and end-use applications. Environmental regulations continue to shape the market, with a focus on reducing greenhouse gas emissions and promoting carbon capture and energy efficiency. Renewable resources and bio-based NGLs are emerging as alternatives, contributing to the circular economy and sustainable development. Market volatility is a constant factor, driven by supply and demand imbalances and price fluctuations.
NGLs are used as fuel blending components, fuel additives, and in the production of jet fuel, LNG, and LPG. The market's evolution is influenced by factors such as technological advancements, including Fischer-Tropsch synthesis and CO2 sequestration, and the increasing importance of emissions reduction strategies.
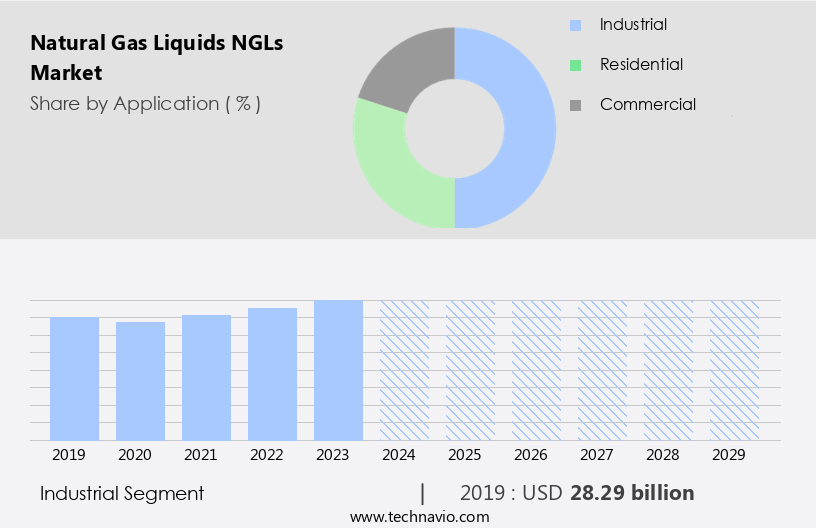
The Industrial segment was valued at USD 28.29 billion in 2019 and showed a gradual increase during the forecast period.
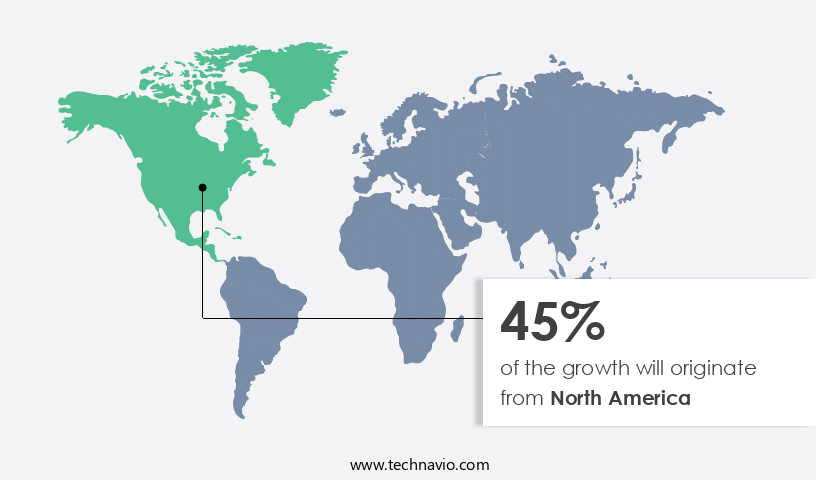
Regional Analysis
North America is estimated to contribute 45% to the growth of the global market during the forecast period.Technavio's analysts have elaborately explained the regional trends and drivers that shape the market during the forecast period.
The North American the market is experiencing substantial growth due to the increasing demand from the petrochemical industry. NGLs serve as crucial feedstocks for producing a vast array of chemicals and plastics. The expansion of industries such as automotive, construction, and packaging is driving the petrochemical sector's growth, consequently increasing NGL demand. The emergence of shale gas and oil production, particularly in the US, has led to a significant increase in natural gas production. Rich in NGL content, shale reservoirs further boost NGL output. The development of Liquefied Natural Gas (LNG) export facilities in North America has fueled the demand for NGLs, as they are often separated from natural gas before liquefaction and can be exported as a valuable product.
The value chain of NGLs includes cryogenic separation, storage in tanks, fuel blending, and various applications such as hydrogen production, synthetic rubber, and fuel additives. Environmental regulations have led to the adoption of carbon capture, energy efficiency, and emissions reduction technologies in NGL processing. Market volatility, price fluctuations, and the integration of renewable resources and bio-based NGLs are shaping the market's future trends. The circular economy and sustainable development are also influencing the NGL market, with LPG blending and CO2 sequestration gaining importance.
Market Dynamics
Our researchers analyzed the data with 2024 as the base year, along with the key drivers, trends, and challenges. A holistic analysis of drivers will help companies refine their marketing strategies to gain a competitive advantage.
What are the key market drivers leading to the rise in the adoption of Natural Gas Liquids (NGLs) Industry?
- The significant growth in demand for renewable energy serves as the primary market catalyst.
- The global market for Natural Gas Liquids (NGLs) is experiencing significant growth due to the increasing energy demand and the shift towards cleaner-burning fuels. NGLs, which include natural gas and its components such as ethane, propane, butane, and pentane, are gaining popularity as they emit fewer greenhouse gases compared to coal and oil during combustion. The demand for NGLs is driven by their extensive use as feedstock in various industries, particularly in the petrochemical sector. They are utilized in the production of plastics, chemicals, and synthetic rubber, among other products. The growth in these industries, fueled by industrial and commercial activities, is propelling the demand for NGLs.
- Moreover, NGLs are also used as feedstock in hydrogen production and diesel production processes. Hydrogen is a clean energy source that is increasingly being used for power generation and transportation. The renewable production of hydrogen using NGLs from renewable resources is also gaining traction. Pipeline transportation is the primary mode of transporting NGLs due to their liquid state at room temperature and their high energy density. The availability of ample storage capacity in the form of underground storage tanks ensures a consistent supply of NGLs to meet the growing demand. In conclusion, the NGLs market is poised for growth due to the increasing energy demand, the shift towards cleaner-burning fuels, and the extensive use of NGLs as feedstock in various industries.
- The market dynamics are driven by industrial growth, the need for cleaner energy, and the availability of efficient transportation and storage solutions.
What are the market trends shaping the Natural Gas Liquids (NGLs) Industry?
- The petrochemical industry is experiencing significant growth, making it a noteworthy market trend for professionals. This expansion signifies a promising opportunity for businesses and investments within this sector.
- The Natural Gas Liquids (NGL) market plays a pivotal role in the petrochemical industry as they serve as essential feedstocks for producing various products, including plastics, chemicals, and synthetic materials. Ethane, a significant component of NGLs, is particularly valuable as it is used in the production of ethylene, which is a fundamental building block for numerous petrochemicals. The escalating demand for these feedstocks has fueled the growth of the NGL market. A notable trend in the petrochemical sector is the construction and expansion of ethane cracker plants, which convert ethane into ethylene. These facilities have been established to capitalize on the abundant supply of low-cost ethane derived from NGLs.
- As the petrochemical industry expands, downstream processes, such as plastic and chemical production, follow suit. Moreover, environmental regulations are increasingly influencing the NGL market, with a focus on reducing greenhouse gas emissions and improving energy efficiency. Technological advancements, such as cryogenic separation and fuel blending, have been instrumental in addressing these concerns. Additionally, carbon capture and Fischer-Tropsch synthesis are emerging technologies that offer potential solutions for reducing the carbon footprint of the petrochemical industry. In conclusion, the NGL market is experiencing robust growth due to the increasing demand for feedstocks in the petrochemical industry.
- The construction of ethane cracker plants and the expansion of downstream processes are significant trends. Furthermore, environmental regulations and technological advancements are shaping the market's future direction, with a focus on reducing greenhouse gas emissions, improving energy efficiency, and developing sustainable production methods.
What challenges does the Natural Gas Liquids (NGLs) Industry face during its growth?
- The expansion of the industry faces significant hurdles due to increasing environmental concerns, which necessitates implementing sustainable business practices to ensure continued growth.
- Natural Gas Liquids (NGLs) are essential by-products of natural gas processing. The supply and demand dynamics of NGLs are influenced by various factors. Methane emissions, a potent greenhouse gas, are a significant concern in the extraction and transportation of natural gas and NGLs. Strict environmental regulations, such as methane emissions limits, increase compliance costs for producers and impact the economics of NGL projects. Moreover, the rapid growth of renewable energy sources, like wind and solar, poses a competitive challenge to natural gas and NGLs in power generation. Renewable energy provides carbon-free electricity, reducing the demand for natural gas.
- These factors contribute to market volatility and price fluctuations in the NGL market. Propane blending and use as fuel additives are primary applications for NGLs. Propane is widely used as a fuel for heating and cooking in residential and commercial applications. As a fuel additive, it enhances the combustion efficiency of gasoline and diesel fuels. These uses provide stability to the NGL market despite the challenges. In conclusion, the NGL market faces challenges from environmental regulations and renewable energy sources. However, the demand for propane as a fuel and fuel additive provides stability to the market.
- Understanding these market dynamics is crucial for businesses involved in the production, transportation, and consumption of NGLs.
Exclusive Customer Landscape
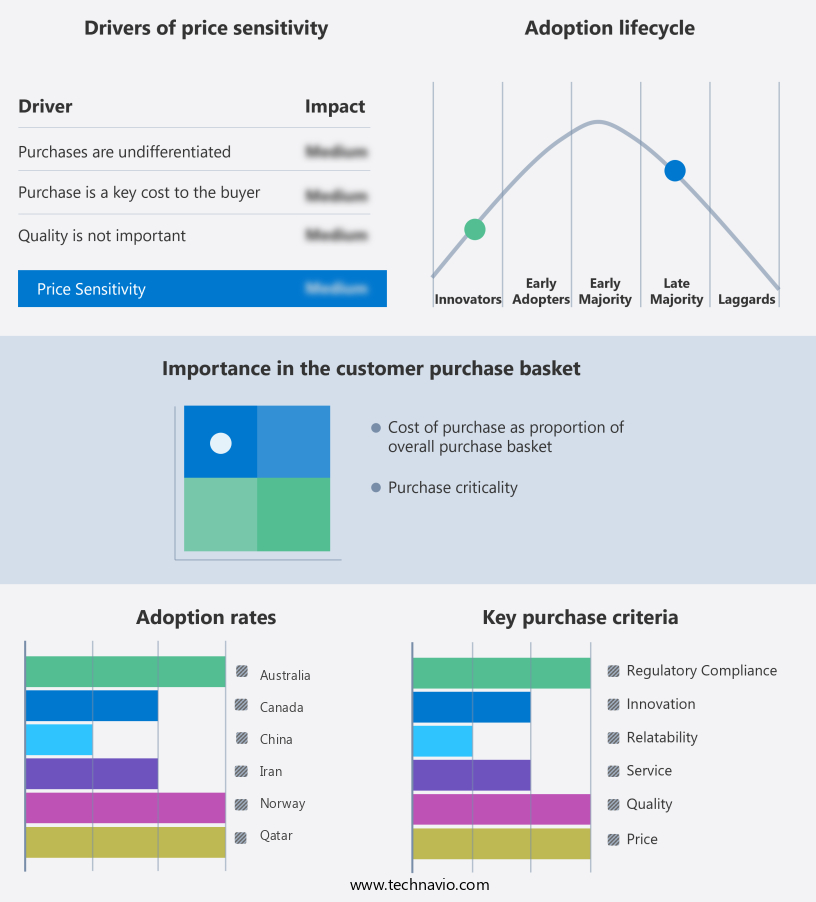
The natural gas liquids (NGLs) market forecasting report includes the adoption lifecycle of the market, covering from the innovator's stage to the laggard's stage. It focuses on adoption rates in different regions based on penetration. Furthermore, the natural gas liquids (NGLs) market report also includes key purchase criteria and drivers of price sensitivity to help companies evaluate and develop their market growth analysis strategies.
Customer Landscape
Key Companies & Market Insights
Companies are implementing various strategies, such as strategic alliances, natural gas liquids (ngls) market forecast, partnerships, mergers and acquisitions, geographical expansion, and product/service launches, to enhance their presence in the industry.
BP Plc - The company specializes in the production and distribution of natural gas liquids (NGLs), including Ethane, Propane, Normal Butane, and Isobutane.
The industry research and growth report includes detailed analyses of the competitive landscape of the market and information about key companies, including:
- BP Plc
- Canadian Natural Resources Ltd.
- Chevron Corp.
- Citizen Energy
- ConocoPhillips Co.
- Equinor ASA
- Expand Energy Corp.
- Exxon Mobil Corp.
- Nigeria LNG Ltd.
- Ovintiv Inc.
- Petroleos de Venezuela SA
- PJSC LUKOIL
- PT Pertamina Persero
- Repsol S.A.
- Saudi Arabian Oil Co.
- Shell plc
- SilverBow Resources Inc.
- SM ENERGY CO.
- TotalEnergies SE
- Valero Energy Corp.
Qualitative and quantitative analysis of companies has been conducted to help clients understand the wider business environment as well as the strengths and weaknesses of key industry players. Data is qualitatively analyzed to categorize companies as pure play, category-focused, industry-focused, and diversified; it is quantitatively analyzed to categorize companies as dominant, leading, strong, tentative, and weak.
Recent Development and News in Natural Gas Liquids (NGLs) Market
- In March 2024, Shell and Chevron announced a strategic collaboration to expand their NGLs business in the Permian Basin. The partnership aimed to increase their combined NGLs production capacity by 25%, making them major players in the region (Shell press release, 2024).
- In July 2024, Kinder Morgan, the leading pipeline transportation and energy infrastructure company, completed the expansion of its Seaway Pipeline system, which increased its capacity to transport NGLs from the Mont Belvieu hub in Texas to the Gulf Coast by 20%. This expansion further strengthened Kinder Morgan's position as a key player in the NGLs market (Kinder Morgan press release, 2024).
- In November 2024, ExxonMobil received regulatory approval from the U.S. Department of Energy to construct a new NGLs export terminal in Texas. The terminal, named the Golden Pass NGL Export Terminal, will have an initial capacity of 1.4 million metric tons per year and is expected to create significant economic opportunities in the region (ExxonMobil press release, 2024).
- In February 2025, Linde plc, a leading industrial gases company, launched a new technology called 'Cryo-Flex', which enables the transportation of NGLs in flexible pipelines. This innovation is expected to reduce the capital investment required for NGLs infrastructure projects and increase the efficiency of the NGLs supply chain (Linde press release, 2025).
Research Analyst Overview
- Natural Gas Liquids (NGLs) are a valuable byproduct of the natural gas industry, consisting of ethane, propane, butane, isobutane, pentanes, and other hydrocarbons. These components are extracted from natural gas through a process called fractionation, which separates the NGLs from the methane gas. NGLs play a significant role in various industries, including petrochemicals, energy, and transportation. Ethane and propane are commonly used as feedstocks in the production of ethylene and propylene, key building blocks for the manufacturing of plastics and other chemicals. Butane and isobutane are utilized as fuel components and as feedstocks in the production of butylene and other petrochemicals.
- The NGL market is influenced by several factors. The energy sector's demand for NGLs as refinery feedstocks and as fuel components in power generation is a significant driver. Natural gas processing plants and fractionation facilities are essential infrastructure for NGL production and distribution. Gas pipelines, tanker transport, rail transport, and truck transport are critical for the movement of NGLs from production sites to markets. Underground and aboveground storage facilities are necessary for the storage of NGLs, particularly for those used as fuel components. Export and import terminals facilitate international trade in NGLs. The petrochemical industry's demand for NGLs as feedstocks is a significant driver for the market's growth.
- In the Natural Gas Liquids market is a critical component of the global energy landscape, with applications ranging from fuel to petrochemical feedstocks. The market's dynamics are influenced by various factors, including production capacity, demand, and the supply chain. The versatility of NGLs and their role in various industries make them an essential component of the global energy landscape.
Dive into Technavio's robust research methodology, blending expert interviews, extensive data synthesis, and validated models for unparalleled Natural Gas Liquids (NGLs) Market insights. See full methodology.
|
Market Scope |
|
|
Report Coverage |
Details |
|
Page number |
207 |
|
Base year |
2024 |
|
Historic period |
2019-2023 |
|
Forecast period |
2025-2029 |
|
Growth momentum & CAGR |
Accelerate at a CAGR of 6.7% |
|
Market growth 2025-2029 |
USD 21.5 billion |
|
Market structure |
Fragmented |
|
YoY growth 2024-2025(%) |
6.2 |
|
Key countries |
US, Russia, China, Iran, Canada, Saudi Arabia, Qatar, UAE, Norway, and Australia |
|
Competitive landscape |
Leading Companies, Market Positioning of Companies, Competitive Strategies, and Industry Risks |
What are the Key Data Covered in this Natural Gas Liquids (NGLs) Market Research and Growth Report?
- CAGR of the Natural Gas Liquids (NGLs) industry during the forecast period
- Detailed information on factors that will drive the growth and forecasting between 2025 and 2029
- Precise estimation of the size of the market and its contribution of the industry in focus to the parent market
- Accurate predictions about upcoming growth and trends and changes in consumer behaviour
- Growth of the market across North America, Middle East and Africa, Europe, APAC, and South America
- Thorough analysis of the market's competitive landscape and detailed information about companies
- Comprehensive analysis of factors that will challenge the natural gas liquids (ngls) market growth of industry companies
We can help! Our analysts can customize this natural gas liquids (ngls) market research report to meet your requirements.
 RIA -
RIA - 
