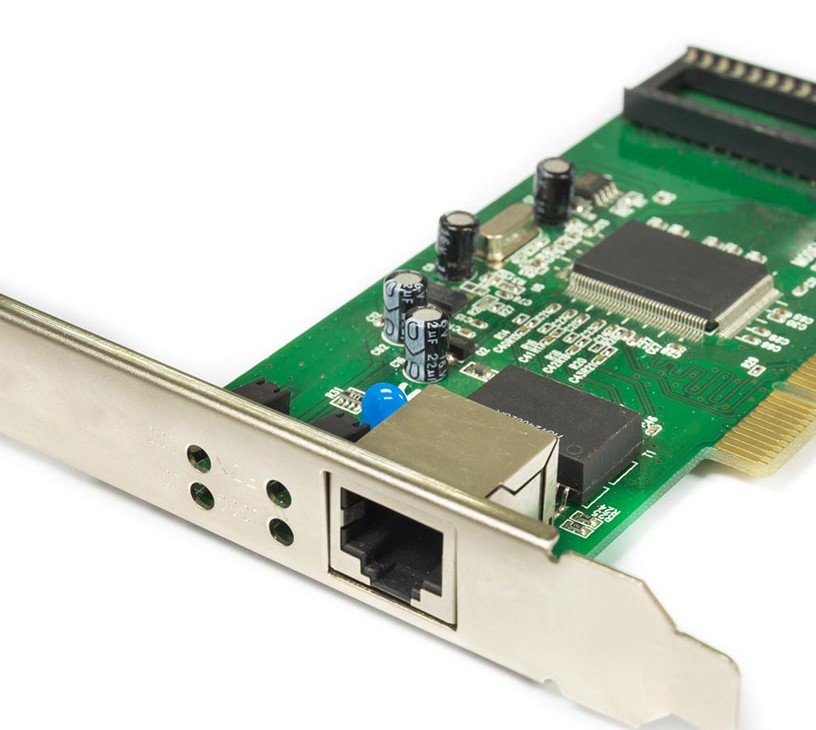
Network Interface Cards Market Size 2026-2030
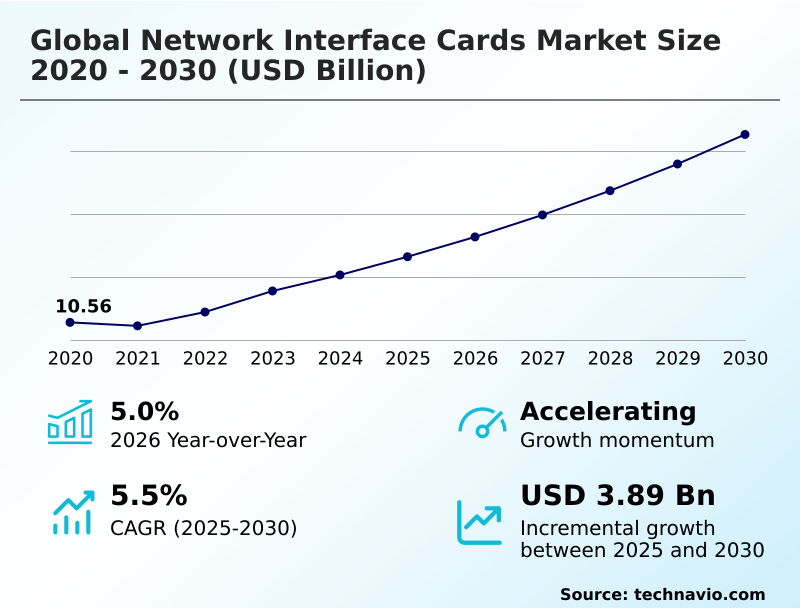
The network interface cards market size is valued to increase by USD 3.89 billion, at a CAGR of 5.5% from 2025 to 2030. Increasing data traffic and demand for higher bandwidth will drive the network interface cards market.
Major Market Trends & Insights
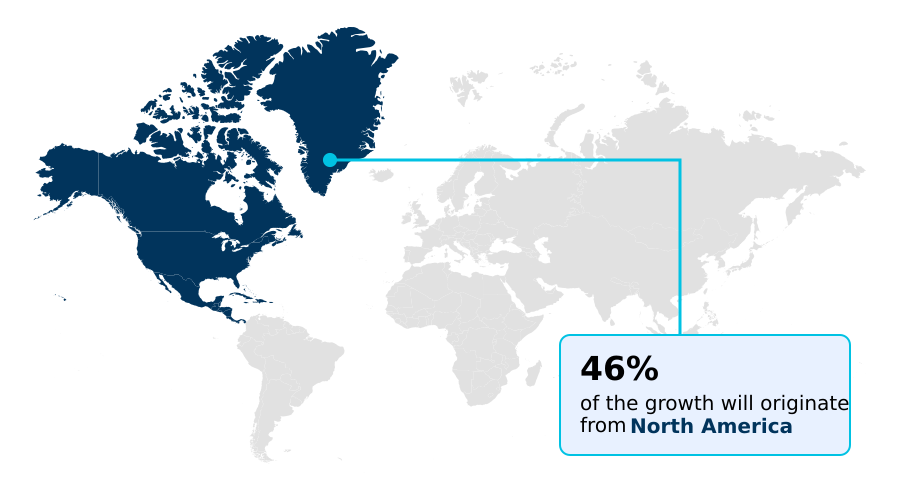
- North America dominated the market and accounted for a 45.9% growth during the forecast period.
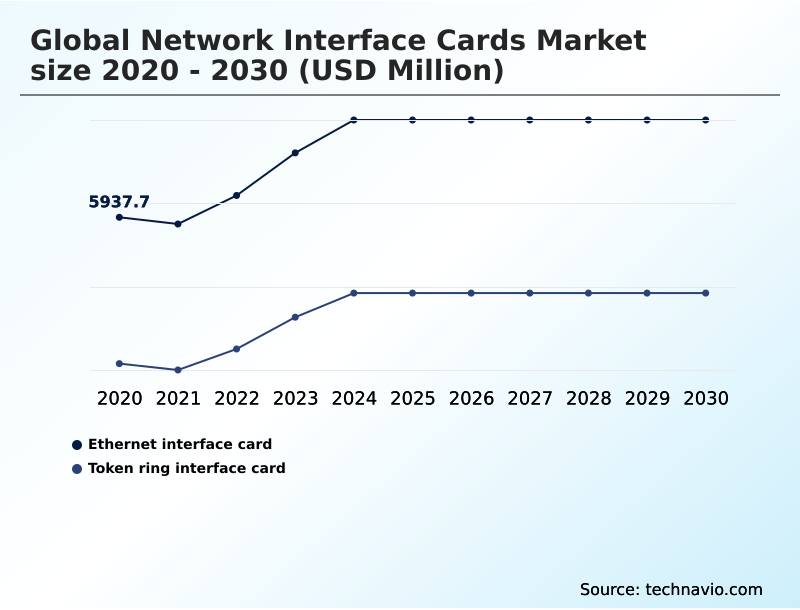
- By Type - Ethernet interface card segment was valued at USD 6.81 billion in 2024
- By Application - PCs segment accounted for the largest market revenue share in 2024
Market Size & Forecast
- Market Opportunities: USD 5.98 billion
- Market Future Opportunities: USD 3.89 billion
- CAGR from 2025 to 2030 : 5.5%
Market Summary
- The network interface cards market is central to modern digital infrastructure, facilitating communication for everything from personal computers to hyperscale data centers. Growth is propelled by the exponential rise in data volumes, compelling upgrades to higher-speed interconnects. A dominant trend is the architectural shift from basic connectivity hardware to intelligent platforms like smartnic and data processing units.
- These devices feature onboard processors to handle complex networking, security, and storage tasks, liberating host CPUs. This hardware offload is critical in scenarios such as a large cloud provider seeking to maximize server density.
- By moving network virtualization overlay processing to the dpu, the provider can reclaim valuable CPU cycles for billable customer workloads, significantly improving the total cost of ownership. However, this innovation occurs amidst persistent supply chain disruptions and escalating research and development costs, which challenge company roadmaps and product availability.
- The market's future hinges on balancing the demand for higher performance with these operational and economic pressures, pushing for more efficient and disaggregated infrastructure models that utilize advanced technologies like remote direct memory access and sr-iov.
What will be the Size of the Network Interface Cards Market during the forecast period?
Get Key Insights on Market Forecast (PDF) Get Free Sample
How is the Network Interface Cards Market Segmented?
The network interface cards industry research report provides comprehensive data (region-wise segment analysis), with forecasts and estimates in "USD million" for the period 2026-2030, as well as historical data from 2020-2024 for the following segments.
- Type
- Ethernet interface card
- Token ring interface card
- Application
- PCs
- Portable PCs
- Switches
- Modems
- End-user
- Data centre
- Networking service providers
- Others
- Geography
- North America
- US
- Canada
- Mexico
- Europe
- Germany
- UK
- France
- APAC
- China
- Japan
- India
- South America
- Brazil
- Argentina
- Colombia
- Middle East and Africa
- UAE
- Saudi Arabia
- Israel
- Rest of World (ROW)
- North America
By Type Insights
The ethernet interface card segment is estimated to witness significant growth during the forecast period.
The ethernet interface card segment is foundational to the digital framework, evolving from integrated lan-on-motherboard solutions to high-speed discrete pcie cards.
The market's trajectory is defined by a relentless demand for higher bandwidth, with a clear progression toward advanced ethernet controller technology.
This evolution is most pronounced in high-performance computing environments and data centers, where the architectural shift to intelligent adapters like smartnic and data processing units is critical.
These sophisticated devices enable hardware offload of networking and security tasks, which improves overall server efficiency.
By offloading these functions from the host CPU, organizations can achieve a more favorable total cost of ownership, improving server utilization for revenue-generating applications by up to 30%.
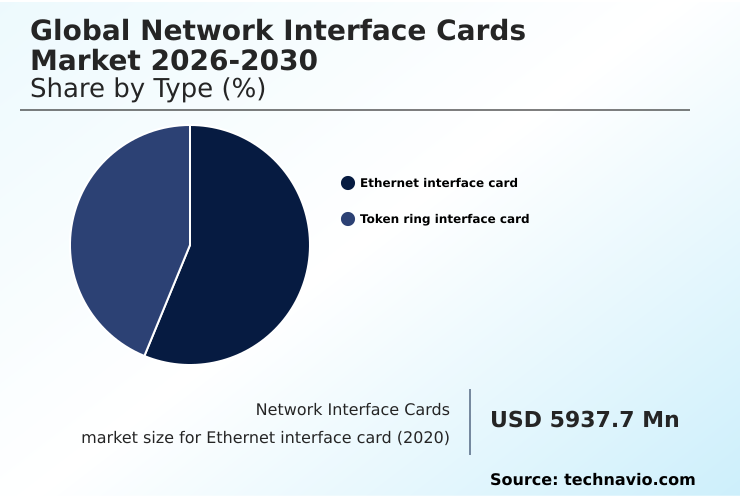
The Ethernet interface card segment was valued at USD 6.81 billion in 2024 and showed a gradual increase during the forecast period.
Regional Analysis
North America is estimated to contribute 45.9% to the growth of the global market during the forecast period.Technavio’s analysts have elaborately explained the regional trends and drivers that shape the market during the forecast period.
See How Network Interface Cards Market Demand is Rising in North America Get Free Sample
The global network interface cards market 2026-2030 exhibits distinct regional dynamics, with North America leading in technological adoption, contributing over 45% of the incremental growth.
This is driven by hyperscale data centers leveraging advanced technologies like rdma and roce for low-latency workloads.
In contrast, the APAC region, accounting for nearly 24% of growth, is the fastest-expanding market due to massive investments in 5G and new data center builds.
European demand is shaped by stringent data sovereignty rules, fueling adoption of solutions with a hardware root of trust and robust network virtualization overlay capabilities for secure multi-tenancy.
For example, financial institutions in North America utilize kernel bypass technology to achieve nanosecond-level latency reductions, while operators in APAC focus on scalable nvme over fabrics deployments.
The global landscape is unified by the need for advanced packet processing capabilities across all regions.
Market Dynamics
Our researchers analyzed the data with 2025 as the base year, along with the key drivers, trends, and challenges. A holistic analysis of drivers will help companies refine their marketing strategies to gain a competitive advantage.
- Strategic infrastructure decisions increasingly revolve around a detailed smartnic vs dpu performance comparison, as enterprises and cloud providers aim to optimize their data centers. The implementation of technologies offering rdma over converged ethernet benefits is pivotal for applications demanding ultra-low latency, such as high-performance computing.
- Concurrently, the rising threat landscape elevates the importance of hardware accelerated network security features, which provide protection without compromising performance. For large-scale operators, the adoption of an ocp nic for hyperscale data centers has become a standard practice to ensure interoperability and cost efficiency.
- A key focus area is optimizing east-west traffic flow, where modern architectures have demonstrated a performance uplift in distributed computing tasks that is twice that of legacy designs. Many architects are exploring the benefits of kernel bypass technology to further reduce processing overhead.
- In telecommunications, the use of a dpu for telco network function virtualization is becoming critical for 5G rollouts. Similarly, enabling sr-iov in multi-tenant cloud environments is essential for providing secure, near-native network performance to virtual machines. The advent of pcie gen5 is set to remove bottlenecks, highlighting the pcie gen5 impact on nic speed.
- This leads to a continuous lan-on-motherboard vs discrete nic debate for different tiers of servers. Ultimately, metrics on vxlan offload performance gains and nvme over fabrics latency reduction guide procurement. The efficiency of a tcp offload engine, the use of pam4 modulation for 400g ethernet, and the design of a spine-leaf architecture for low latency are all crucial considerations.
What are the key market drivers leading to the rise in the adoption of Network Interface Cards Industry?
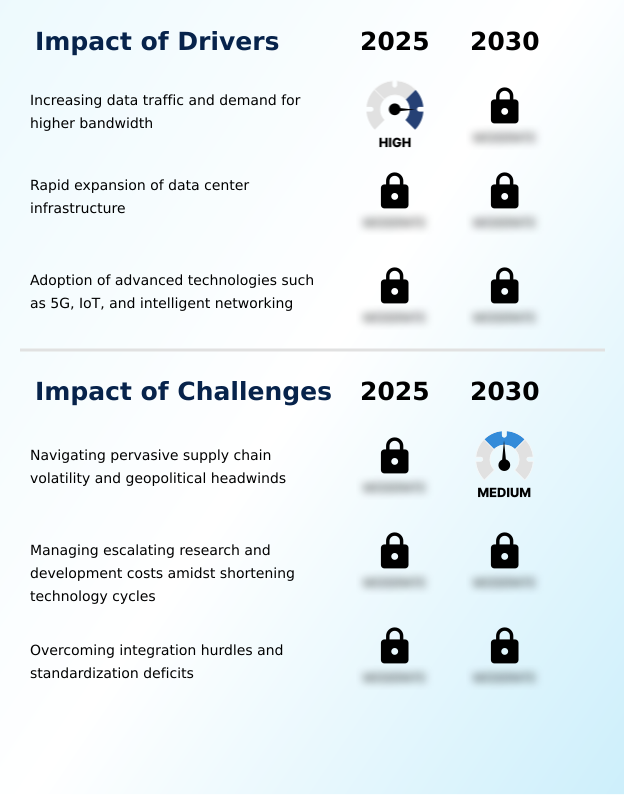
- The relentless increase in global data traffic and the corresponding demand for higher bandwidth serve as the primary driver for market growth.
- The market's growth is fundamentally driven by the exponential increase in data, necessitating continuous infrastructure upgrades. The expansion of data centers with advanced spine-leaf architecture designs to manage massive volumes of east-west traffic is a primary catalyst.
- These environments demand low latency interconnect solutions beyond traditional ethernet, such as infiniband. Supporting emerging AI workloads, which can require a 10x increase in network throughput, is another key driver.
- The rollout of 5G and edge computing also creates new demand for intelligent network processing unit based cards that can deliver enhanced quality of service.
- This convergence of technologies, built on high-speed serdes, pushes the entire data plane to new performance levels.
What are the market trends shaping the Network Interface Cards Industry?
- The ascendant trend of open networking and hardware disaggregation is fundamentally reshaping the market. This shift decouples hardware from software, fostering greater interoperability and competition.
- Key trends are reshaping the network interface cards market, led by the shift toward open, disaggregated infrastructure. The adoption of standards like the ocp nic allows hyperscalers to reduce hardware procurement costs by up to 20%. Concurrently, the pivot to intelligent hardware, including the dpu and advanced application-specific integrated circuit designs, is transformative.
- These devices provide data plane programmability, enabling a secure control plane and offloading tasks from the host CPU. This can free up as many as 30% of host cores in a multi-tenant cloud environment.
- Furthermore, the integration of single root i/o virtualization and zero-trust security principles directly onto the card is becoming standard, creating a more secure and efficient foundation for modern applications.
What challenges does the Network Interface Cards Industry face during its growth?
- Navigating pervasive supply chain volatility and significant geopolitical headwinds presents a key challenge that affects industry growth and stability.
- Significant challenges confront the network interface cards market, primarily stemming from supply chain volatility, where component lead times have increased by over 200% in certain periods. This instability impacts production schedules for all types of hardware, from a basic virtual interface card to a complex multi-host nic.
- The rapid pace of innovation also presents hurdles; developing technologies like pam4 for high-speed signaling or advanced field-programmable gate array designs requires massive R&D investment. Furthermore, the lack of a unified programming standard for intelligent NICs can increase integration costs by an estimated 25% for enterprise adopters, complicating tasks like deep packet inspection.
- Ensuring line rate performance while managing features like link aggregation and tcp offload engine functions remains a complex engineering feat.
Exclusive Technavio Analysis on Customer Landscape
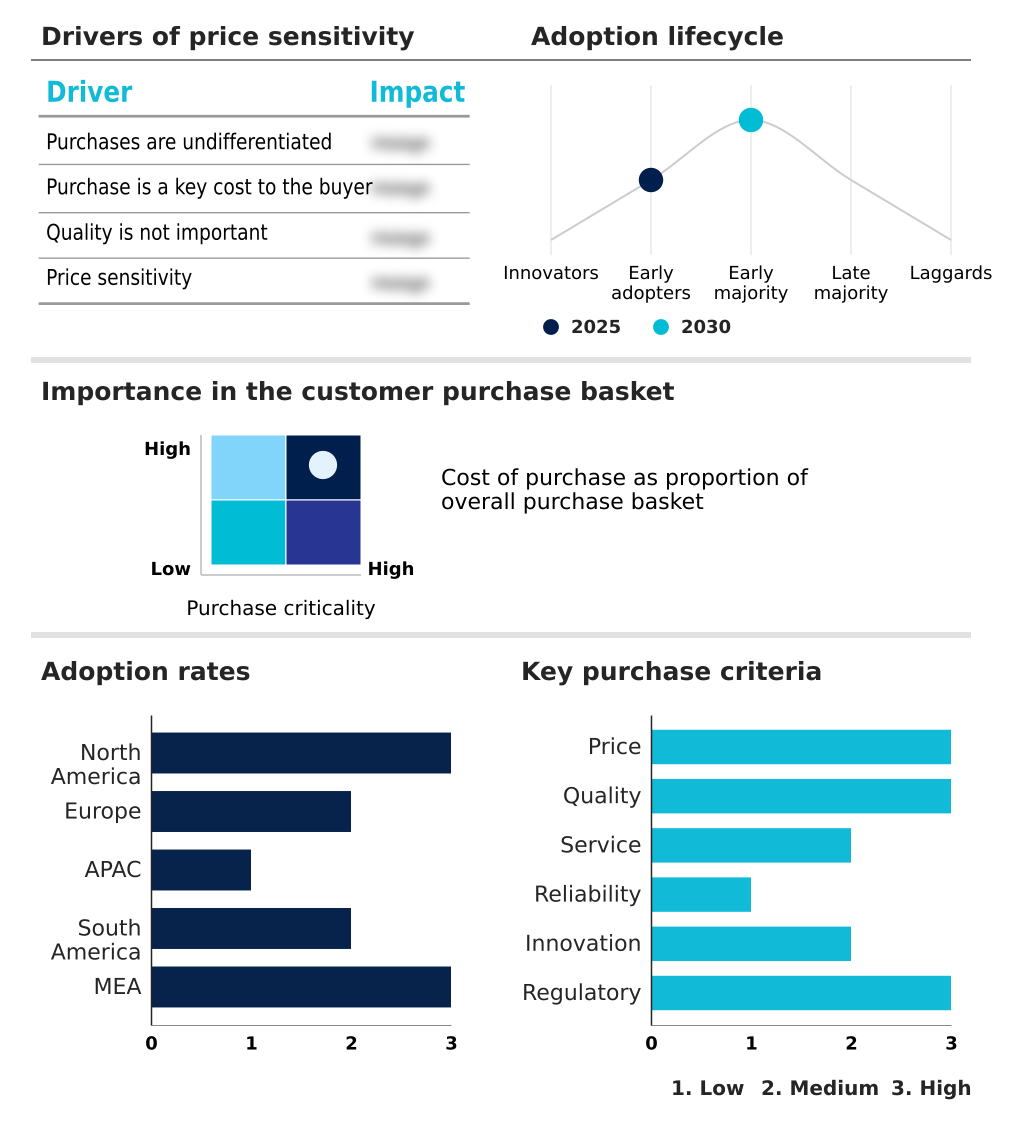
The network interface cards market forecasting report includes the adoption lifecycle of the market, covering from the innovator’s stage to the laggard’s stage. It focuses on adoption rates in different regions based on penetration. Furthermore, the network interface cards market report also includes key purchase criteria and drivers of price sensitivity to help companies evaluate and develop their market growth analysis strategies.
Customer Landscape of Network Interface Cards Industry
Competitive Landscape
Companies are implementing various strategies, such as strategic alliances, network interface cards market forecast, partnerships, mergers and acquisitions, geographical expansion, and product/service launches, to enhance their presence in the industry.
ASUSTeK Computer Inc. - Offerings encompass a range of high-performance network connectivity solutions, from enterprise-grade adapters to advanced data center interconnects designed for scalable, high-throughput environments.
The industry research and growth report includes detailed analyses of the competitive landscape of the market and information about key companies, including:
- ASUSTeK Computer Inc.
- Broadcom Inc.
- Buffalo Americas Inc.
- Chelsio Communications
- Cisco Systems Inc.
- D Link Corp.
- Huawei Technologies Co. Ltd.
- Juniper Networks Inc.
- Molex LLC
- NETGEAR Inc.
- NVIDIA Corp.
- Opto 22
- RAD Data Communications Ltd.
- Renesas Electronics Corp.
- Sierra Wireless
- StarTech.com Ltd.
- Taiwan Commate Computer Inc.
- TP Link Corp. Ltd.
- TRENDnet Inc.
Qualitative and quantitative analysis of companies has been conducted to help clients understand the wider business environment as well as the strengths and weaknesses of key industry players. Data is qualitatively analyzed to categorize companies as pure play, category-focused, industry-focused, and diversified; it is quantitatively analyzed to categorize companies as dominant, leading, strong, tentative, and weak.
Recent Development and News in Network interface cards market
- In August 2025, Broadcom Inc. detailed its strategy to make VMware Cloud Foundation an AI-native platform, a move designed to bundle network virtualization and management deeply within its private cloud infrastructure stack.
- In January 2025, the government of India launched a large-scale public-private partnership to create a nationwide network of edge data centers, a project that includes substantial incentives for the domestic manufacturing of IT hardware.
- In February 2025, a consortium of leading US-based cloud service providers and enterprise technology companies announced the formation of the Next Generation Interconnect Alliance and Ultra Accelerator Link (UALink) Consortium, establishing new open standards for high-speed AI and HPC interconnects.
- In March 2025, Marvell Technology Inc. announced the inauguration of a new manufacturing facility in Malaysia dedicated to the production of advanced network interface cards to meet escalating global demand and diversify its supply chain.
Dive into Technavio’s robust research methodology, blending expert interviews, extensive data synthesis, and validated models for unparalleled Network Interface Cards Market insights. See full methodology.
| Market Scope | |
|---|---|
| Page number | 302 |
| Base year | 2025 |
| Historic period | 2020-2024 |
| Forecast period | 2026-2030 |
| Growth momentum & CAGR | Accelerate at a CAGR of 5.5% |
| Market growth 2026-2030 | USD 3891.8 million |
| Market structure | Fragmented |
| YoY growth 2025-2026(%) | 5.0% |
| Key countries | US, Canada, Mexico, Germany, UK, France, Italy, Spain, The Netherlands, China, Japan, India, South Korea, Australia, Indonesia, Brazil, Argentina, Colombia, UAE, Saudi Arabia, Israel, South Africa and Egypt |
| Competitive landscape | Leading Companies, Market Positioning of Companies, Competitive Strategies, and Industry Risks |
Research Analyst Overview
- The network interface cards market is an indispensable and rapidly evolving sector, moving beyond basic connectivity to become a third pillar of computation. The technological landscape is dominated by the transition to higher speeds using advanced serdes and the rise of intelligent adapters such as the smartnic and data processing units.
- This architectural shift, which integrates components like a network processing unit or field-programmable gate array, is critical. Boardroom decisions now weigh the higher capital expenditure on dpus against long-term operational savings from improved server efficiency. For instance, implementations leveraging remote direct memory access have shown to reduce application latency by over 50% in high-performance computing clusters.
- Innovations span from the ethernet controller and virtual interface card to high-speed interconnects like infiniband. The adoption of technologies including single root i/o virtualization and kernel bypass on pcie platforms allows for unprecedented performance, making the choice of network adapter a key strategic decision.
What are the Key Data Covered in this Network Interface Cards Market Research and Growth Report?
-
What is the expected growth of the Network Interface Cards Market between 2026 and 2030?
-
USD 3.89 billion, at a CAGR of 5.5%
-
-
What segmentation does the market report cover?
-
The report is segmented by Type (Ethernet interface card, and Token ring interface card), Application (PCs, Portable PCs, Switches, and Modems), End-user (Data centre, Networking service providers, and Others) and Geography (North America, Europe, APAC, South America, Middle East and Africa)
-
-
Which regions are analyzed in the report?
-
North America, Europe, APAC, South America and Middle East and Africa
-
-
What are the key growth drivers and market challenges?
-
Increasing data traffic and demand for higher bandwidth, Navigating pervasive supply chain volatility and geopolitical headwinds
-
-
Who are the major players in the Network Interface Cards Market?
-
ASUSTeK Computer Inc., Broadcom Inc., Buffalo Americas Inc., Chelsio Communications, Cisco Systems Inc., D Link Corp., Huawei Technologies Co. Ltd., Juniper Networks Inc., Molex LLC, NETGEAR Inc., NVIDIA Corp., Opto 22, RAD Data Communications Ltd., Renesas Electronics Corp., Sierra Wireless, StarTech.com Ltd., Taiwan Commate Computer Inc., TP Link Corp. Ltd. and TRENDnet Inc.
-
Market Research Insights
- Market dynamics are defined by a strategic shift from simple connectivity to intelligent infrastructure management at the server edge, emphasizing data plane programmability. This evolution is driven by the need for superior line rate performance in data-intensive environments.
- For instance, the adoption of hardware offload techniques has been shown to reduce CPU utilization for networking tasks by over 40%, directly boosting application performance. Furthermore, embedding inline cryptography within the network adapter can accelerate encrypted traffic flows by more than 50% compared to traditional software-based methods.
- This focus on intelligent packet processing and enhanced control plane integration allows organizations to build more secure and efficient disaggregated infrastructure, optimizing both performance and operational expenditure.
We can help! Our analysts can customize this network interface cards market research report to meet your requirements.
 RIA -
RIA - 
