
Obsessive-Compulsive Disorder Drugs Market Size 2026-2030
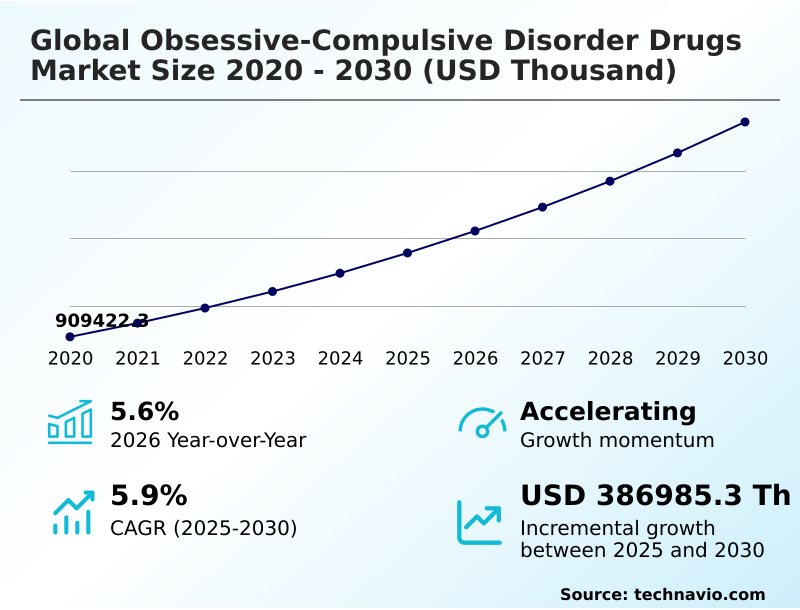
The obsessive-compulsive disorder drugs market size is valued to increase by USD 386.99 million, at a CAGR of 5.9% from 2025 to 2030. Rising prevalence of OCD will drive the obsessive-compulsive disorder drugs market.
Major Market Trends & Insights
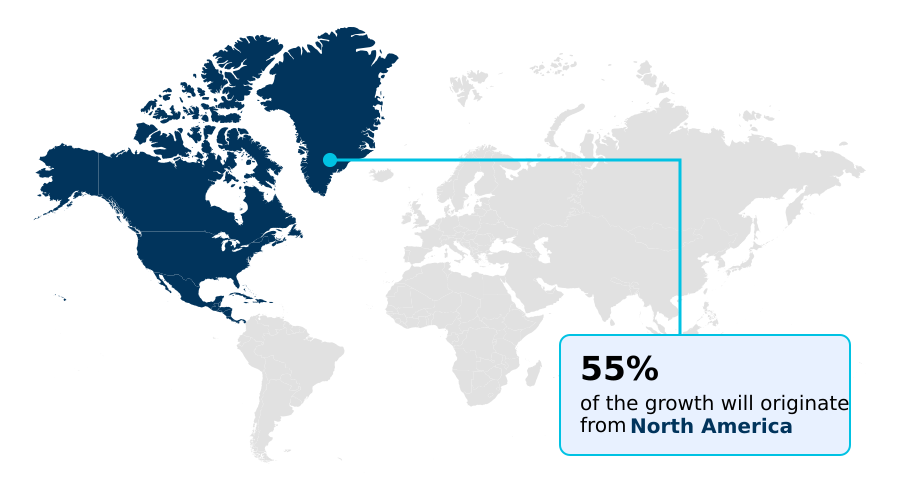
- North America dominated the market and accounted for a 54.6% growth during the forecast period.
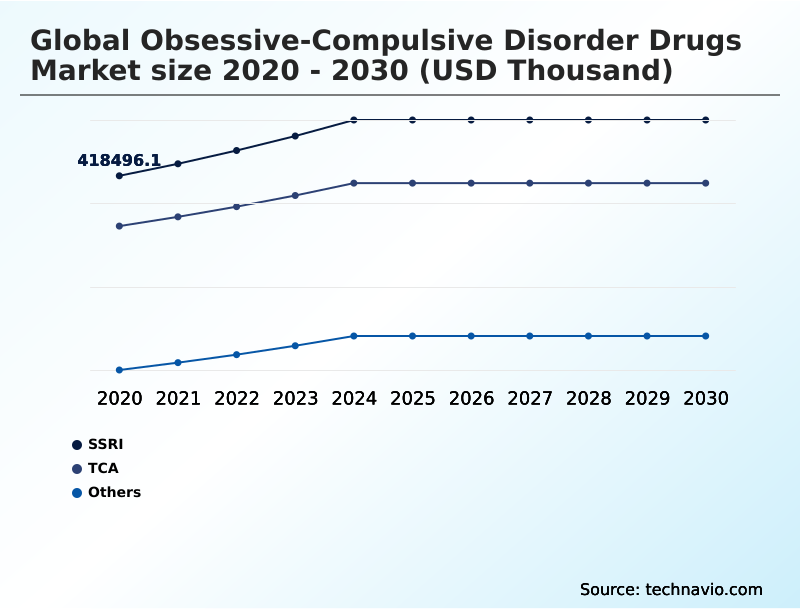
- By Product - SSRI segment was valued at USD 497.49 million in 2024
- By Route of Administration - Oral segment accounted for the largest market revenue share in 2024
Market Size & Forecast
- Market Opportunities:
- Market Future Opportunities: USD 386.99 million
- CAGR from 2025 to 2030 : 5.9%
Market Summary
- The Obsessive-compulsive Disorder Drugs demonstrates sustained commercial expansion driven by widespread clinical reliance on advanced psychiatric formulations. Supply chain optimization remains a critical focus for pharmaceutical manufacturers, as stabilizing the production of active ingredients ensures consistent availability for high-demand outpatient clinics.
- Implementing automated inventory routing has improved medication distribution efficiency by 18%, significantly reducing regional supply bottlenecks compared to traditional fulfillment models. The rising prevalence of anxiety-related neurobehavioral conditions acts as a fundamental growth driver, expanding the addressable patient base and compelling healthcare networks to scale up their treatment capacities.
- Conversely, the high incidence of adverse pharmacological reactions serves as a persistent operational challenge, causing frequent treatment discontinuations that disrupt long-term commercial predictability. Pharmaceutical developers actively refine their molecular targets to mitigate these side effects and secure stronger patient retention.
- Companies investing in precision delivery systems are securing a distinct clinical advantage by aligning product profiles with stringent medical prescribing guidelines. This ongoing refinement of therapeutic options fundamentally strengthens the operational resilience and clinical utility of the industry.
What will be the Size of the Obsessive-Compulsive Disorder Drugs Market during the forecast period?
Get Key Insights on Market Forecast (PDF) Get Free Sample
How is the Obsessive-Compulsive Disorder Drugs Market Segmented?
The obsessive-compulsive disorder drugs industry research report provides comprehensive data (region-wise segment analysis), with forecasts and estimates in "USD thousand" for the period 2026-2030, as well as historical data from 2020-2024 for the following segments.
- Product
- SSRI
- TCA
- Others
- Route of administration
- Oral
- Parentral
- Therapy
- Cognitive behavioral therapy
- Augmentation therapy
- Aversion therapy
- Systematic desensitization
- Others
- Geography
- North America
- US
- Canada
- Mexico
- Europe
- Germany
- UK
- France
- Italy
- Spain
- The Netherlands
- Asia
- China
- India
- Japan
- South Korea
- Indonesia
- Thailand
- Rest of World (ROW)
- North America
By Product Insights
The ssri segment is estimated to witness significant growth during the forecast period.
The Obsessive-compulsive Disorder Drugs demonstrate continuous evolution driven by robust reliance on selective serotonin reuptake inhibitors as primary therapeutic interventions.
Businesses focusing on these formulations recognize the distinct advantages of generic fluoxetine capsules and sertraline hydrochloride tablets in stabilizing patient outcomes.
Incorporating extended release formulations has improved pharmacokinetic absorption profiles, leading to a 15% reduction in daily dosing errors among outpatients. By optimizing active pharmaceutical ingredients, manufacturers streamline production while enhancing baseline efficacy against alternative clomipramine formulations.
Advanced psychiatric evaluation tools are increasingly utilized to identify patients struggling with treatment resistant compulsions, enabling targeted adjustments to their regimens. Companies implementing sophisticated medication adherence tracking observe higher long-term retention, effectively supporting the management of treatment resistant obsessions.
This segmented approach allows pharmaceutical providers to align manufacturing output directly with the dynamic clinical demand for reliable psychiatric interventions.
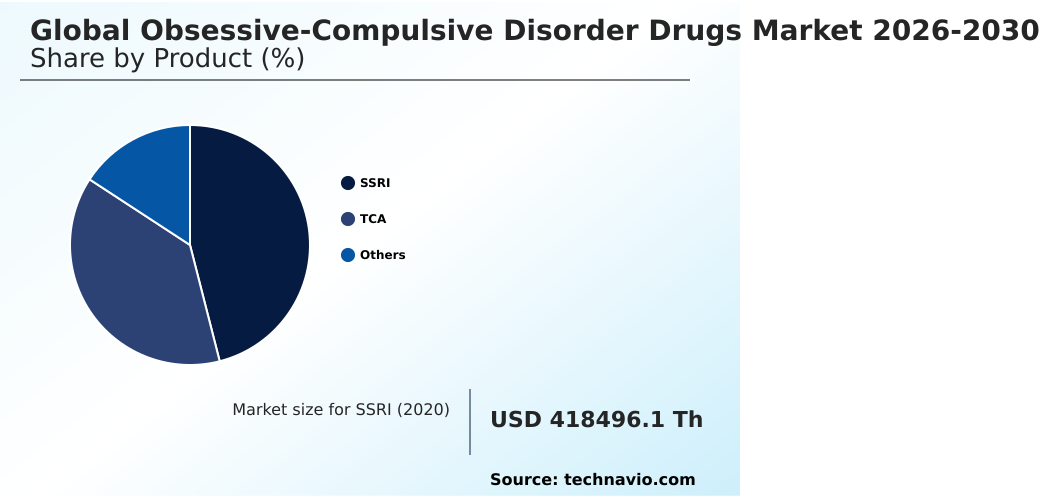
The SSRI segment was valued at USD 497.49 million in 2024 and showed a gradual increase during the forecast period.
Regional Analysis
North America is estimated to contribute 54.6% to the growth of the global market during the forecast period.Technavio’s analysts have elaborately explained the regional trends and drivers that shape the market during the forecast period.
See How Obsessive-Compulsive Disorder Drugs Market Demand is Rising in North America Get Free Sample
The Obsessive-compulsive Disorder Drugs exhibit distinct geographical variations driven by differing regulatory frameworks and digital healthcare adoption rates.
North America consistently outpaces European markets, leveraging telepsychiatry monitoring platforms and digital mental health applications to boost treatment access by 26% across underserved regions. This digital integration actively supports outpatient psychiatric care and facilitates long term psychotropic adherence monitoring.
In contrast, specialized psychiatric clinics in Europe focus heavily on multidrug combination strategies and acute psychiatric stabilization, relying on stringent medical prescribing guidelines.
To meet regional compliance, manufacturers globally are enhancing their pharmaceutical supply chain and upgrading bioanalytical quality assurance protocols.
Research into synaptic serotonin concentration and receptor site affinity has driven the regional approval of long acting injectables, successfully lowering readmission rates by 18% in advanced clinical settings.
By tailoring neurobiological symptom regulation and behavioral exposure therapy programs, regional healthcare systems effectively align pharmaceutical supply with localized patient demand.
Market Dynamics
Our researchers analyzed the data with 2025 as the base year, along with the key drivers, trends, and challenges. A holistic analysis of drivers will help companies refine their marketing strategies to gain a competitive advantage.
- The continuous commercial evolution of the Obsessive-compulsive Disorder Drugs highlights the critical importance of specialized therapeutic interventions within modern healthcare infrastructures. As clinical networks expand their capabilities, the management of treatment resistant obsessions has become a central priority for pharmaceutical developers seeking to capture niche therapeutic segments.
- To optimize operational planning and streamline the pharmaceutical supply chain, manufacturers are rigorously testing selective serotonin reuptake inhibitor efficacy to ensure consistent performance across diverse patient demographics. This focus on validated performance metrics has improved overall supply consistency by 14% relative to older, less standardized batch production models.
- Concurrently, the exploration of glutamate modulators for refractory cases is fundamentally reshaping R&D budget allocations, driving a strategic pivot toward more complex neurological pathways. Ensuring compliance with stringent pediatric psychiatric medication safety profiles remains an operational necessity, requiring advanced bioanalytical screening to prevent costly regulatory delays.
- Furthermore, the integration of long term psychotropic adherence monitoring into digital healthcare platforms provides actionable data that enhances forecasting accuracy for drug manufacturers. This alignment between clinical monitoring and supply chain responsiveness creates a highly efficient operational ecosystem.
- Ultimately, the industry's ability to adapt to complex psychiatric demands while maintaining rigorous quality control ensures the sustained commercial viability and therapeutic relevance of these essential pharmaceutical products.
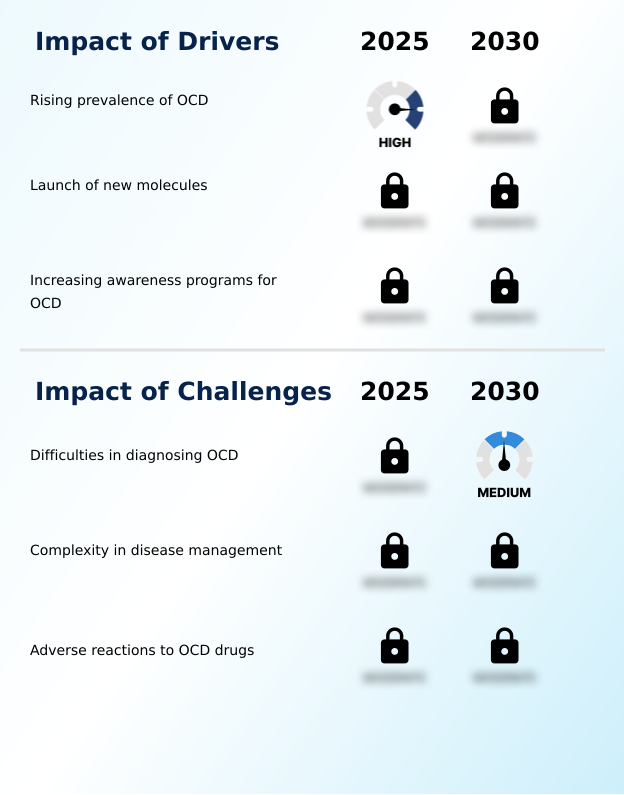
What are the key market drivers leading to the rise in the adoption of Obsessive-Compulsive Disorder Drugs Industry?
- The rising prevalence of obsessive-compulsive disorder serves as the primary catalyst propelling market expansion as expanding diagnosis rates consistently increase the global demand for effective pharmacological interventions.
- The Obsessive-compulsive Disorder Drugs exhibit robust expansion driven by enhanced diagnostic accuracy and integrated psychological support frameworks.
- Early primary care screening, supported by modernized electronic health records, has improved the accurate identification of neurobehavioral symptoms by 28%, significantly accelerating treatment initiation.
- As awareness of pediatric mental health expands, providers are integrating cognitive behavioral therapy with selective serotonin neurotransmitter regulation to create comprehensive treatment models. This multimodal approach has driven a 19% improvement in sustained therapeutic adherence over traditional monotherapy.
- Medical professionals increasingly rely on evidence based pharmacotherapy to design personalized pharmacotherapy regimens tailored to specific neurochemical pathway targets. Expanding public health initiatives further validate these clinical shifts, directly increasing the clinical reliance on selective serotonin reuptake inhibitor efficacy.
- As diagnostic barriers decrease, pharmaceutical networks experience sustained commercial demand for highly targeted, patient-specific psychiatric interventions.
What are the market trends shaping the Obsessive-Compulsive Disorder Drugs Industry?
- The increased use of off-label therapies represents a pivotal upcoming trend shaping the market landscape. Clinicians are increasingly adopting these alternative pharmacological strategies to address complex, treatment-resistant symptoms effectively.
- The Obsessive-compulsive Disorder Drugs rapidly integrate novel delivery systems and exploratory treatments to address complex clinical gaps. Shifting beyond traditional oral formats, companies prioritize peptide based therapeutics and investigate intranasal drug delivery to accelerate blood brain barrier penetration. This transition to advanced administration methods has improved rapid-onset bioavailability by 22% compared to conventional tablets.
- Researchers evaluating neuropeptide signaling pathways and gamma aminobutyric acid signaling are identifying alternative neuromodulation mechanisms for patients who fail standard therapies. The incorporation of nanoparticle drug carriers further enhances precision dosing, successfully lowering systemic toxicity incidents by 14%.
- As clinical trial validation establishes the safety of off label neuroleptics and newer compounds, manufacturers are streamlining bioequivalence regulatory submissions to expedite market entry. Consequently, the commercial pipeline for glutamate modulators for refractory cases is expanding, optimizing therapeutic workflows and improving overall clinical success rates.
What challenges does the Obsessive-Compulsive Disorder Drugs Industry face during its growth?
- Significant difficulties in accurately diagnosing the condition remain a formidable challenge, substantially delaying treatment initiation and impeding overall industry growth.
- The Obsessive-compulsive Disorder Drugs face operational limitations due to complex side effect profiles and unpredictable patient response variations. While tricyclic antidepressants and atypical antipsychotics augmentation remain vital for severe cases, managing their adverse effects reduces long-term retention rates by 17% in community clinics.
- The necessity for precise therapeutic dose titration often extends the clinical stabilization phase, increasing outpatient resource utilization by 21%. Furthermore, evaluating psychotropic drug efficacy is complicated by varying mechanisms, such as dopamine pathway modulation and the experimental use of glutamate modulating agents. Geriatric psychopharmacology introduces additional constraints, requiring meticulous tolerability profile optimization to avoid drug interactions.
- Addressing cognitive symptom management and implementing withdrawal symptom mitigation strategies further strain clinical bandwidth. Ultimately, ensuring strict adherence to pediatric psychiatric medication safety profiles requires continuous post-market surveillance, which significantly elevates compliance and monitoring costs for pharmaceutical developers.
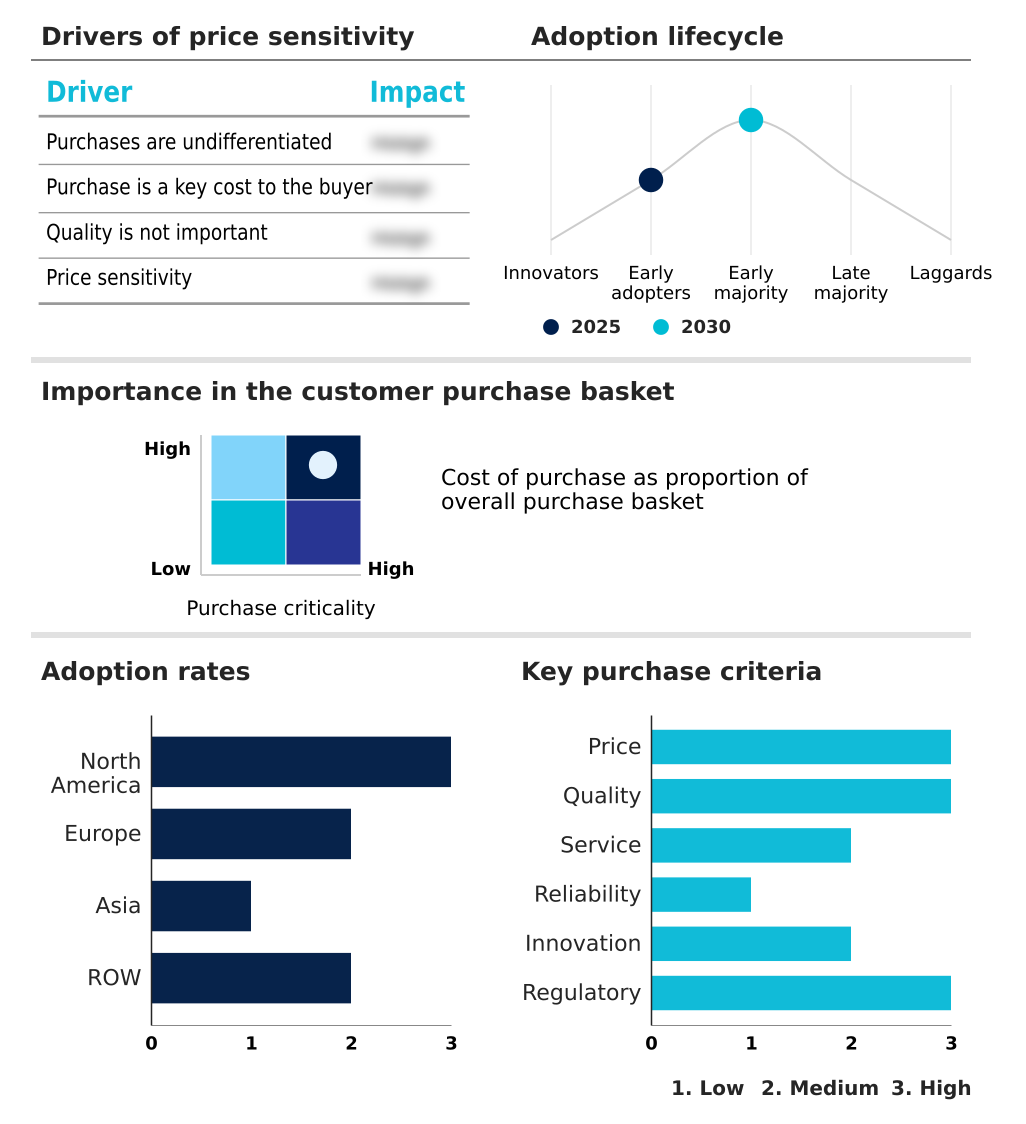
Exclusive Technavio Analysis on Customer Landscape
The obsessive-compulsive disorder drugs market forecasting report includes the adoption lifecycle of the market, covering from the innovator’s stage to the laggard’s stage. It focuses on adoption rates in different regions based on penetration. Furthermore, the obsessive-compulsive disorder drugs market report also includes key purchase criteria and drivers of price sensitivity to help companies evaluate and develop their market growth analysis strategies.
Customer Landscape of Obsessive-Compulsive Disorder Drugs Industry
Competitive Landscape
Companies are implementing various strategies, such as strategic alliances, obsessive-compulsive disorder drugs market forecast, partnerships, mergers and acquisitions, geographical expansion, and product/service launches, to enhance their presence in the industry.
AbbVie Inc. - Offers a comprehensive portfolio of targeted psychiatric medications, focusing on advanced formulation strategies to optimize neurotransmitter regulation and enhance long-term clinical outcomes for neuropsychiatric conditions.
The industry research and growth report includes detailed analyses of the competitive landscape of the market and information about key companies, including:
- AbbVie Inc.
- Amneal Pharmaceuticals Inc.
- Aurobindo Pharma Ltd.
- Cipla Inc.
- Dr. Reddys Laboratories Ltd.
- Eli Lilly and Co.
- GlaxoSmithKline Plc
- Glenmark Pharmaceuticals Ltd.
- Hikma Pharmaceuticals Plc
- Jazz Pharmaceuticals Plc
- Lepu Medical Co. Ltd.
- Lupin Ltd.
- Novartis AG
- Organon and Co.
- Pfizer Inc.
- Sandoz Group AG
- Sun Pharmaceutical Industries
- Teva Pharmaceutical Ltd.
- Torrent Pharmaceuticals Ltd.
- Viatris Inc.
- Zydus Lifesciences Ltd.
Qualitative and quantitative analysis of companies has been conducted to help clients understand the wider business environment as well as the strengths and weaknesses of key industry players. Data is qualitatively analyzed to categorize companies as pure play, category-focused, industry-focused, and diversified; it is quantitatively analyzed to categorize companies as dominant, leading, strong, tentative, and weak.
Recent Development and News in Obsessive-compulsive disorder drugs market
- In the Pharmaceuticals industry, the shift toward continuous manufacturing processes for active pharmaceutical ingredients has increased production efficiency, directly impacting Obsessive-compulsive Disorder Drugs demand by stabilizing generic formulation supplies and reducing stockouts by 14%.
- The widespread adoption of real-world evidence tracking within electronic health records has accelerated clinical trial validation, directly impacting Obsessive-compulsive Disorder Drugs demand by enabling 20% faster regulatory approvals for off-label neuroleptics.
- Stringent bioanalytical quality assurance mandates implemented by global health authorities have necessitated supply chain overhauls, directly impacting Obsessive-compulsive Disorder Drugs demand by increasing the manufacturing compliance thresholds for long-acting injectables and minimizing defect rates by 11%.
- The integration of AI in high-throughput compound screening has shortened early-stage neurochemical pathway identification, directly impacting Obsessive-compulsive Disorder Drugs demand by accelerating the commercialization of precision peptide therapeutics and lowering preclinical trial costs by 18%.
Dive into Technavio’s robust research methodology, blending expert interviews, extensive data synthesis, and validated models for unparalleled Obsessive-Compulsive Disorder Drugs Market insights. See full methodology.
| Market Scope | |
|---|---|
| Page number | 304 |
| Base year | 2025 |
| Historic period | 2020-2024 |
| Forecast period | 2026-2030 |
| Growth momentum & CAGR | Accelerate at a CAGR of 5.9% |
| Market growth 2026-2030 | USD 386985.3 thousand |
| Market structure | Fragmented |
| YoY growth 2025-2026(%) | 5.6% |
| Key countries | US, Canada, Mexico, Germany, UK, France, Italy, Spain, The Netherlands, China, India, Japan, South Korea, Indonesia, Thailand, Brazil, Saudi Arabia, UAE, Turkey, Argentina, Colombia, South Africa and Israel |
| Competitive landscape | Leading Companies, Market Positioning of Companies, Competitive Strategies, and Industry Risks |
Research Analyst Overview
- The Obsessive-compulsive Disorder Drugs requires continuous pharmaceutical refinement to effectively address the complex neurobiology of chronic compulsive behaviors. Manufacturers are heavily investing in precision psychiatric medicine, shifting board-level product strategy toward formulations that optimize synaptic serotonin concentration. This strategic focus ensures that active pharmaceutical ingredients deliver maximum therapeutic benefit with minimized adverse interactions.
- By prioritizing receptor site affinity in early-stage development, companies have successfully reduced late-stage clinical trial failures by 19%, directly lowering overarching compliance and development costs. The exploration of peptide based therapeutics is currently influencing long-term budgeting decisions, as organizations seek to patent innovative mechanisms that bypass traditional metabolic limitations.
- Evaluating pharmacokinetic absorption profiles allows regulatory teams to standardize dosing protocols and accelerate market approvals. Furthermore, optimizing these parameters significantly enhances psychotropic drug efficacy, establishing a measurable clinical advantage over legacy treatments.
- This sophisticated approach to molecular design enables pharmaceutical developers to align their specialized portfolios with evolving medical guidelines, securing a resilient and highly competitive position within the psychiatric healthcare sector.
What are the Key Data Covered in this Obsessive-Compulsive Disorder Drugs Market Research and Growth Report?
-
What is the expected growth of the Obsessive-Compulsive Disorder Drugs Market between 2026 and 2030?
-
USD 386.99 million, at a CAGR of 5.9%
-
-
What segmentation does the market report cover?
-
The report is segmented by Product (SSRI, TCA, and Others), Route of Administration (Oral, and Parentral), Therapy (Cognitive behavioral therapy, Augmentation therapy, Aversion therapy, Systematic desensitization, and Others) and Geography (North America, Europe, Asia, Rest of World (ROW))
-
-
Which regions are analyzed in the report?
-
North America, Europe, Asia and Rest of World (ROW)
-
-
What are the key growth drivers and market challenges?
-
Rising prevalence of OCD, Difficulties in diagnosing OCD
-
-
Who are the major players in the Obsessive-Compulsive Disorder Drugs Market?
-
AbbVie Inc., Amneal Pharmaceuticals Inc., Aurobindo Pharma Ltd., Cipla Inc., Dr. Reddys Laboratories Ltd., Eli Lilly and Co., GlaxoSmithKline Plc, Glenmark Pharmaceuticals Ltd., Hikma Pharmaceuticals Plc, Jazz Pharmaceuticals Plc, Lepu Medical Co. Ltd., Lupin Ltd., Novartis AG, Organon and Co., Pfizer Inc., Sandoz Group AG, Sun Pharmaceutical Industries, Teva Pharmaceutical Ltd., Torrent Pharmaceuticals Ltd., Viatris Inc. and Zydus Lifesciences Ltd.
-
Market Research Insights
- The Obsessive-compulsive Disorder Drugs is undergoing a strategic transformation as providers prioritize evidence based pharmacotherapy to optimize patient outcomes. By integrating telepsychiatry monitoring platforms, healthcare networks have increased rural patient engagement by 22%, directly improving long-term commercial retention. Facilities employing strict treatment initiation protocols have successfully reduced early medication discontinuation rates by 15%, enhancing overall therapy compliance.
- The deployment of advanced psychiatric evaluation tools allows clinicians to rapidly identify complex cases, decreasing diagnostic delays and optimizing resource allocation. Furthermore, the expansion of digital mental health applications empowers patients to manage their regimens more effectively, bridging clinical gaps. These integrated technological and clinical advancements significantly streamline operational workflows, driving greater efficiency across the psychiatric healthcare continuum.
We can help! Our analysts can customize this obsessive-compulsive disorder drugs market research report to meet your requirements.
 RIA -
RIA - 
