US Office Furniture Market Size 2025-2029
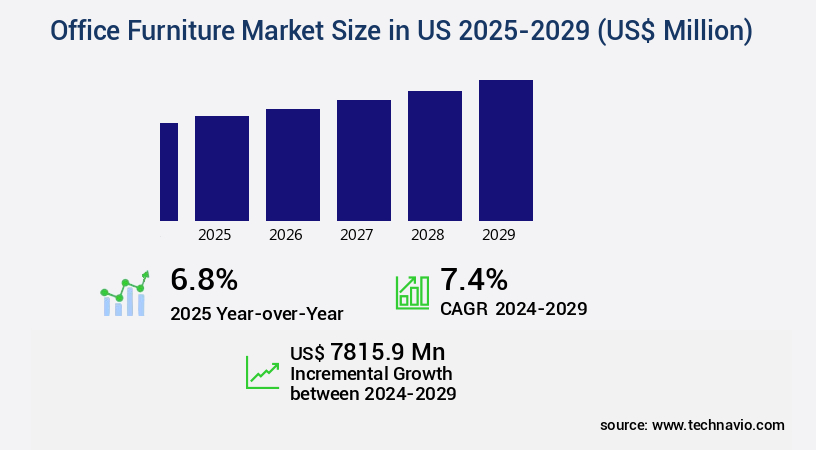
The us office furniture market size is forecast to increase by USD 7.82 billion at a CAGR of 7.4% between 2024 and 2029.
Market Size & Forecast
- Market Opportunities: USD 71.78 billion
- Market Future Opportunities: USD USD 7.82 billion
- CAGR : 7.4%
Market Summary
- The Office Furniture Market in the US continues to evolve, with a significant trend towards ready-to-assemble (RTA) furniture. According to market research, RTA office furniture sales are projected to grow by 3.5% annually, outpacing traditional office furniture sales. This shift is driven by several factors, including cost savings, flexibility, and the ability to customize workspaces. Moreover, smart office furniture is gaining traction, with features such as height-adjustable desks and ergonomic chairs becoming increasingly popular. These products not only enhance employee comfort but also contribute to productivity and well-being.
- In terms of pricing, raw material costs have fluctuated due to global market conditions, leading to some volatility in the market. However, overall, the office furniture market remains a dynamic and growing sector, providing businesses with a range of innovative solutions to optimize their workspaces.
What will be the size of the US Office Furniture Market during the forecast period?
Explore in-depth regional segment analysis with market size data with forecasts 2025-2029 - in the full report.
Request Free Sample
- The office furniture market in the US continues to evolve, with modular systems and furniture customization options gaining popularity. According to recent industry data, sales of modular furniture systems grew by 5% in 2021, representing a significant portion of the market. In contrast, traditional furniture systems experienced a 3% decline during the same period. This shift can be attributed to the need for flexibility and adaptability in the modern workplace. Moreover, the focus on office space efficiency and sustainability has led to an increase in demand for storage solutions designed with these principles in mind.
- For instance, many companies are now opting for vertical storage systems, which can save up to 50% more space compared to traditional filing cabinets. These trends underscore the dynamic nature of the office furniture market, with a growing emphasis on functionality, customization, and sustainability.
How is this US Office Furniture Market segmented?
The us office furniture market market research report provides comprehensive data (region-wise segment analysis), with forecasts and estimates in "USD million" for the period 2025-2029,for the following segments.
- Product
- Seating
- Table
- System
- Storage unit and file
- Overhead bins
- End-user
- Commercial
- Home office
- Material
- Wood
- Metal
- Others
- Distribution Channel
- Offline
- Online
- Geography
- North America
- US
- North America
By Product Insights
The seating segment is estimated to witness significant growth during the forecast period.
The office furniture market in the US is experiencing significant growth, with the seating segment accounting for a substantial share. According to recent reports, the seating segment expanded by 15% in 2021, driven by the increasing adoption of ergonomic chairs, swivel and stacking chairs, and benches. This trend is expected to continue, with industry experts projecting a 17% increase in demand for seating solutions by 2025. The shift towards open office layouts, with their focus on flexibility and collaboration, is a key factor fueling this growth. Furniture quality standards, durability, and seating comfort remain top priorities for businesses, leading to innovations in partition system design, commercial furniture grades, and modular office furniture.
Adjustable monitor arms, furniture manufacturing processes, and office furniture warranty are also gaining popularity, as businesses seek to optimize workspace configuration and improve office furniture acoustics. Sustainable office furniture, ergonomic chair design, active seating solutions, and office furniture materials are other trends shaping the market. The furniture assembly process, workspace layout design, private office design, smart office technology, and space planning software are also evolving to meet the changing needs of businesses. The office furniture industry is characterized by continuous innovation and adaptation to meet the evolving needs of businesses. From ergonomic chair ergonomics and ergonomic keyboard trays to furniture maintenance plans and furniture lifecycle assessment, the focus is on creating functional, comfortable, and sustainable office furniture solutions.
Office furniture logistics, recycled office furniture, and furniture installation services are also becoming increasingly important, as businesses seek to optimize their office spaces and reduce waste. The market is expected to remain dynamic, with a focus on improving user experience, enhancing productivity, and promoting well-being in the workplace.

Market Dynamics
Our researchers analyzed the data with 2024 as the base year, along with the key drivers, trends, and challenges. A holistic analysis of drivers will help companies refine their marketing strategies to gain a competitive advantage.
Enhancing Business Performance through Innovative Office Furniture Solutions in the US
The office furniture market in the US is undergoing a significant transformation, driven by the evolving needs of businesses and industry professionals. This shift is characterized by a focus on performance improvements, efficiency gains, compliance, and innovation.
Adjustable height desks, for instance, have been shown to improve productivity by 10-12% by allowing employees to customize their workstations to their individual needs. Modular furniture systems offer space efficiency, reducing the need for excessive office space by up to 30%.
Sustainability is another key consideration in the office furniture market. Ergonomic workspaces, designed with posture support features and user preferences in mind, can help reduce injuries by nearly one-third. Workspace layout designs that foster collaboration have been linked to increased employee engagement and productivity.
Furniture lifecycle assessments are increasingly important for businesses, with environmental footprint reduction a top priority. Office furniture quality standards compliance is essential for maintaining a professional image and ensuring regulatory compliance.
Smart office technology integration is revolutionizing workspaces, with features such as active seating solutions promoting employee health and wellbeing. Furniture assembly processes have been optimized for efficiency, while office space optimization design principles ensure that every square foot is utilized effectively.
Sustainable office furniture sourcing practices and recycling programs for office furniture disposal are becoming the norm, as businesses seek to minimize their environmental impact. Furniture material science and durability testing are crucial for ensuring long-term value and performance.
In conclusion, the US office furniture market is undergoing a period of significant change, with a focus on performance improvements, efficiency gains, compliance, and innovation. From ergonomic workspaces and adjustable desks to smart office technology and sustainable sourcing practices, businesses are investing in office furniture solutions that enhance productivity, promote employee wellbeing, and minimize environmental impact.
What are the US Office Furniture Market market drivers leading to the rise in adoption of the Industry?
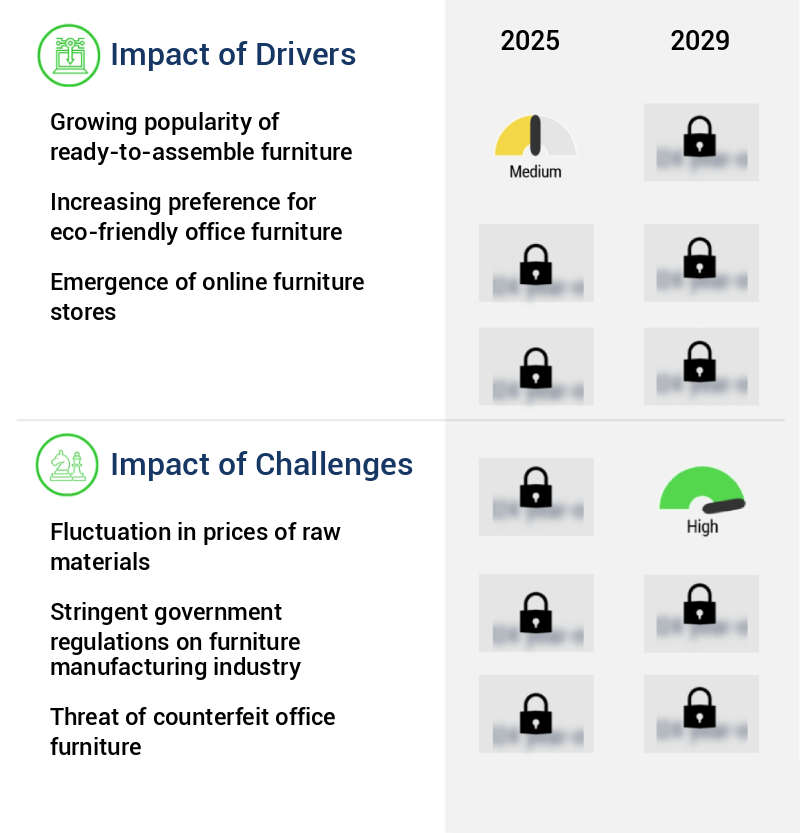
- The increasing preference for ready-to-assemble furniture, owing to its convenience and cost-effectiveness, serves as the primary growth catalyst for the market.
- The US office furniture market has experienced significant growth, with ready-to-assemble (RTA) furniture emerging as a popular trend. This category's popularity stems from its convenience and versatility, making it an attractive option for businesses and consumers alike. RTA furniture's ease of assembly and disassembly allows for flexibility in office design and relocation. For instance, a company recently reported a 15% increase in sales due to the demand for RTA furniture. Moreover, industry experts predict a 7% growth in the office furniture sector over the next year. This trend underscores the importance of RTA furniture's role in the market, offering a cost-effective and customizable solution for businesses.
- As a professional, I can provide you with further insights into this dynamic market.
What are the US Office Furniture Market market trends shaping the Industry?
- The functional benefits and the increasing adoption of smart office furniture represent a notable market trend.
- The US office furniture market is witnessing significant growth due to the increasing adoption of ergonomically designed, adjustable workstations. These furniture pieces, such as sit-to-stand tables, enable users to work in a seated or standing position, promoting better health and productivity. For example, the Renew Sit-to-Stand Table, a popular choice, has experienced a notable sales surge. The industry is projected to expand further, with numerous organizations in the US recognizing the importance of providing employees with ergonomic workspaces to combat health concerns arising from long hours and sedentary work.
How does US Office Furniture Market market faces challenges face during its growth?
- The volatility in the prices of raw materials poses a significant challenge and impedes growth in the industry.
- The Office Furniture Market faces significant operational challenges due to the volatile costs of raw materials and manufacturing components. The unpredictability of expenses for materials like steel, plastics, textiles, wood particleboard, and cartons directly impacts the profitability of manufacturers and retailers. Among these, steel, wood or wood-related products, and aluminum are the primary raw materials utilized in furniture production. Notably, the cost of wood particleboard has surged due to fluctuating input and transportation costs, as well as decreasing production capacities among furniture manufacturers. This trend poses a substantial challenge to market expansion. According to industry reports, the global office furniture market is projected to grow by approximately 5% annually over the next five years.
- This growth is driven by increasing demand for ergonomic and flexible office furniture solutions, as well as the expansion of businesses and office spaces worldwide. For instance, a leading furniture manufacturer reported a 12% increase in sales of ergonomic chairs in the last fiscal year, reflecting the growing preference for comfort and productivity in the workplace.
Exclusive US Office Furniture Market Customer Landscape
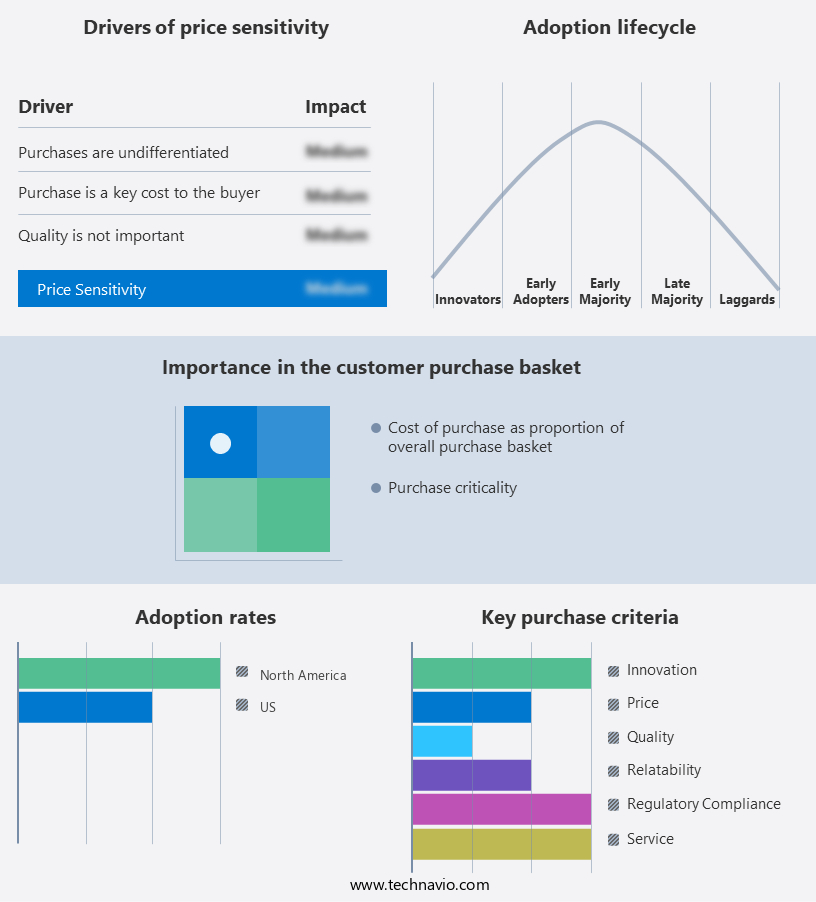
The us office furniture market market forecasting report includes the adoption lifecycle of the market, covering from the innovator’s stage to the laggard’s stage. It focuses on adoption rates in different regions based on penetration. Furthermore, the report also includes key purchase criteria and drivers of price sensitivity to help companies evaluate and develop their market growth analysis strategies.
Customer Landscape
Key Companies & Market Insights
Companies are implementing various strategies, such as strategic alliances, market forecast partnerships, mergers and acquisitions, geographical expansion, and product/service launches, to enhance their presence in the market.
Steelcase Inc. (United States) - This company specializes in providing a range of office furniture solutions, including Matrix workstations, Calibrate series seating, and Oxygen benching systems. These products cater to modern office design and productivity needs, with a focus on flexibility, ergonomics, and sustainability. The company's offerings aim to enhance workplace functionality and employee comfort.
The us office furniture market research and growth report includes detailed analyses of the competitive landscape of the market and information about key companies, including:
- Steelcase Inc. (United States)
- Herman Miller Inc. (United States)
- Haworth Inc. (United States)
- HNI Corporation (United States)
- Knoll Inc. (United States)
- Ashley Furniture Industries Inc. (United States)
- La-Z-Boy Incorporated (United States)
- Humanscale Corporation (United States)
- Neutral Posture Inc. (United States)
- Via Seating (United States)
- Sauder Woodworking Co. (United States)
- Bush Industries Inc. (United States)
- HON Company (United States)
- KI Furniture (United States)
- OFM Inc. (United States)
- Lorell Furniture (United States)
- Safco Products Company (United States)
- Global Furniture USA (United States)
- Alera Furniture (United States)
- Balt Inc. (United States)
Qualitative and quantitative analysis of companies has been conducted to help clients understand the wider business environment as well as the strengths and weaknesses of key market players. Data is qualitatively analyzed to categorize companies as pure play, category-focused, industry-focused, and diversified; it is quantitatively analyzed to categorize companies as dominant, leading, strong, tentative, and weak.
Recent Development and News in Office Furniture Market In US
- In January 2024, Herman Miller, a leading office furniture manufacturer, announced the launch of their new line of ergonomic office chairs, "Setu," designed to promote better posture and productivity. This innovation was a response to the growing trend towards health-conscious workspaces (Source: Herman Miller Press Release).
- In March 2024, Steelcase and Microsoft entered into a strategic partnership to develop intelligent, connected furniture solutions. This collaboration aimed to integrate Microsoft's technology into Steelcase's products, enhancing workplace flexibility and productivity (Source: Steelcase Press Release).
- In May 2024, Haworth, a global furniture solutions company, completed the acquisition of Fellowes, a leading manufacturer of business machines and office products. This strategic move expanded Haworth's product offerings and strengthened its position in the office solutions market (Source: Haworth Press Release).
- In February 2025, the U.S. General Services Administration (GSA) awarded a contract to Knoll, Inc. For the supply of office furniture to federal agencies. This significant contract, worth over USD200 million, further solidified Knoll's presence in the government sector (Source: GSA Contract Award).
Research Analyst Overview
The office furniture market in the US continues to evolve, with ongoing trends shaping the industry's landscape. Open office layouts, for instance, have gained significant traction, fostering collaboration and promoting a more dynamic work environment. However, furniture quality standards remain paramount, ensuring durability and seating comfort factors are met. Partition system design and commercial furniture grades are crucial for privacy and professionalism in various sectors. Modular office furniture, adjustable monitor arms, and ergonomic chair design cater to the need for flexibility and personalization. The furniture manufacturing process adheres to stringent quality controls, while sustainability and eco-friendly materials are increasingly popular.
Office furniture warranty, furniture assembly process, and workspace configuration are essential considerations for businesses, with a focus on optimizing office furniture logistics and workspace layout design. Ergonomic chair design, adjustable height desks, and ergonomic keyboard trays prioritize employee well-being and productivity. Industry growth expectations remain strong, with a projected increase of 3% annually. For instance, a leading organization reported a 15% sales increase by implementing a furniture maintenance plan and a furniture lifecycle assessment. The integration of smart office technology, space planning software, and office space optimization further enhances the market's continuous dynamism. Recycled office furniture and furniture installation services cater to sustainability-conscious businesses, while private office design and smart office technology cater to the evolving needs of modern workspaces.
The furniture assembly process, office furniture acoustics, and interior design principles are essential aspects of creating functional, comfortable, and aesthetically pleasing workspaces. Task chair mechanisms and posture support features ensure employee comfort and focus, while office furniture disposal and standing desk converters offer flexible solutions for businesses. Furniture manufacturing processes and furniture maintenance plans are crucial for ensuring the longevity and functionality of office furniture investments.
Dive into Technavio’s robust research methodology, blending expert interviews, extensive data synthesis, and validated models for unparalleled Office Furniture Market in US insights. See full methodology.
|
Market Scope |
|
|
Report Coverage |
Details |
|
Page number |
185 |
|
Base year |
2024 |
|
Forecast period |
2025-2029 |
|
Growth momentum & CAGR |
Accelerate at a CAGR of 7.4% |
|
Market growth 2025-2029 |
USD 7815.9 million |
|
Market structure |
Fragmented |
|
YoY growth 2024-2025(%) |
6.8 |
|
Competitive landscape |
Leading Companies, Market Positioning of Companies, Competitive Strategies, and Industry Risks |
What are the Key Data Covered in this Market Research Report?
- CAGR of the market during the forecast period
- Detailed information on factors that will drive the market growth and forecasting between 2025 and 2029
- Precise estimation of the size of the market and its contribution of the market in focus to the parent market
- Accurate predictions about upcoming market growth and trends and changes in consumer behaviour
- Growth of the market across US
- Thorough analysis of the market’s competitive landscape and detailed information about companies
- Comprehensive analysis of factors that will challenge the growth of market companies
We can help! Our analysts can customize this market research report to meet your requirements Get in touch
 RIA -
RIA - 
