Oil And Gas Downstream Market Size 2025-2029
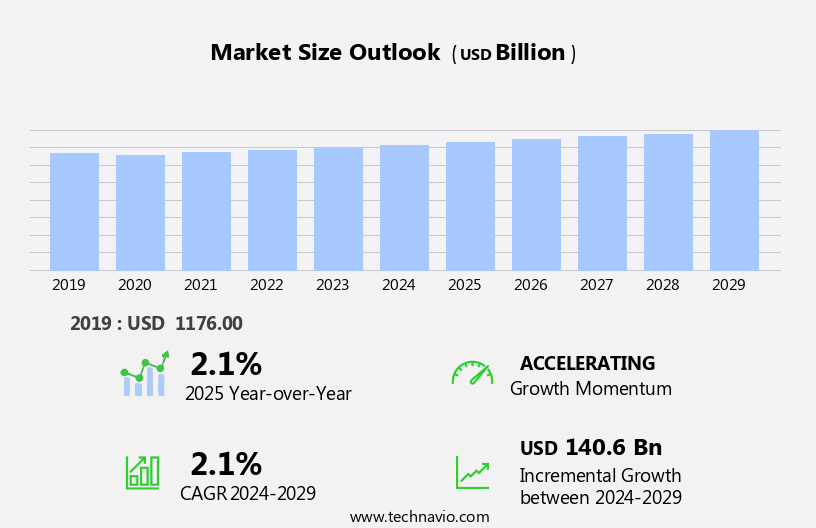
The oil and gas downstream market size is forecast to increase by USD 140.6 billion, at a CAGR of 2.1% between 2024 and 2029.
- The market is experiencing significant growth dynamics driven by the surging global energy demand and the increasing adoption of digitalization and automation in operations. The energy sector's relentless expansion is fueled by the continuous rise in energy consumption across various industries and population growth in developing economies. Simultaneously, the integration of digital technologies and automation in downstream processes is transforming the industry's landscape, enhancing operational efficiency and productivity. However, the market's growth trajectory is not without challenges. The uncertainties surrounding crude oil prices pose a considerable threat to market stability, as price volatility can significantly impact the profitability of downstream businesses.
- Producers and refiners must navigate these challenges by implementing robust pricing strategies and diversifying their product portfolios to mitigate the risks associated with price fluctuations. Additionally, the intensifying competition and the emergence of new technologies, such as renewable energy and electric vehicles, may disrupt traditional business models and require downstream players to adapt swiftly to remain competitive.
What will be the Size of the Oil And Gas Downstream Market during the forecast period?

Explore in-depth regional segment analysis with market size data - historical 2019-2023 and forecasts 2025-2029 - in the full report.
Request Free Sample
The downstream oil and gas market continues to evolve, shaped by various market dynamics and applications across diverse sectors. Fuel blending and infrastructure development are key areas of focus, with the circular economy gaining momentum as a sustainable solution for managing waste and reducing environmental impact. Price volatility persists, driving the need for market hedging and innovative strategies. Carbon capture and natural gas are increasingly important in the energy transition, while agricultural products offer potential as feedstocks for biofuels. Joint ventures and collaborations are shaping the industry, with artificial intelligence (AI) and data analytics driving process optimization and efficiency gains.
Crude oil remains a critical component, with demand forecasting and storage terminals playing essential roles in managing supply and demand. Blockchain technology is transforming the sector, enhancing transparency and security in transactions. Natural gas, ethylene glycol, and synthetic rubber are among the many applications in the downstream market. Tanker shipping and green technologies are advancing to reduce emissions, while retail fuel sales adapt to electric vehicles (EVs) and changing consumer preferences. Jet fuel, investment opportunities, emissions regulations, renewable fuels, government policies, wholesale fuel distribution, and supply chain management are all interconnected aspects of the downstream oil and gas market.
Capacity expansion and regulatory frameworks are ongoing priorities, as the industry continues to adapt and innovate.
How is this Oil And Gas Downstream Industry segmented?
The oil and gas downstream industry research report provides comprehensive data (region-wise segment analysis), with forecasts and estimates in "USD billion" for the period 2025-2029, as well as historical data from 2019-2023 for the following segments.
- Type
- Refineries
- Petrochemical plants
- Application
- Product
- Petroleum Products
- Chemical Products
- Fraction
- Light Distillates
- Middle Distillates
- Heavy Oils
- Distribution Channel
- Direct Sales
- Retail
- Online Platforms
- End-User
- Transportation
- Power Generation
- Manufacturing
- Geography
- North America
- Europe
- Middle East and Africa
- APAC
- China
- India
- Japan
- South Korea
- South America
- Rest of World (ROW)
.
By Type Insights
The refineries segment is estimated to witness significant growth during the forecast period.
The oil and gas downstream sector is characterized by refineries, which play a crucial role in transforming crude oil into various valuable products, including diesel, gasoline, LPG, jet fuel, and heating oil. Atmospheric distillation refineries, which use fractional distillation to separate crude oil into primary components, form the foundation of the downstream sector, supplying essential fuels for transportation, heating, and industry. Advanced complex or integrated refineries, however, go beyond basic distillation to optimize processes and maximize high-value product yields. Infrastructure development, including pipeline transportation and storage terminals, is essential for the efficient movement and storage of these products.
Price volatility and environmental impact are significant challenges for the sector. Market hedging and emissions regulations aim to mitigate these risks. Joint ventures and collaborations, such as those in artificial intelligence (AI) and data analytics, enable process optimization and demand forecasting. Natural gas, agricultural products, and renewable fuels are increasingly integrated into the sector, driven by government policies and energy transition trends. Carbon capture and circular economy principles are also gaining traction, as the industry seeks to reduce its environmental footprint. Trade agreements and supply chain management further influence market dynamics. Investment opportunities exist in various areas, including capacity expansion, retail fuel sales, and the development of green technologies.
Ethylene glycol, synthetic rubber, and petroleum coke are key product areas with significant potential. Tanker shipping, process optimization, and regulatory frameworks are other essential aspects of the downstream sector's evolving landscape. Electric vehicles and emissions regulations are driving the demand for alternative fuels and renewable energy sources. Overall, the oil and gas downstream sector continues to adapt to changing market conditions and consumer preferences, with a focus on efficiency, sustainability, and innovation.

Request Free Sample
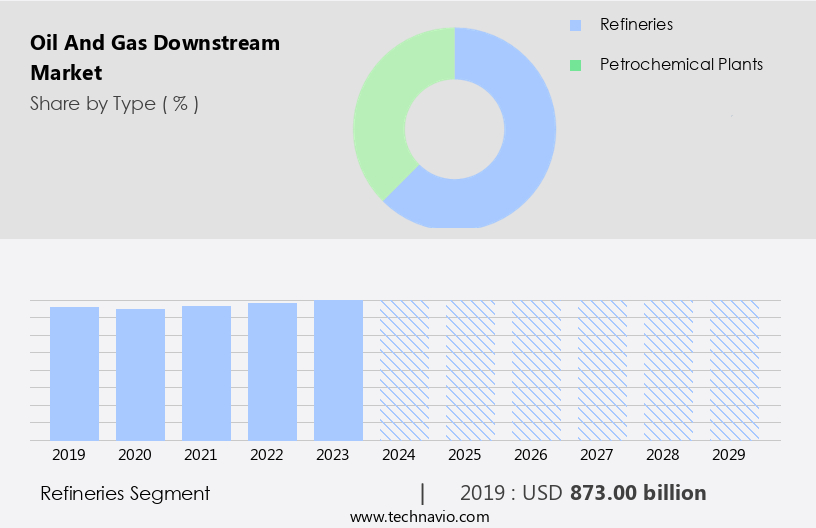
The Refineries segment was valued at USD 873.00 billion in 2019 and showed a gradual increase during the forecast period.
Regional Analysis
APAC is estimated to contribute 35% to the growth of the global market during the forecast period.Technavio’s analysts have elaborately explained the regional trends and drivers that shape the market during the forecast period.

Request Free Sample
The market is experiencing significant activity and evolving patterns, driven by various factors. Rising populations and economic growth, particularly in the Asia Pacific (APAC) region, are increasing energy demand, leading to investments in downstream exploration and production. The potential for discovering new hydrocarbon reserves, particularly offshore, attracts investments in advanced exploration and drilling equipment. The APAC region holds extensive offshore reserves, and technological advancements make it economically viable to tap into these reserves, thereby fueling demand for offshore equipment. Additionally, the integration of oil and gas downstream operations with renewable energy projects, such as offshore wind farms, is driving demand for equipment in the APAC region.
Price volatility and emissions regulations are key challenges in the market. To mitigate these risks, market participants are adopting strategies such as market hedging and carbon capture. The circular economy is gaining traction, with the reuse and recycling of petroleum coke and ethylene glycol becoming more common. Natural gas is also gaining popularity due to its lower carbon footprint, leading to investments in infrastructure development. Artificial intelligence (AI) and data analytics are transforming the industry, with applications in demand forecasting, process optimization, and supply chain management. Joint ventures and partnerships are also on the rise, enabling cost savings and sharing of resources.
The energy transition is influencing the market, with a shift towards synthetic rubber, electric vehicles (EVs), and renewable fuels. Government policies and trade agreements are shaping the regulatory frameworks, with a focus on fuel efficiency, capacity expansion, and emissions regulations. The downstream market is also embracing green technologies, such as biofuels and hydrogen, to reduce environmental impact. Pipeline transportation and tanker shipping remain crucial for the distribution of oil and gas products, with a growing emphasis on process optimization and capacity expansion. Investment opportunities exist in various segments of the downstream market, including retail fuel sales, jet fuel, and wholesale fuel distribution.
The market is also exploring the potential of blockchain technology for secure and transparent transactions. Overall, the market is dynamic and evolving, with a focus on innovation, sustainability, and cost efficiency.
Market Dynamics
Our researchers analyzed the data with 2024 as the base year, along with the key drivers, trends, and challenges. A holistic analysis of drivers will help companies refine their marketing strategies to gain a competitive advantage.
What are the key market drivers leading to the rise in the adoption of Oil And Gas Downstream Industry?
- The escalating global energy demand serves as the primary catalyst for market growth.
- The market experiences significant growth due to the increasing energy demand across various industries, transportation, and residential sectors. This demand necessitates substantial investments in infrastructure development, such as pipelines, refineries, and processing facilities. The downstream sector encompasses essential processes like fuel blending, which involves combining different components to create various fuel types for specific applications. Price volatility is a critical factor influencing market dynamics, necessitating the adoption of strategies like carbon capture and storage to mitigate risks and optimize operational efficiency. Furthermore, the circular economy concept gains traction in the oil and gas industry, with agricultural products and natural gas emerging as potential feedstocks for the production of biofuels and other petrochemicals.
- Joint ventures and collaborations between industry players and technology companies, such as those in artificial intelligence (AI), are transforming the downstream sector by enhancing operational efficiency, reducing costs, and improving product quality. Despite the challenges posed by price volatility and environmental concerns, the market continues to evolve, offering significant opportunities for growth and innovation.
What are the market trends shaping the Oil And Gas Downstream Industry?
- The increasing prevalence of digitalization and automation represents a significant market trend. This shift towards technology-driven solutions is becoming increasingly mandatory in various industries.
- The market is experiencing significant digital transformation, driven by the adoption of advanced sensor technology and automation. Real-time data collection from equipment and assets using IoT devices and sensors is becoming increasingly important for operators to monitor performance and condition remotely. This data is analyzed using data analytics and machine learning algorithms to predict equipment failures, optimize production processes, and schedule maintenance proactively. Automation also enables remote monitoring and control of drilling rigs, production facilities, and pipelines, reducing the need for on-site personnel and lowering operational costs while enhancing safety, particularly in challenging environments. Moreover, the energy transition towards renewable sources and the rise of electric vehicles (EVs) have led to a growing demand for synthetic rubber and ethylene glycol in various industries.
- Market hedging strategies are also being employed to mitigate price volatility in the crude oil market. Petroleum coke, a byproduct of oil refining, is finding new applications in the steel and cement industries, further expanding market opportunities. In conclusion, digitalization, automation, and data analytics are key drivers of growth and innovation in the market. These trends are transforming the industry by improving operational efficiency, enhancing safety, and creating new business opportunities.
What challenges does the Oil And Gas Downstream Industry face during its growth?
- The uncertainty surrounding crude oil price fluctuations poses a significant challenge to the growth of the industry.
- The downstream oil and gas market faces significant challenges due to fluctuating commodity prices and external factors like the COVID-19 pandemic. The financial pressure on oil and gas service companies has resulted in halted exploration and drilling initiatives. Pureplay downstream companies have been particularly affected, while integrated oil companies have managed to absorb some of the pressure due to their diverse revenue streams. Pipeline transportation, storage terminals, and tanker shipping have been crucial in maintaining the market's presence during these challenging times. Environmental impact and process optimization have gained increasing importance in the industry, with a focus on green technologies and retail fuel sales.
- Blockchain technology is also being explored to enhance transparency and efficiency in downstream operations. Demand forecasting and understanding market dynamics are essential for companies to navigate the complexities of the downstream oil and gas sector. The industry's future relies on its ability to adapt to changing market conditions and consumer preferences, while minimizing environmental impact and optimizing processes.
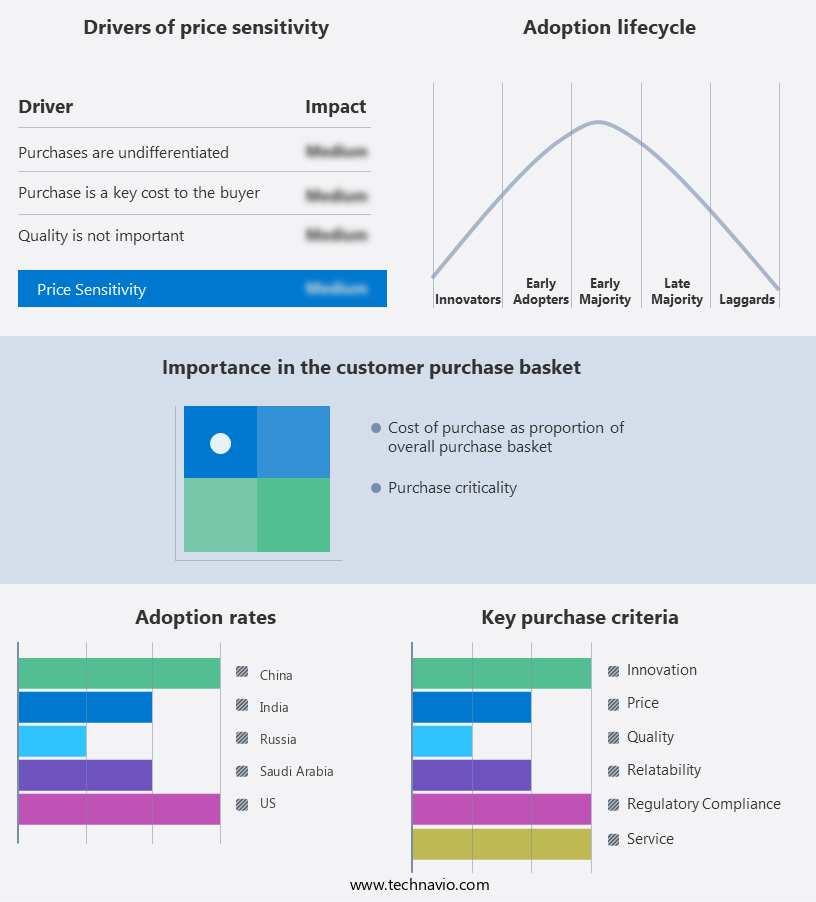
Exclusive Customer Landscape
The oil and gas downstream market forecasting report includes the adoption lifecycle of the market, covering from the innovator’s stage to the laggard’s stage. It focuses on adoption rates in different regions based on penetration. Furthermore, the oil and gas downstream market report also includes key purchase criteria and drivers of price sensitivity to help companies evaluate and develop their market growth analysis strategies.

Customer Landscape
Key Companies & Market Insights
Companies are implementing various strategies, such as strategic alliances, oil and gas downstream market forecast, partnerships, mergers and acquisitions, geographical expansion, and product/service launches, to enhance their presence in the industry.
Bharat Petroleum Corp. Ltd. - The company specializes in the production and distribution of a diverse range of downstream oil and gas products. These offerings encompass fuels, lubricants, and petrochemicals, catering to various industries and applications. By leveraging advanced technologies and a commitment to research and development, we deliver high-quality, innovative solutions that meet the evolving needs of our customers. Our extensive product portfolio is manufactured and supplied with a focus on sustainability, safety, and efficiency. Through strategic partnerships and collaborations, we strive to drive industry progress and contribute to a more sustainable future.
The industry research and growth report includes detailed analyses of the competitive landscape of the market and information about key companies, including:
- Bharat Petroleum Corp. Ltd.
- BP Plc
- Chevron Corp.
- China National Petroleum Corp.
- Emirates National Oil Co. Ltd. LLC.
- ENEOS Holdings Inc.
- Exxon Mobil Corp.
- Hindustan Petroleum Corp. Ltd.
- Indian Oil Corp. Ltd.
- Kuwait Petroleum Corp.
- Marathon Petroleum Corp.
- Nayara Energy Ltd.
- Phillips 66 Co.
- Reliance Industries Ltd.
- Rosneft Oil Co.
- Saudi Arabian Oil Co.
- Shell plc
- The Dow Chemical Co.
- TotalEnergies SE
- Valero Energy Corp.
Qualitative and quantitative analysis of companies has been conducted to help clients understand the wider business environment as well as the strengths and weaknesses of key industry players. Data is qualitatively analyzed to categorize companies as pure play, category-focused, industry-focused, and diversified; it is quantitatively analyzed to categorize companies as dominant, leading, strong, tentative, and weak.
Recent Development and News in Oil And Gas Downstream Market
- In February 2023, Shell and BP announced a strategic collaboration to build a hydrogen economy, aiming to produce and sell blue hydrogen by 2025. They plan to invest in infrastructure for hydrogen production, storage, and transportation, with an initial focus on Europe (Shell press release, 2023).
- In June 2024, ExxonMobil completed the acquisition of XTO Energy, a leading natural gas producer in the United States, for approximately USD50 billion. This acquisition expanded ExxonMobil's presence in the natural gas sector and increased its total proved reserves by 30% (ExxonMobil press release, 2024).
- In November 2024, the European Union (EU) passed the REPowerEU Plan, aiming to reduce the EU's dependence on Russian oil and gas by two-thirds by 2030. The plan includes investments in renewable energy, energy efficiency, and alternative fuels (EU Commission press release, 2024).
- In March 2025, Saudi Aramco and SABIC announced the successful demonstration of their joint project, the world's largest crude-to-chemicals complex, which converts crude oil into chemicals, reducing the need for natural gas feedstock (Saudi Aramco press release, 2025).
Research Analyst Overview
- In the dynamic downstream oil and gas market, clean energy transition and sustainability are shaping the industry's future. Risk management strategies are crucial as carbon sequestration and environmental remediation become increasingly important. Energy storage and downstream processing technologies are advancing, leading to energy efficiency standards and product differentiation. Sustainability reporting and community engagement are key components of corporate social responsibility. Production technologies, including bio-based plastics and fuel additives, offer innovative solutions.
- Data-driven decisions and alternative feedstocks are revolutionizing refining capacity and process safety. Petrochemical production is evolving with fuel cells and smart grid integration. Labor relations and offshore drilling remain critical issues, while the industry navigates the complexities of the transition towards a more sustainable future.
Dive into Technavio’s robust research methodology, blending expert interviews, extensive data synthesis, and validated models for unparalleled Oil And Gas Downstream Market insights. See full methodology.
Market Scope
|
Report Coverage
|
Details
|
Page number
|
188
|
Base year
|
2024
|
Historic period
|
2019-2023 |
Forecast period
|
2025-2029
|
Growth momentum & CAGR
|
Accelerate at a CAGR of 2.1%
|
Market growth 2025-2029
|
USD 140.6 billion
|
Market structure
|
Fragmented
|
YoY growth 2024-2025(%)
|
2.1
|
Key countries
|
US, China, Japan, Canada, India, Saudi Arabia, South Korea, Brazil, UAE, and Germany
|
Competitive landscape
|
Leading Companies, Market Positioning of Companies, Competitive Strategies, and Industry Risks
|
Request Free Sample
What are the Key Data Covered in this Oil And Gas Downstream Market Research and Growth Report?
- CAGR of the Oil And Gas Downstream industry during the forecast period
- Detailed information on factors that will drive the growth and forecasting between 2025 and 2029
- Precise estimation of the size of the market and its contribution of the industry in focus to the parent market
- Accurate predictions about upcoming growth and trends and changes in consumer behaviour
- Growth of the market across APAC, North America, Middle East and Africa, Europe, and South America
- Thorough analysis of the market’s competitive landscape and detailed information about companies
- Comprehensive analysis of factors that will challenge the oil and gas downstream market growth of industry companies
We can help! Our analysts can customize this oil and gas downstream market research report to meet your requirements.
Get in touch
1 Executive Summary
- 1.1 Market overview
- Executive Summary - Chart on Market Overview
- Executive Summary - Data Table on Market Overview
- Executive Summary - Chart on Global Market Characteristics
- Executive Summary - Chart on Market by Geography
- Executive Summary - Chart on Market Segmentation by Type
- Executive Summary - Chart on Market Segmentation by Application
- Executive Summary - Chart on Incremental Growth
- Executive Summary - Data Table on Incremental Growth
- Executive Summary - Chart on Company Market Positioning
2 Technavio Analysis
- 2.1 Analysis of price sensitivity, lifecycle, customer purchase basket, adoption rates, and purchase criteria
- Analysis of price sensitivity, lifecycle, customer purchase basket, adoption rates, and purchase criteria
- 2.2 Criticality of inputs and Factors of differentiation
- Overview on criticality of inputs and factors of differentiation
- 2.3 Factors of disruption
- Overview on factors of disruption
- 2.4 Impact of drivers and challenges
- Impact of drivers and challenges in 2024 and 2029
3 Market Landscape
- 3.1 Market ecosystem
- Parent Market
- Data Table on - Parent Market
- 3.2 Market characteristics
- Market characteristics analysis
4 Market Sizing
- 4.1 Market definition
- Offerings of companies included in the market definition
- 4.2 Market segment analysis
- 4.4 Market outlook: Forecast for 2024-2029
- Chart on Global - Market size and forecast 2024-2029 ($ billion)
- Data Table on Global - Market size and forecast 2024-2029 ($ billion)
- Chart on Global Market: Year-over-year growth 2024-2029 (%)
- Data Table on Global Market: Year-over-year growth 2024-2029 (%)
5 Historic Market Size
- 5.1 Global Oil And Gas Downstream Market 2019 - 2023
- Historic Market Size - Data Table on Global Oil And Gas Downstream Market 2019 - 2023 ($ billion)
- 5.2 Type segment analysis 2019 - 2023
- Historic Market Size - Type Segment 2019 - 2023 ($ billion)
- 5.3 Application segment analysis 2019 - 2023
- Historic Market Size - Application Segment 2019 - 2023 ($ billion)
- 5.4 Geography segment analysis 2019 - 2023
- Historic Market Size - Geography Segment 2019 - 2023 ($ billion)
- 5.5 Country segment analysis 2019 - 2023
- Historic Market Size - Country Segment 2019 - 2023 ($ billion)
6 Qualitative Analysis
- 6.1 Impact of AI on the Global Oil and Gas Downstream Market
7 Five Forces Analysis
- 7.1 Five forces summary
- Five forces analysis - Comparison between 2024 and 2029
- 7.2 Bargaining power of buyers
- Bargaining power of buyers - Impact of key factors 2024 and 2029
- 7.3 Bargaining power of suppliers
- Bargaining power of suppliers - Impact of key factors in 2024 and 2029
- 7.4 Threat of new entrants
- Threat of new entrants - Impact of key factors in 2024 and 2029
- 7.5 Threat of substitutes
- Threat of substitutes - Impact of key factors in 2024 and 2029
- 7.6 Threat of rivalry
- Threat of rivalry - Impact of key factors in 2024 and 2029
- 7.7 Market condition
- Chart on Market condition - Five forces 2024 and 2029
8 Market Segmentation by Type
- 8.1 Market segments
- Chart on Type - Market share (2024-2029) (%)
- Data Table on Type - Market share (2024-2029) (%)
- 8.2 Comparison by Type
- Chart on Comparison by Type
- Data Table on Comparison by Type
- 8.3 Refineries - Market size and forecast (2024-2029)
- Chart on Refineries - Market size and forecast (2024-2029) ($ billion)
- Data Table on Refineries - Market size and forecast (2024-2029) ($ billion)
- Chart on Refineries - Year-over-year growth (2024-2029) (%)
- Data Table on Refineries - Year-over-year growth (2024-2029) (%)
- 8.4 Petrochemical plants - Market size and forecast (2024-2029)
- Chart on Petrochemical plants - Market size and forecast (2024-2029) ($ billion)
- Data Table on Petrochemical plants - Market size and forecast (2024-2029) ($ billion)
- Chart on Petrochemical plants - Year-over-year growth (2024-2029) (%)
- Data Table on Petrochemical plants - Year-over-year growth (2024-2029) (%)
- 8.5 Market opportunity by Type
- Market opportunity by Type ($ billion)
- Data Table on Market opportunity by Type ($ billion)
9 Market Segmentation by Application
- 9.1 Market segments
- Chart on Application - Market share (2024-2029) (%)
- Data Table on Application - Market share (2024-2029) (%)
- 9.2 Comparison by Application
- Chart on Comparison by Application
- Data Table on Comparison by Application
- 9.3 Domestic - Market size and forecast (2024-2029)
- Chart on Domestic - Market size and forecast (2024-2029) ($ billion)
- Data Table on Domestic - Market size and forecast (2024-2029) ($ billion)
- Chart on Domestic - Year-over-year growth (2024-2029) (%)
- Data Table on Domestic - Year-over-year growth (2024-2029) (%)
- 9.4 International - Market size and forecast (2024-2029)
- Chart on International - Market size and forecast (2024-2029) ($ billion)
- Data Table on International - Market size and forecast (2024-2029) ($ billion)
- Chart on International - Year-over-year growth (2024-2029) (%)
- Data Table on International - Year-over-year growth (2024-2029) (%)
- 9.5 Market opportunity by Application
- Market opportunity by Application ($ billion)
- Data Table on Market opportunity by Application ($ billion)
10 Market Segmentation by Product
- 10.1 Market segments
- Chart on Product - Market share (2024-2029) (%)
- Data Table on Product - Market share (2024-2029) (%)
- 10.2 Comparison by Product
- Chart on Comparison by Product
- Data Table on Comparison by Product
- 10.3 Petroleum Products - Market size and forecast (2024-2029)
- Chart on Petroleum Products - Market size and forecast (2024-2029) ($ billion)
- Data Table on Petroleum Products - Market size and forecast (2024-2029) ($ billion)
- Chart on Petroleum Products - Year-over-year growth (2024-2029) (%)
- Data Table on Petroleum Products - Year-over-year growth (2024-2029) (%)
- 10.4 Chemical Products - Market size and forecast (2024-2029)
- Chart on Chemical Products - Market size and forecast (2024-2029) ($ billion)
- Data Table on Chemical Products - Market size and forecast (2024-2029) ($ billion)
- Chart on Chemical Products - Year-over-year growth (2024-2029) (%)
- Data Table on Chemical Products - Year-over-year growth (2024-2029) (%)
- 10.5 Market opportunity by Product
- Market opportunity by Product ($ billion)
- Data Table on Market opportunity by Product ($ billion)
11 Market Segmentation by Fraction
- 11.1 Market segments
- Chart on Fraction - Market share (2024-2029) (%)
- Data Table on Fraction - Market share (2024-2029) (%)
- 11.2 Comparison by Fraction
- Chart on Comparison by Fraction
- Data Table on Comparison by Fraction
- 11.3 Light Distillates - Market size and forecast (2024-2029)
- Chart on Light Distillates - Market size and forecast (2024-2029) ($ billion)
- Data Table on Light Distillates - Market size and forecast (2024-2029) ($ billion)
- Chart on Light Distillates - Year-over-year growth (2024-2029) (%)
- Data Table on Light Distillates - Year-over-year growth (2024-2029) (%)
- 11.4 Middle Distillates - Market size and forecast (2024-2029)
- Chart on Middle Distillates - Market size and forecast (2024-2029) ($ billion)
- Data Table on Middle Distillates - Market size and forecast (2024-2029) ($ billion)
- Chart on Middle Distillates - Year-over-year growth (2024-2029) (%)
- Data Table on Middle Distillates - Year-over-year growth (2024-2029) (%)
- 11.5 Heavy Oils - Market size and forecast (2024-2029)
- Chart on Heavy Oils - Market size and forecast (2024-2029) ($ billion)
- Data Table on Heavy Oils - Market size and forecast (2024-2029) ($ billion)
- Chart on Heavy Oils - Year-over-year growth (2024-2029) (%)
- Data Table on Heavy Oils - Year-over-year growth (2024-2029) (%)
- 11.6 Market opportunity by Fraction
- Market opportunity by Fraction ($ billion)
- Data Table on Market opportunity by Fraction ($ billion)
12 Market Segmentation by Distribution Channel
- 12.1 Market segments
- Chart on Distribution Channel - Market share (2024-2029) (%)
- Data Table on Distribution Channel - Market share (2024-2029) (%)
- 12.2 Comparison by Distribution Channel
- Chart on Comparison by Distribution Channel
- Data Table on Comparison by Distribution Channel
- 12.3 Direct Sales - Market size and forecast (2024-2029)
- Chart on Direct Sales - Market size and forecast (2024-2029) ($ billion)
- Data Table on Direct Sales - Market size and forecast (2024-2029) ($ billion)
- Chart on Direct Sales - Year-over-year growth (2024-2029) (%)
- Data Table on Direct Sales - Year-over-year growth (2024-2029) (%)
- 12.4 Retail - Market size and forecast (2024-2029)
- Chart on Retail - Market size and forecast (2024-2029) ($ billion)
- Data Table on Retail - Market size and forecast (2024-2029) ($ billion)
- Chart on Retail - Year-over-year growth (2024-2029) (%)
- Data Table on Retail - Year-over-year growth (2024-2029) (%)
- 12.5 Online Platforms - Market size and forecast (2024-2029)
- Chart on Online Platforms - Market size and forecast (2024-2029) ($ billion)
- Data Table on Online Platforms - Market size and forecast (2024-2029) ($ billion)
- Chart on Online Platforms - Year-over-year growth (2024-2029) (%)
- Data Table on Online Platforms - Year-over-year growth (2024-2029) (%)
- 12.6 Market opportunity by Distribution Channel
- Market opportunity by Distribution Channel ($ billion)
- Data Table on Market opportunity by Distribution Channel ($ billion)
13 Market Segmentation by End-User
- 13.1 Market segments
- Chart on End-User - Market share (2024-2029) (%)
- Data Table on End-User - Market share (2024-2029) (%)
- 13.2 Comparison by End-User
- Chart on Comparison by End-User
- Data Table on Comparison by End-User
- 13.3 Transportation - Market size and forecast (2024-2029)
- Chart on Transportation - Market size and forecast (2024-2029) ($ billion)
- Data Table on Transportation - Market size and forecast (2024-2029) ($ billion)
- Chart on Transportation - Year-over-year growth (2024-2029) (%)
- Data Table on Transportation - Year-over-year growth (2024-2029) (%)
- 13.4 Power Generation - Market size and forecast (2024-2029)
- Chart on Power Generation - Market size and forecast (2024-2029) ($ billion)
- Data Table on Power Generation - Market size and forecast (2024-2029) ($ billion)
- Chart on Power Generation - Year-over-year growth (2024-2029) (%)
- Data Table on Power Generation - Year-over-year growth (2024-2029) (%)
- 13.5 Manufacturing - Market size and forecast (2024-2029)
- Chart on Manufacturing - Market size and forecast (2024-2029) ($ billion)
- Data Table on Manufacturing - Market size and forecast (2024-2029) ($ billion)
- Chart on Manufacturing - Year-over-year growth (2024-2029) (%)
- Data Table on Manufacturing - Year-over-year growth (2024-2029) (%)
- 13.6 Market opportunity by End-User
- Market opportunity by End-User ($ billion)
- Data Table on Market opportunity by End-User ($ billion)
14 Customer Landscape
- 14.1 Customer landscape overview
- Analysis of price sensitivity, lifecycle, customer purchase basket, adoption rates, and purchase criteria
15 Geographic Landscape
- 15.1 Geographic segmentation
- Chart on Market share by geography 2024-2029 (%)
- Data Table on Market share by geography 2024-2029 (%)
- 15.2 Geographic comparison
- Chart on Geographic comparison
- Data Table on Geographic comparison
- 15.3 APAC - Market size and forecast 2024-2029
- Chart on APAC - Market size and forecast 2024-2029 ($ billion)
- Data Table on APAC - Market size and forecast 2024-2029 ($ billion)
- Chart on APAC - Year-over-year growth 2024-2029 (%)
- Data Table on APAC - Year-over-year growth 2024-2029 (%)
- 15.4 North America - Market size and forecast 2024-2029
- Chart on North America - Market size and forecast 2024-2029 ($ billion)
- Data Table on North America - Market size and forecast 2024-2029 ($ billion)
- Chart on North America - Year-over-year growth 2024-2029 (%)
- Data Table on North America - Year-over-year growth 2024-2029 (%)
- 15.5 Middle East and Africa - Market size and forecast 2024-2029
- Chart on Middle East and Africa - Market size and forecast 2024-2029 ($ billion)
- Data Table on Middle East and Africa - Market size and forecast 2024-2029 ($ billion)
- Chart on Middle East and Africa - Year-over-year growth 2024-2029 (%)
- Data Table on Middle East and Africa - Year-over-year growth 2024-2029 (%)
- 15.6 Europe - Market size and forecast 2024-2029
- Chart on Europe - Market size and forecast 2024-2029 ($ billion)
- Data Table on Europe - Market size and forecast 2024-2029 ($ billion)
- Chart on Europe - Year-over-year growth 2024-2029 (%)
- Data Table on Europe - Year-over-year growth 2024-2029 (%)
- 15.7 South America - Market size and forecast 2024-2029
- Chart on South America - Market size and forecast 2024-2029 ($ billion)
- Data Table on South America - Market size and forecast 2024-2029 ($ billion)
- Chart on South America - Year-over-year growth 2024-2029 (%)
- Data Table on South America - Year-over-year growth 2024-2029 (%)
- 15.8 US - Market size and forecast 2024-2029
- Chart on US - Market size and forecast 2024-2029 ($ billion)
- Data Table on US - Market size and forecast 2024-2029 ($ billion)
- Chart on US - Year-over-year growth 2024-2029 (%)
- Data Table on US - Year-over-year growth 2024-2029 (%)
- 15.9 China - Market size and forecast 2024-2029
- Chart on China - Market size and forecast 2024-2029 ($ billion)
- Data Table on China - Market size and forecast 2024-2029 ($ billion)
- Chart on China - Year-over-year growth 2024-2029 (%)
- Data Table on China - Year-over-year growth 2024-2029 (%)
- 15.10 Japan - Market size and forecast 2024-2029
- Chart on Japan - Market size and forecast 2024-2029 ($ billion)
- Data Table on Japan - Market size and forecast 2024-2029 ($ billion)
- Chart on Japan - Year-over-year growth 2024-2029 (%)
- Data Table on Japan - Year-over-year growth 2024-2029 (%)
- 15.11 Canada - Market size and forecast 2024-2029
- Chart on Canada - Market size and forecast 2024-2029 ($ billion)
- Data Table on Canada - Market size and forecast 2024-2029 ($ billion)
- Chart on Canada - Year-over-year growth 2024-2029 (%)
- Data Table on Canada - Year-over-year growth 2024-2029 (%)
- 15.12 India - Market size and forecast 2024-2029
- Chart on India - Market size and forecast 2024-2029 ($ billion)
- Data Table on India - Market size and forecast 2024-2029 ($ billion)
- Chart on India - Year-over-year growth 2024-2029 (%)
- Data Table on India - Year-over-year growth 2024-2029 (%)
- 15.13 Saudi Arabia - Market size and forecast 2024-2029
- Chart on Saudi Arabia - Market size and forecast 2024-2029 ($ billion)
- Data Table on Saudi Arabia - Market size and forecast 2024-2029 ($ billion)
- Chart on Saudi Arabia - Year-over-year growth 2024-2029 (%)
- Data Table on Saudi Arabia - Year-over-year growth 2024-2029 (%)
- 15.14 South Korea - Market size and forecast 2024-2029
- Chart on South Korea - Market size and forecast 2024-2029 ($ billion)
- Data Table on South Korea - Market size and forecast 2024-2029 ($ billion)
- Chart on South Korea - Year-over-year growth 2024-2029 (%)
- Data Table on South Korea - Year-over-year growth 2024-2029 (%)
- 15.15 Brazil - Market size and forecast 2024-2029
- Chart on Brazil - Market size and forecast 2024-2029 ($ billion)
- Data Table on Brazil - Market size and forecast 2024-2029 ($ billion)
- Chart on Brazil - Year-over-year growth 2024-2029 (%)
- Data Table on Brazil - Year-over-year growth 2024-2029 (%)
- 15.16 Germany - Market size and forecast 2024-2029
- Chart on Germany - Market size and forecast 2024-2029 ($ billion)
- Data Table on Germany - Market size and forecast 2024-2029 ($ billion)
- Chart on Germany - Year-over-year growth 2024-2029 (%)
- Data Table on Germany - Year-over-year growth 2024-2029 (%)
- 15.17 UAE - Market size and forecast 2024-2029
- Chart on UAE - Market size and forecast 2024-2029 ($ billion)
- Data Table on UAE - Market size and forecast 2024-2029 ($ billion)
- Chart on UAE - Year-over-year growth 2024-2029 (%)
- Data Table on UAE - Year-over-year growth 2024-2029 (%)
- 15.18 Market opportunity by geography
- Market opportunity by geography ($ billion)
- Data Tables on Market opportunity by geography ($ billion)
- 15.19 Rest of World (ROW) - Market size and forecast (2024-2029)
- Chart on Rest of World (ROW) - Market size and forecast (2024-2029) ($ billion)
- Data Table on Rest of World (ROW) - Market size and forecast (2024-2029) ($ billion)
- Chart on Rest of World (ROW) - Year-over-year growth (2024-2029) (%)
- Data Table on Rest of World (ROW) - Year-over-year growth (2024-2029) (%)
16 Drivers, Challenges, and Opportunity/Restraints
- 16.3 Impact of drivers and challenges
- Impact of drivers and challenges in 2024 and 2029
- 16.4 Market opportunities/restraints
17 Competitive Landscape
- 17.2 Competitive Landscape
- Overview on criticality of inputs and factors of differentiation
- 17.3 Landscape disruption
- Overview on factors of disruption
- 17.4 Industry risks
- Impact of key risks on business
18 Competitive Analysis
- 18.2 Company ranking index
- 18.3 Market positioning of companies
- Matrix on companies position and classification
- 18.4 BP Plc
- BP Plc - Overview
- BP Plc - Business segments
- BP Plc - Key news
- BP Plc - Key offerings
- BP Plc - Segment focus
- SWOT
- 18.5 Chevron Corp.
- Chevron Corp. - Overview
- Chevron Corp. - Business segments
- Chevron Corp. - Key news
- Chevron Corp. - Key offerings
- Chevron Corp. - Segment focus
- SWOT
- 18.6 China National Petroleum Corp.
- China National Petroleum Corp. - Overview
- China National Petroleum Corp. - Product / Service
- China National Petroleum Corp. - Key offerings
- SWOT
- 18.7 Exxon Mobil Corp.
- Exxon Mobil Corp. - Overview
- Exxon Mobil Corp. - Business segments
- Exxon Mobil Corp. - Key news
- Exxon Mobil Corp. - Key offerings
- Exxon Mobil Corp. - Segment focus
- SWOT
- 18.8 Hindustan Petroleum Corp. Ltd.
- Hindustan Petroleum Corp. Ltd. - Overview
- Hindustan Petroleum Corp. Ltd. - Business segments
- Hindustan Petroleum Corp. Ltd. - Key news
- Hindustan Petroleum Corp. Ltd. - Key offerings
- Hindustan Petroleum Corp. Ltd. - Segment focus
- SWOT
- 18.9 Indian Oil Corp. Ltd.
- Indian Oil Corp. Ltd. - Overview
- Indian Oil Corp. Ltd. - Business segments
- Indian Oil Corp. Ltd. - Key news
- Indian Oil Corp. Ltd. - Key offerings
- Indian Oil Corp. Ltd. - Segment focus
- SWOT
- 18.10 Kuwait Petroleum Corp.
- Kuwait Petroleum Corp. - Overview
- Kuwait Petroleum Corp. - Product / Service
- Kuwait Petroleum Corp. - Key offerings
- SWOT
- 18.11 Marathon Petroleum Corp.
- Marathon Petroleum Corp. - Overview
- Marathon Petroleum Corp. - Business segments
- Marathon Petroleum Corp. - Key offerings
- Marathon Petroleum Corp. - Segment focus
- SWOT
- 18.12 Reliance Industries Ltd.
- Reliance Industries Ltd. - Overview
- Reliance Industries Ltd. - Business segments
- Reliance Industries Ltd. - Key news
- Reliance Industries Ltd. - Key offerings
- Reliance Industries Ltd. - Segment focus
- SWOT
- 18.13 Rosneft Oil Co.
- Rosneft Oil Co. - Overview
- Rosneft Oil Co. - Product / Service
- Rosneft Oil Co. - Key offerings
- SWOT
- 18.14 Saudi Arabian Oil Co.
- Saudi Arabian Oil Co. - Overview
- Saudi Arabian Oil Co. - Product / Service
- Saudi Arabian Oil Co. - Key offerings
- SWOT
- 18.15 Shell plc
- Shell plc - Overview
- Shell plc - Business segments
- Shell plc - Key news
- Shell plc - Key offerings
- Shell plc - Segment focus
- SWOT
- 18.16 The Dow Chemical Co.
- The Dow Chemical Co. - Overview
- The Dow Chemical Co. - Business segments
- The Dow Chemical Co. - Key news
- The Dow Chemical Co. - Key offerings
- The Dow Chemical Co. - Segment focus
- SWOT
- 18.17 TotalEnergies SE
- TotalEnergies SE - Overview
- TotalEnergies SE - Business segments
- TotalEnergies SE - Key news
- TotalEnergies SE - Key offerings
- TotalEnergies SE - Segment focus
- SWOT
- 18.18 Valero Energy Corp.
- Valero Energy Corp. - Overview
- Valero Energy Corp. - Business segments
- Valero Energy Corp. - Key offerings
- Valero Energy Corp. - Segment focus
- SWOT
19 Appendix
- 19.2 Inclusions and exclusions checklist
- Inclusions checklist
- Exclusions checklist
- 19.3 Currency conversion rates for US$
- Currency conversion rates for US$
- 19.4 Research methodology
- 19.7 Validation techniques employed for market sizing
- Validation techniques employed for market sizing
- 19.9 360 degree market analysis
- 360 degree market analysis
- 19.10 List of abbreviations