
Passive Optical LAN Market Size 2024-2028
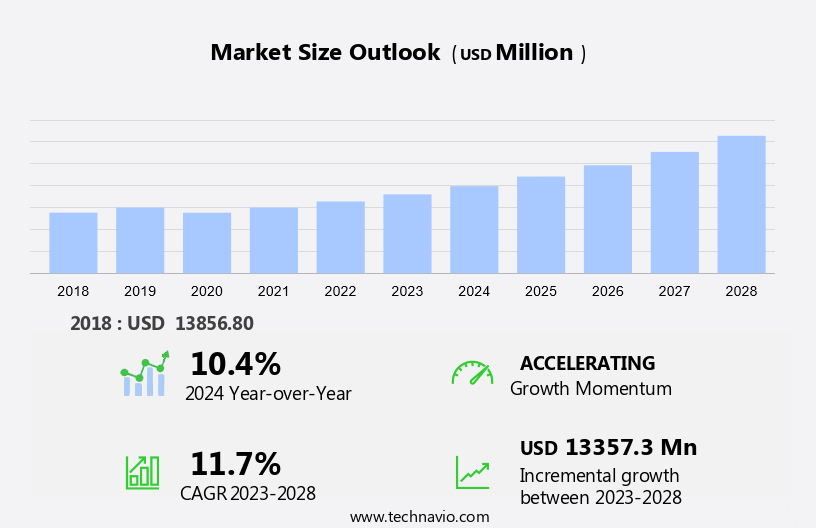
The passive optical LAN market size is forecast to increase by USD 13.36 billion at a CAGR of 11.7% between 2023 and 2028.
- The market is experiencing significant growth due to the increasing demand for energy-efficient networks and high-speed broadband services. With the rise of remote learning and telecom services, the need for bandwidth has become increasingly important. However, the limited infrastructure for fiber-optic networks poses a challenge. Optical power splitters and filters play a crucial role in addressing this challenge by enabling point-to-multipoint topology and the use of single-mode fiber. The adoption of POL technology is expected to continue as it offers cost savings and improved network efficiency compared to traditional active networks. This trend is particularly relevant in the US market, where educational institutions and businesses are seeking reliable and cost-effective solutions for their communication needs. The use of POL technology in energy-efficient networks is also gaining traction as organizations strive to reduce their carbon footprint and save on energy costs.
What will be the Size of the Market During the Forecast Period?
- The Passive Optical LAN (Local Area Network) is an advanced optical networking technology that offers significant advantages in terms of energy usage and high-speed data transfer. This technology is a key component of digital transformation initiatives in various sectors, including healthcare, telecom, and data centers. Passive Optical LAN utilizes a point-to-multipoint topology, which allows one fiber to serve multiple end-users. This architecture reduces the need for active equipment, such as optical power splitters, wavelength division multiplexers, and optical filters, leading to energy savings. The adoption of Passive Optical LAN is gaining momentum due to the increasing demand for energy-efficient networks.
-
In addition, it is a cost-effective solution for providing high-speed data transmission, as it reduces the need for extensive cabling and active equipment. Additionally, it offers improved reliability and scalability, making it a suitable option for large-scale deployments. In conclusion, Passive Optical LAN is a game-changer in the field of network infrastructure. Its energy-efficient design, high-speed data transfer capabilities, and scalability make it an ideal solution for various sectors, including healthcare, telecom, and data centers. As the demand for high-speed connectivity continues to grow, Passive Optical LAN is poised to play a pivotal role in shaping the future of digital infrastructure.
How is this market segmented and which is the largest segment?
The market research report provides comprehensive data (region-wise segment analysis), with forecasts and estimates in "USD billion" for the period 2024-2028, as well as historical data from 2018-2022 for the following segments.
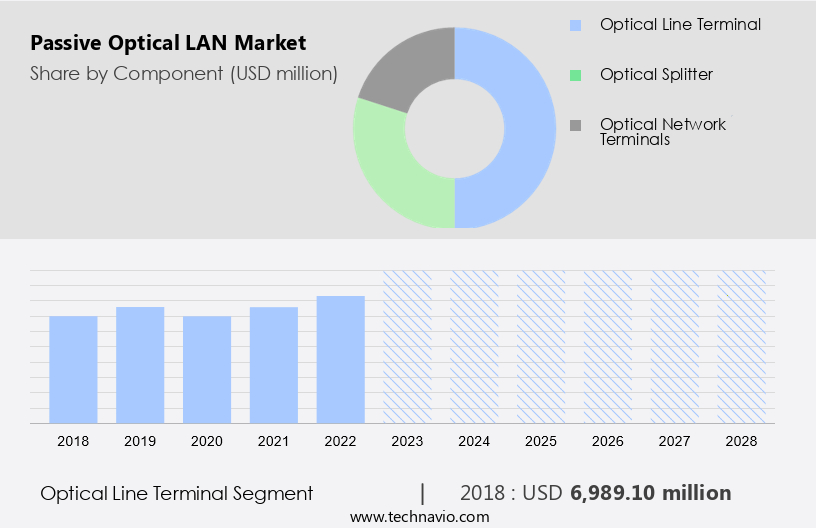
- Component
- Optical line terminal
- Optical splitter
- Optical network terminals
- Geography
- APAC
- South Korea
- Singapore
- North America
- US
- Europe
- South America
- Middle East and Africa
- APAC
By Component Insights
- The optical line terminal segment is estimated to witness significant growth during the forecast period.
An Optical Line Terminal (OLT) is a crucial component in a passive optical network, acting as the endpoint hardware device. The OLT comprises a central processing unit (CPU), PON cards, a voice gateway (VGW), and a gateway router (GWR) uplink card. This device transmits data signals to up to 128 users, via optical splitters, over a range of up to 12.5 miles at a wavelength of 1,490 nanometers (nm). The OLT plays a significant role in multiplexing data streams between signal conversion instruments at the opposite ends of the network, specifically the optical network units (ONUs) or optical network terminals (ONTs).
In addition, its primary functions include converting standard signals from a Fiber Optic Service (FiOS) provider into the frequency and framing required by the Passive Optical Network (PON) system. Optical power splitters and filters are essential components in this network setup. They help distribute the optical power among multiple users while maintaining signal quality. Energy-efficient networks are a growing trend in the telecom industry, and passive optical networks, with their point-to-multipoint topology and use of single-mode fiber, are an excellent choice for energy savings. Remote learning and educational applications are increasingly adopting energy-efficient networks, making the market a promising sector for growth.
Get a glance at the market report of share of various segments Request Free Sample
The optical line terminal segment was valued at USD 6.98 billion in 2018 and showed a gradual increase during the forecast period.
Regional Analysis
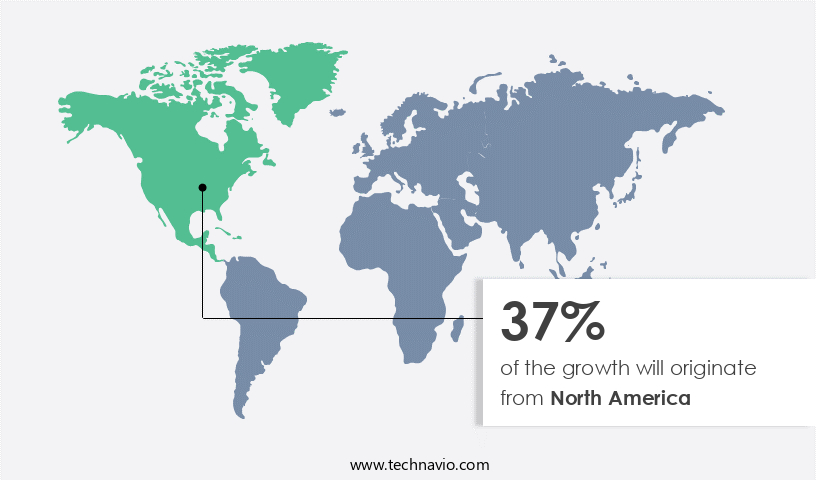
- North America is estimated to contribute 37% to the growth of the global market during the forecast period.
Technavio's analysts have elaborately explained the regional trends and drivers that shape the market during the forecast period.
For more insights on the market share of various regions Request Free Sample
The market in the Asia Pacific region is experiencing significant growth due to the expanding telecom subscriber base, the proliferation of fiber optics in communication networks, and the escalating demand for high-speed Internet among consumers. The increasing deployment of fiber optics is leading to the adoption of passive optical LAN technology, thereby fueling market expansion. Furthermore, countries like India and China are prioritizing digitalization, which necessitates the implementation of fiber optic technologies. For instance, the Indian government launched the National Optic Fiber Network (NOFN) initiative, aiming to provide fiber optic connectivity to over 200,000 villages at an estimated cost of around USD 3.6 billion. This focus on digital infrastructure development will further boost the demand for passive optical LAN solutions. In summary, the increasing need for high-speed connectivity, coupled with government initiatives and digitalization efforts, is driving the growth of the market in the Asia Pacific region.
Market Dynamics
Our researchers analyzed the data with 2023 as the base year, along with the key drivers, trends, and challenges. A holistic analysis of drivers will help companies refine their marketing strategies to gain a competitive advantage.
What are the key market drivers leading to the rise in adoption of Passive Optical LAN Market?
High demand for high-speed broadband services is the key driver of the market.
- In today's digital age, the Internet has become an indispensable part of our lives, driving the need for high-bandwidth applications. The proliferation of smartphones and other mobile devices has significantly increased the demand for Internet connectivity, leading to the development of ultra-high bandwidth services. According to recent reports, global mobile data traffic is projected to grow by over 30% from 2019 to 2025, reaching 164 exabytes per month by the end of the forecast period. Additionally, global Internet capacity expanded by 23% in 2023, reaching 1217 terabytes per second. As the demand for higher data rates continues to rise, there is a growing need to enhance existing network architectures.
- In addition, fiber optic networks are increasingly being adopted to meet the bandwidth demands of cloud computing, remote work, and telecommunications. However, the high cost of all-fiber infrastructure has led to the emergence of hybrid fiber-copper networks as a cost-effective alternative. These networks combine the advantages of fiber optics and copper cables to offer high-speed connectivity while minimizing costs. In summary, the growth in Internet penetration and the increasing use of mobile devices have led to an increase in demand for high-bandwidth services. Fiber optic networks and hybrid fiber-copper networks are becoming the go-to solutions to meet this demand, offering ultra-high bandwidth and cost-effective alternatives to traditional copper cable infrastructure.
What are the market trends shaping the Passive Optical LAN Market?
Rising internet penetration and telecom services with increasing demand for bandwidth is the upcoming trend in the market.
- The demand for high-speed, reliable, and energy-efficient network infrastructure is driving the growth of the Passive Optical LAN (POL) market in the US and globally. With the increasing digital transformation across various sectors such as healthcare, education, business, and government, the need for high-capacity networks capable of handling large data transfer is becoming essential. Traditional copper-based Local Area Networks (LANs) are struggling to keep up with the escalating bandwidth requirements, especially as more devices connect and applications demand faster data transfer.
- Furthermore, POL technology, which utilizes fiber-optic infrastructure and a Wavelength Division Multiplexer (WDM), offers a scalable and future-proof solution. It provides high-speed internet access while being energy efficient and cost-effective, making it an attractive option for organizations seeking to upgrade their network infrastructure. As the US continues to prioritize digital advancements, the POL market is expected to expand significantly, offering opportunities for businesses and service providers.
What challenges does Passive Optical LAN Market face during the growth?
Limited infrastructure for fiber-optic networks is a key challenge affecting the market growth.
- Fiber optic technology has emerged as a preferred choice for network infrastructure deployment due to its high data transfer speeds, despite the initial investment and installation complexities. Traditional copper cabling, while widely used for communication purposes, falls short in terms of bandwidth and speed. Network Original Equipment Manufacturers (OEMs) are addressing this challenge by integrating G.Fast chipsets into distribution power units (DPUs) and customer premises equipment (CPE) devices, allowing the utilization of existing copper cabling. Optical fibers, though more expensive than copper cables, offer numerous advantages. They are immune to electromagnetic interference and can transmit data over longer distances with minimal signal loss.
- However, the installation process for fiber optics requires specialized expertise and equipment, including optical cables, optical couplers, optical power splitters, and optical transceivers. Synchronous Optical Network (SONET) technology, a fiber optic technology, has been instrumental in enhancing network performance and reliability. Despite the initial investment and installation complexities, the adoption of fiber optics is on the rise due to its superior data transfer capabilities.
Exclusive Customer Landscape
The market forecasting report includes the adoption lifecycle of the market, covering from the innovator's stage to the laggard's stage. It focuses on adoption rates in different regions based on penetration. Furthermore, the market report also includes key purchase criteria and drivers of price sensitivity to help companies evaluate and develop their market growth analysis strategies.
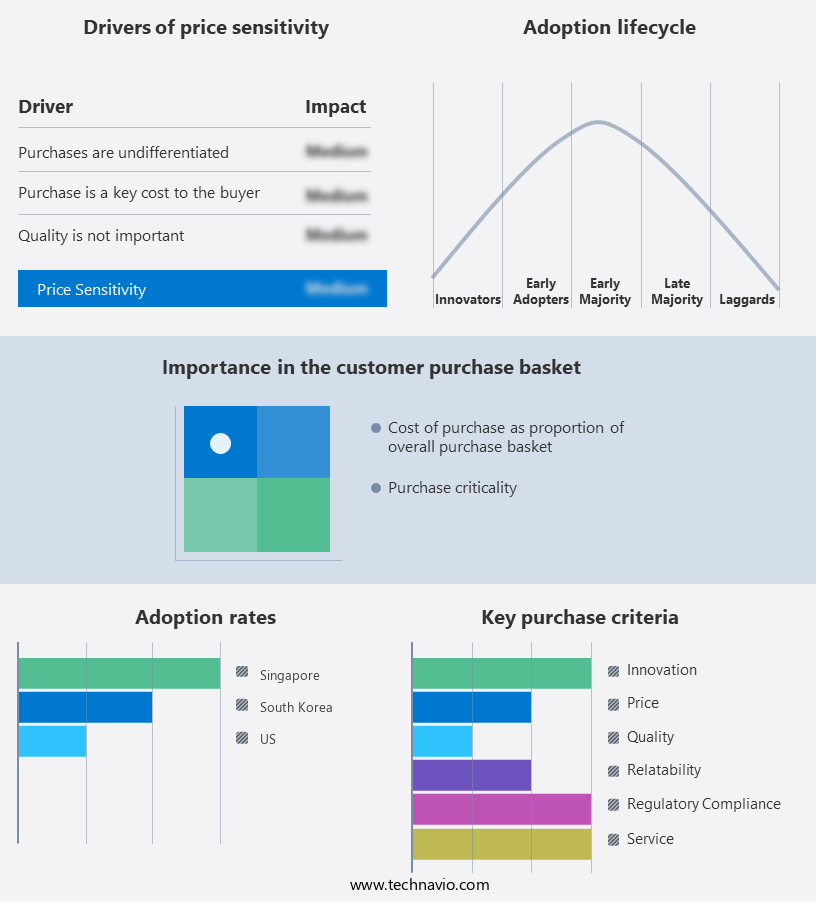
Customer Landscape
Key Companies & Market Insights
Companies are implementing various strategies, such as strategic alliances, market forecast , partnerships, mergers and acquisitions, geographical expansion, and product/service launches, to enhance their presence in the market.
The market research and growth report includes detailed analyses of the competitive landscape of the market and information about key companies, including:
- 3M Co.
- Adtran Holdings Inc.
- ALE International
- Broadcom Inc.
- Calix Inc.
- Cisco Systems Inc.
- CommScope Holding Co. Inc.
- FIBERLAN SOLUTIONS Ltd.
- Global Netwave LLC
- Huawei Technologies Co. Ltd.
- Juniper Networks Inc.
- Kortman Electric Inc.
- MLR Networks Ltd.
- NXP Semiconductors NV
- Optical Cable Corp.
- Shanghai Brellet Telecommunication Technology Co. Ltd.
- TE Connectivity Ltd.
- Tellabs Access LLC
- ZTE Corp.
Qualitative and quantitative analysis of companies has been conducted to help clients understand the wider business environment as well as the strengths and weaknesses of key market players. Data is qualitatively analyzed to categorize companies as pure play, category-focused, industry-focused, and diversified; it is quantitatively analyzed to categorize companies as dominant, leading, strong, tentative, and weak.
Research Analyst Overview
Passive Optical LAN (Local Area Network) is an innovative solution for high-speed data transfer in optical networks. This technology utilizes point-to-multipoint topology and optical splitters to deliver high-speed internet to multiple users, making it an ideal choice for energy-efficient networks in various sectors. Digital transformation in industries such as healthcare, education, and telecom is driving the demand for passive optical LANs due to their ability to provide high-bandwidth connectivity and support for voice services, wireless services, video services, and data centers. Passive optical LANs use wavelength division multiplexer and optical filters to manage data transmission efficiently. Single-mode fiber is the primary component of this technology, ensuring ultra-high bandwidth and long-distance data transfer.
Furthermore, the use of optical power splitters reduces the number of required optical fibers, thereby lowering installation and maintenance costs. Passive optical LANs are increasingly popular in sectors requiring high-speed connectivity, such as remote learning, interactive gaming, and video-on-demand. The energy-efficient nature of this technology makes it an attractive option for organizations seeking to reduce their carbon footprint while upgrading their network infrastructure. Additionally, passive optical LANs offer improved security features, making them a suitable choice for organizations dealing with sensitive data and cybercrime concerns.
|
Market Scope |
|
|
Report Coverage |
Details |
|
Page number |
164 |
|
Base year |
2023 |
|
Historic period |
2018-2022 |
|
Forecast period |
2024-2028 |
|
Growth momentum & CAGR |
Accelerate at a CAGR of 11.7% |
|
Market growth 2024-2028 |
USD 13.36 billion |
|
Market structure |
Fragmented |
|
YoY growth 2023-2024(%) |
10.4 |
|
Key countries |
US, Singapore, and South Korea |
|
Competitive landscape |
Leading Companies, Market Positioning of Companies, Competitive Strategies, and Industry Risks |
What are the Key Data Covered in this Market Research and Growth Report?
- CAGR of the market during the forecast period
- Detailed information on factors that will drive the market growth and forecasting between 2024 and 2028
- Precise estimation of the size of the market and its contribution of the market in focus to the parent market
- Accurate predictions about upcoming market growth and trends and changes in consumer behaviour
- Growth of the market across APAC, North America, Europe, South America, and Middle East and Africa
- Thorough analysis of the market's competitive landscape and detailed information about companies
- Comprehensive analysis of factors that will challenge the growth of market companies
We can help! Our analysts can customize this market research report to meet your requirements. Get in touch
 RIA -
RIA - 
