Permanent Magnets Market Analysis, Size, and Forecast 2026-2030: APAC (China, Japan, and India), North America (US, Canada, and Mexico), Europe (Germany, France, and UK), South America (Brazil and Argentina), Middle East and Africa (Saudi Arabia, UAE, and South Africa), and Rest of World (ROW)

Permanent Magnets Market Analysis, Size, and Forecast 2026-2030:
APAC (China, Japan, and India), North America (US, Canada, and Mexico), Europe (Germany, France, and UK), South America (Brazil and Argentina), Middle East and Africa (Saudi Arabia, UAE, and South Africa), and Rest of World (ROW)

Published: Apr 2026 311 Pages SKU: IRTNTR71716

Market Overview at a Glance

$20.35 B
Market Opportunity
9.1%
CAGR 2025 - 2030
60.1%
APAC Growth
$19.26 B
NdFeB magnets segment 2024

Permanent Magnets Market Size 2026-2030

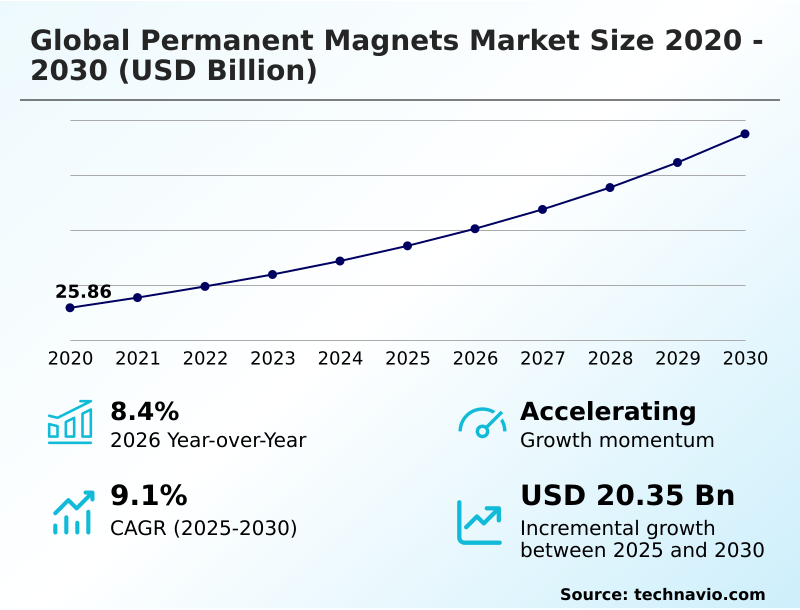
The permanent magnets market size is valued to increase by USD 20.35 billion, at a CAGR of 9.1% from 2025 to 2030. Acceleration of global electric vehicle propulsion systems will drive the permanent magnets market.

Major Market Trends & Insights

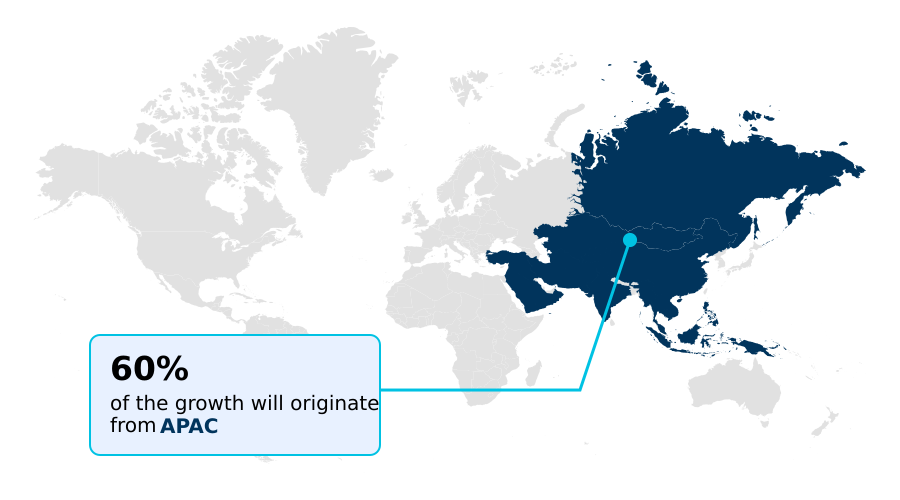
  • APAC dominated the market and accounted for a 60.1% growth during the forecast period.
  • By Material - NdFeB magnets segment was valued at USD 19.26 billion in 2024
  • By End-user - Consumer goods and electronics segment accounted for the largest market revenue share in 2024

Market Size & Forecast

  • Market Opportunities: USD 31.61 billion
  • Market Future Opportunities: USD 20.35 billion
  • CAGR from 2025 to 2030 : 9.1%

Market Summary

  • The permanent magnets market is undergoing a structural transformation driven by global electrification and industrial automation. These materials are fundamental to energy conversion and precision motion in critical sectors. In electric vehicles, high-performance magnets enable efficient and powerful traction motors, while in renewable energy, they are essential for direct-drive wind turbine generators.
  • The push for Industry 4.0 has also amplified demand, with industrial robots and automated systems relying on compact servomotors and actuators for precise control. A key business scenario involves an automotive OEM redesigning its electric powertrain to incorporate next-generation magnets, which improves vehicle range by 8% while reducing motor weight. This advancement simultaneously addresses consumer expectations and stringent emissions regulations.
  • However, the market navigates a complex landscape of raw material supply chain vulnerabilities and intense research into rare-earth-free alternatives. As industries prioritize efficiency and sustainability, innovation in magnetic materials, such as enhancing coercivity and thermal stability, remains a critical focus for maintaining a competitive edge.

What will be the Size of the Permanent Magnets Market during the forecast period?

Get Key Insights on Market Forecast (PDF) Request Free Sample

How is the Permanent Magnets Market Segmented?

The permanent magnets industry research report provides comprehensive data (region-wise segment analysis), with forecasts and estimates in "USD million" for the period 2026-2030, as well as historical data from 2020-2024 for the following segments.
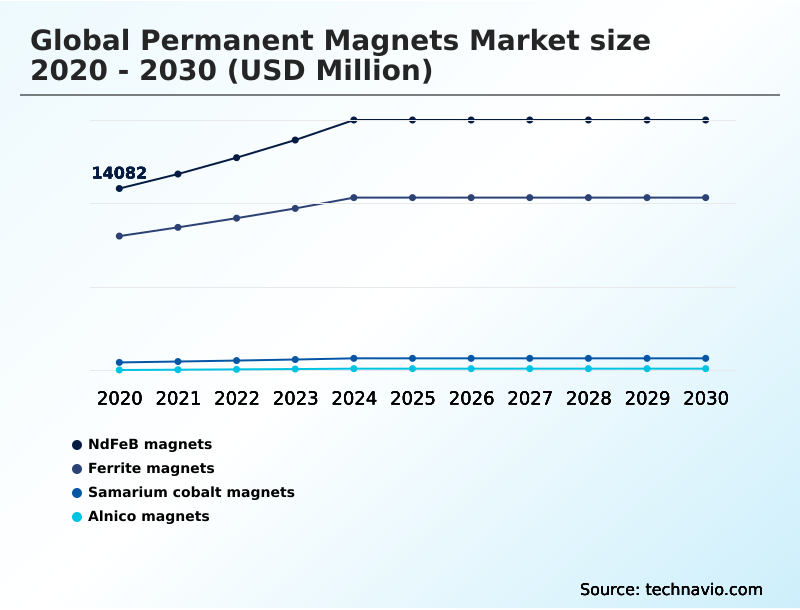
  • Material
    • NdFeB magnets
    • Ferrite magnets
    • Samarium cobalt magnets
    • Alnico magnets
  • End-user
    • Consumer goods and electronics
    • Automotive
    • General industrial
    • Aerospace and defense
    • Others
  • Method
    • Sintered magnets
    • Bonded magnets
    • Injection molded magnets
    • Hot-pressed magnets
  • Geography
    • APAC
      • China
      • Japan
      • India
    • North America
      • US
      • Canada
      • Mexico
    • Europe
      • Germany
      • France
      • UK
    • South America
      • Brazil
      • Argentina
    • Middle East and Africa
      • Saudi Arabia
      • UAE
      • South Africa
    • Rest of World (ROW)

By Material Insights

The ndfeb magnets segment is estimated to witness significant growth during the forecast period.

NdFeB magnets represent the premier segment, commanding over 61% of the market share due to their unmatched energy product and magnetic torque. These high-performance magnetic materials are foundational to modern electric vehicle propulsion systems and other demanding applications.

Their superior thermal stability is critical for the reliability of traction motors and permanent magnet synchronous motors, where maintaining performance under load is essential for energy conversion efficiency.

Innovations in material science focus on enhancing the power-to-weight ratio and managing core loss reduction, ensuring these components remain central to the performance of electric powertrain components and high-temperature magnet performance.

This segment’s dominance underscores the industry's reliance on materials that provide maximum performance in compact designs.

Request Free Sample

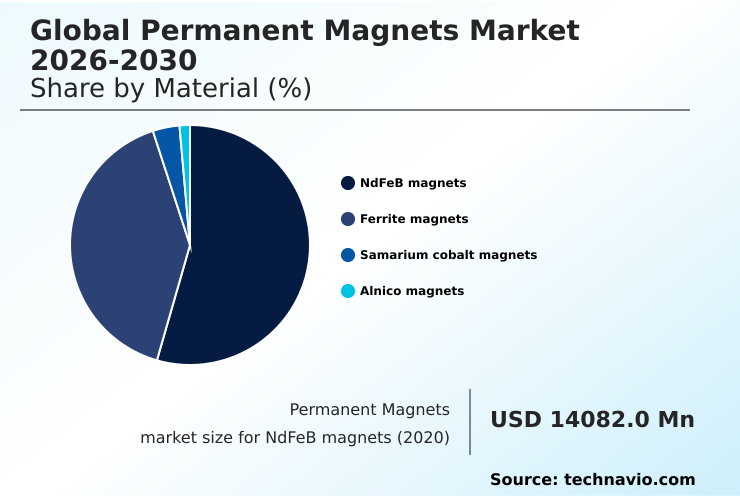
The NdFeB magnets segment was valued at USD 19.26 billion in 2024 and showed a gradual increase during the forecast period.

Request Free Sample

Regional Analysis

APAC is estimated to contribute 60.1% to the growth of the global market during the forecast period.Technavio’s analysts have elaborately explained the regional trends and drivers that shape the market during the forecast period.

See How Permanent Magnets Market Demand is Rising in APAC Request Free Sample

Geographically, the market is characterized by APAC's dominance, which accounts for over 60% of the incremental growth, driven by its extensive manufacturing infrastructure for sintered neodymium magnets and magnetic assemblies.

This region benefits from integrated supply chains, from powder metallurgy to finished bonded magnets. In contrast, North America and Europe are aggressively pursuing regionalized supply chains to mitigate risks.

Investment in North American domestic production of high-coercivity grades has increased by over 30% as a strategic response. European initiatives focus on creating a circular economy for magnets, advancing technologies for recycling samarium cobalt magnets and other high-value materials.

This trend supports critical sectors like medical magnetic resonance imaging systems and aerospace, where samarium cobalt thermal stability and the unique properties of alnico magnet applications are indispensable.

Market Dynamics

Our researchers analyzed the data with 2025 as the base year, along with the key drivers, trends, and challenges. A holistic analysis of drivers will help companies refine their marketing strategies to gain a competitive advantage.

  • Strategic decisions within the permanent magnets market are increasingly shaped by nuanced technical and supply chain considerations. The classic debate of sintered vs bonded magnet properties now extends into complex choices involving injection molded magnets for actuators and hot-pressed magnets for aerospace, where performance under extreme conditions is paramount.
  • For designers of next-generation systems, optimizing coercivity in NdFeB magnets is a critical task, balanced against the industry-wide goal of reducing heavy rare earth content. This has accelerated research into advancements in rare earth free magnets and other magnet-free alternatives for motors. In high-volume sectors, the role of ferrite magnets in consumer electronics remains secure due to cost-effectiveness.
  • Meanwhile, specialized applications drive demand for high temperature samarium cobalt magnets and alnico magnets for high-temp sensors. The focus on the complete lifecycle is intensifying, with grain boundary diffusion technology benefits being weighed alongside the circular economy impact on magnet pricing.
  • This is particularly relevant as the direct-drive wind turbine magnet needs grow, and the market for high-performance magnets for EV traction expands. This strategic sourcing environment has led some firms to achieve a 15% greater supply chain stability metric compared to those reliant on single-source material streams.

What are the key market drivers leading to the rise in the adoption of Permanent Magnets Industry?

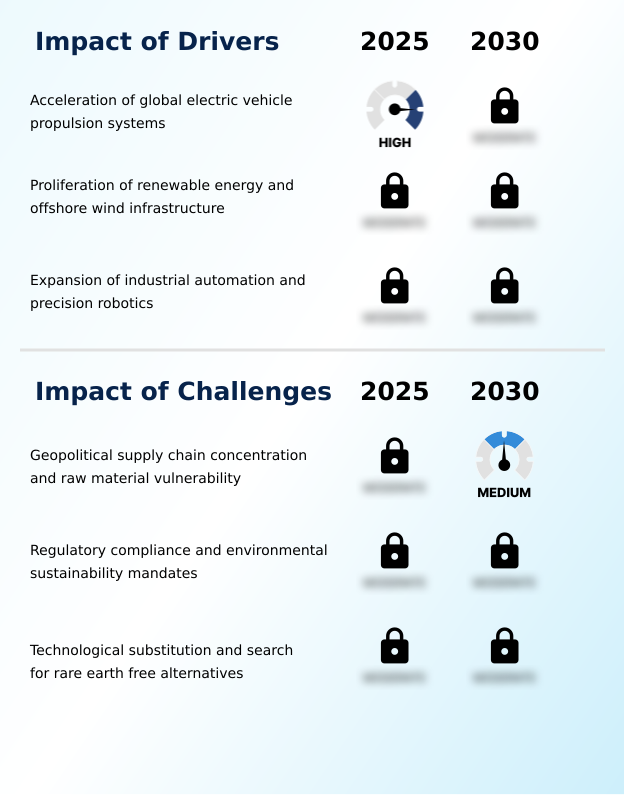
  • The rapid acceleration of global electric vehicle propulsion systems represents a primary driver for market growth.

  • Market growth is fundamentally driven by global electrification and automation. The proliferation of industrial automation robotics and advanced sensor technologies relies on the precision motion control provided by high-performance servomotors and actuators.
  • In the energy sector, direct-drive wind turbines utilize massive wind turbine generators, with demand for materials exhibiting high remanence and coercivity growing steadily.
  • The adoption of brushless direct current motors in various applications has improved energy efficiency by over 10% in many cases. This shift toward sustainable magnet production and miniaturized electronic devices requires materials with exceptional magnetic field strength.
  • As industries from automotive to consumer goods prioritize efficiency and performance, the need for advanced magnetic solutions that enable these technologies continues to expand, pushing for continuous innovation in materials and design.

What are the market trends shaping the Permanent Magnets Industry?

  • A strategic shift toward a circular economy and magnet recycling is a prominent market trend, reflecting a growing emphasis on supply chain sustainability and resource security.

  • Key market trends are centered on enhancing supply chain resilience and material sustainability. The move toward a circular economy for magnets is accelerating, with new hydrometallurgical processing techniques improving secondary material recovery rates by up to 20%.
  • This emphasis on closed-loop supply chains and rare earth magnet recycling is driven by both environmental mandates and the need to mitigate price volatility. Concurrently, regionalized supply chains are being established to reduce geopolitical risk. Technologically, advancements in magnetic circuit design focus on reducing the use of rare earth elements without sacrificing performance.
  • This includes optimizing magnetic orientation in hot-pressed magnets and developing novel compositions for injection molded magnets. Such innovations allow manufacturers to produce components with enhanced properties while decreasing reliance on primary-sourced heavy rare earth elements by over 15%.

What challenges does the Permanent Magnets Industry face during its growth?

  • Geopolitical supply chain concentration and vulnerability in raw material sourcing present a key challenge affecting industry growth.

  • The market faces significant challenges from geopolitical supply chain risk and the intense search for viable alternatives. With over 85% of critical raw material processing concentrated in a single region, industries are vulnerable to trade disruptions, which has accelerated research into magnet-free motor architectures.
  • These rare-earth-free alternatives, alongside improved ferrite magnetic components, present a substitution threat in applications where cost is more critical than power density. Advancements in computational material science are enabling the rapid development of advanced material compositions for anisotropic magnets, potentially creating alternatives that reduce magnet requirements by up to 30% in certain motor designs.
  • The market for traditional materials like ferrite magnets and alnico magnets must now compete not only on cost but also on performance against these emerging technologies, which offer an escape from raw material volatility.

Exclusive Technavio Analysis on Customer Landscape

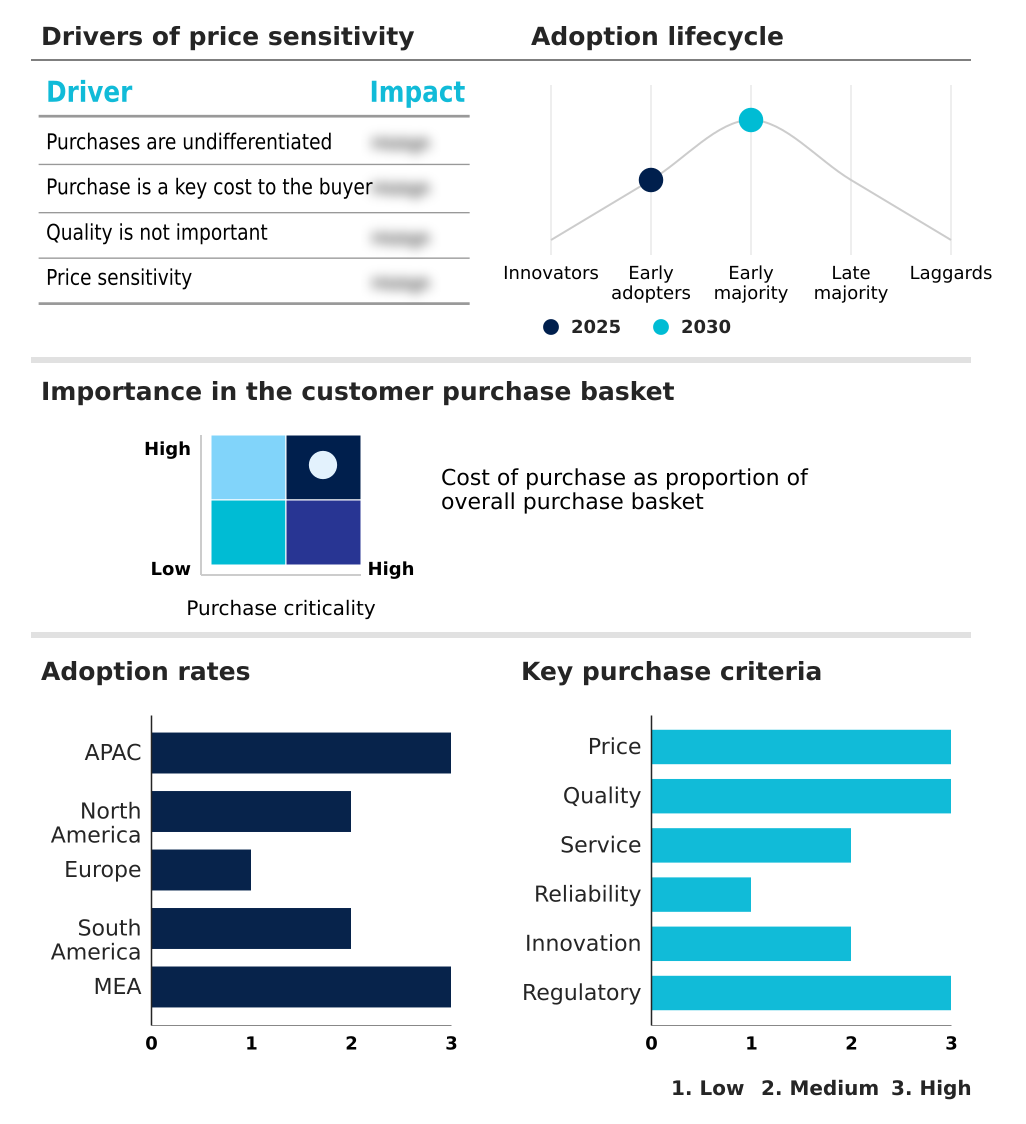
The permanent magnets market forecasting report includes the adoption lifecycle of the market, covering from the innovator’s stage to the laggard’s stage. It focuses on adoption rates in different regions based on penetration. Furthermore, the permanent magnets market report also includes key purchase criteria and drivers of price sensitivity to help companies evaluate and develop their market growth analysis strategies.

Customer Landscape of Permanent Magnets Industry

Competitive Landscape

Companies are implementing various strategies, such as strategic alliances, permanent magnets market forecast, partnerships, mergers and acquisitions, geographical expansion, and product/service launches, to enhance their presence in the industry.

Adams Magnetic Products Co. - Offers a portfolio of high-performance magnetic materials, including neodymium and alnico magnets, for diverse industrial and consumer applications.

The industry research and growth report includes detailed analyses of the competitive landscape of the market and information about key companies, including:

  • Adams Magnetic Products Co.
  • Arnold Magnetic Technologies
  • Bunting Magnetics Co.
  • Daido Electronics Co. Ltd.
  • Dura Magnetics Inc.
  • Earth Panda Magnet GmbH
  • Electron Energy Corp.
  • Galaxy Magnetic Co. Ltd.
  • Goudsmit Magnetics Groep B.V.
  • Hengdian Magnetics Co. Ltd.
  • MP Materials Corp.
  • Neo Performance Materials Inc.
  • Ningbo Yunsheng Co. Ltd.
  • Proterial Ltd.
  • Shin Etsu Chemical Co. Ltd.
  • Sinomag Technology Co. Ltd.
  • TDK Corp.
  • Tokyo Ferrite Mfg. Co. Ltd.
  • Vacuumschmelze GmbH and Co. KG

Qualitative and quantitative analysis of companies has been conducted to help clients understand the wider business environment as well as the strengths and weaknesses of key industry players. Data is qualitatively analyzed to categorize companies as pure play, category-focused, industry-focused, and diversified; it is quantitatively analyzed to categorize companies as dominant, leading, strong, tentative, and weak.

Recent Development and News in Permanent magnets market

  • In October, 2024, Arnold Magnetic Technologies Corp. established a landmark agreement to strengthen its rare earth supply chain and support domestic manufacturing resilience.
  • In November, 2024, Proterial Ltd. announced the establishment of a new production facility in Andhra Pradesh, India, dedicated to high-performance amorphous metal materials for automotive applications.
  • In January, 2025, the United States government implemented a comprehensive twenty-five percent tariff on imported Chinese permanent magnets, compelling OEMs to accelerate the localization of their supply chains.
  • In March, 2025, the Ministry of Heavy Industries in India issued a global request for proposals to establish integrated manufacturing facilities for sintered neodymium-iron-boron magnets.

Dive into Technavio’s robust research methodology, blending expert interviews, extensive data synthesis, and validated models for unparalleled Permanent Magnets Market insights. See full methodology.

Market Scope
Page number 311
Base year 2025
Historic period 2020-2024
Forecast period 2026-2030
Growth momentum & CAGR Accelerate at a CAGR of 9.1%
Market growth 2026-2030 USD 20353.3 million
Market structure Fragmented
YoY growth 2025-2026(%) 8.4%
Key countries China, Japan, India, South Korea, Australia, Indonesia, US, Canada, Mexico, Germany, France, UK, Italy, Spain, The Netherlands, Brazil, Argentina, Chile, Saudi Arabia, UAE, South Africa, Turkey and Israel
Competitive landscape Leading Companies, Market Positioning of Companies, Competitive Strategies, and Industry Risks

Request Free Sample

Research Analyst Overview

  • The permanent magnets market is defined by a relentless push for material and processing innovation. Core technologies ranging from powder metallurgy for sintered magnets to advanced polymer binders for bonded magnets are evolving to meet new performance benchmarks. The magnetic properties, including magnetic field strength, coercivity, remanence, and thermal stability, are critical metrics driving development.
  • A key boardroom focus is aligning R&D budgets with long-term supply security, shifting investment toward processes like grain boundary diffusion to reduce dependence on heavy rare earth elements. This has led to the development of anisotropic magnets with superior magnetic orientation and demagnetization resistance, achieving a 25% improvement in high-temperature performance.
  • The application of these materials in traction motors, brushless direct current motors, and wind turbine generators is expanding, while servomotors and actuators for robotics demand higher magnetic torque and precision. Innovations in magnetic circuit design and core loss reduction are crucial for enhancing the efficiency of permanent magnet synchronous motors.

What are the Key Data Covered in this Permanent Magnets Market Research and Growth Report?

  • What is the expected growth of the Permanent Magnets Market between 2026 and 2030?

    • USD 20.35 billion, at a CAGR of 9.1%

  • What segmentation does the market report cover?

    • The report is segmented by Material (NdFeB magnets, Ferrite magnets, Samarium cobalt magnets, and Alnico magnets), End-user (Consumer goods and electronics, Automotive, General industrial, Aerospace and defense, and Others), Method (Sintered magnets, Bonded magnets, Injection molded magnets, and Hot-pressed magnets) and Geography (APAC, North America, Europe, South America, Middle East and Africa)

  • Which regions are analyzed in the report?

    • APAC, North America, Europe, South America and Middle East and Africa

  • What are the key growth drivers and market challenges?

    • Acceleration of global electric vehicle propulsion systems, Geopolitical supply chain concentration and raw material vulnerability

  • Who are the major players in the Permanent Magnets Market?

    • Adams Magnetic Products Co., Arnold Magnetic Technologies, Bunting Magnetics Co., Daido Electronics Co. Ltd., Dura Magnetics Inc., Earth Panda Magnet GmbH, Electron Energy Corp., Galaxy Magnetic Co. Ltd., Goudsmit Magnetics Groep B.V., Hengdian Magnetics Co. Ltd., MP Materials Corp., Neo Performance Materials Inc., Ningbo Yunsheng Co. Ltd., Proterial Ltd., Shin Etsu Chemical Co. Ltd., Sinomag Technology Co. Ltd., TDK Corp., Tokyo Ferrite Mfg. Co. Ltd. and Vacuumschmelze GmbH and Co. KG

Market Research Insights

  • The market is shaped by a dynamic interplay of technological innovation and strategic supply chain management. The push for high-performance magnetic materials is evident as industries adopt solutions that improve energy conversion efficiency by up to 15%. This is especially true for electric vehicle propulsion systems and industrial automation robotics, which depend on superior power-to-weight ratios.
  • In response to geopolitical supply chain risk, companies are exploring regionalized supply chains and advanced material compositions, leading to a 20% increase in investment in secondary material recovery. These closed-loop supply chains not only mitigate sourcing risks but also align with corporate sustainability mandates.
  • The development of rare-earth-free alternatives continues to gain traction, with research demonstrating comparable performance in certain applications, challenging the dominance of traditional materials.

We can help! Our analysts can customize this permanent magnets market research report to meet your requirements.

Get in touch

1. Executive Summary

1.1 Market overview

Executive Summary - Chart on Market Overview
Executive Summary - Data Table on Market Overview
Executive Summary - Chart on Global Market Characteristics
Executive Summary - Chart on Market by Geography
Executive Summary - Chart on Market Segmentation by Material
Executive Summary - Chart on Market Segmentation by End-user
Executive Summary - Chart on Market Segmentation by Method
Executive Summary - Chart on Incremental Growth
Executive Summary - Data Table on Incremental Growth
Executive Summary - Chart on Company Market Positioning

2. Technavio Analysis

2.1 Analysis of price sensitivity, lifecycle, customer purchase basket, adoption rates, and purchase criteria

2.2 Criticality of inputs and Factors of differentiation

Chart on Overview on criticality of inputs and factors of differentiation

2.3 Factors of disruption

Chart on Overview on factors of disruption

2.4 Impact of drivers and challenges

Chart on Impact of drivers and challenges in 2025 and 2030

3. Market Landscape

3.1 Market ecosystem

Chart on Parent Market
Data Table on - Parent Market

3.2 Market characteristics

Chart on Market characteristics analysis

3.3 Value chain analysis

Chart on Value chain analysis

4. Market Sizing

4.1 Market definition

Data Table on Offerings of companies included in the market definition

4.2 Market segment analysis

Market segments

4.3 Market size 2025

4.4 Market outlook: Forecast for 2025-2030

Chart on Global - Market size and forecast 2025-2030 ($ million)
Data Table on Global - Market size and forecast 2025-2030 ($ million)
Chart on Global Market: Year-over-year growth 2025-2030 (%)
Data Table on Global Market: Year-over-year growth 2025-2030 (%)

5. Historic Market Size

5.1 Global Permanent Magnets Market 2020 - 2024

Historic Market Size - Data Table on Global Permanent Magnets Market 2020 - 2024 ($ million)

5.2 Material segment analysis 2020 - 2024

Historic Market Size - Material Segment 2020 - 2024 ($ million)

5.3 End-user segment analysis 2020 - 2024

Historic Market Size - End-user Segment 2020 - 2024 ($ million)

5.4 Method segment analysis 2020 - 2024

Historic Market Size - Method Segment 2020 - 2024 ($ million)

5.5 Geography segment analysis 2020 - 2024

Historic Market Size - Geography Segment 2020 - 2024 ($ million)

5.6 Country segment analysis 2020 - 2024

Historic Market Size - Country Segment 2020 - 2024 ($ million)

6. Qualitative Analysis

6.1 Impact of AI on global permanent magnets market

6.2 Impact of geopolitical conflicts on global permanent magnets market

7. Five Forces Analysis

7.1 Five forces summary

Five forces analysis - Comparison between 2025 and 2030

7.2 Bargaining power of buyers

Bargaining power of buyers - Impact of key factors 2025 and 2030

7.3 Bargaining power of suppliers

Bargaining power of suppliers - Impact of key factors in 2025 and 2030

7.4 Threat of new entrants

Threat of new entrants - Impact of key factors in 2025 and 2030

7.5 Threat of substitutes

Threat of substitutes - Impact of key factors in 2025 and 2030

7.6 Threat of rivalry

Threat of rivalry - Impact of key factors in 2025 and 2030

7.7 Market condition

Chart on Market condition - Five forces 2025 and 2030

8. Market Segmentation by Material

8.1 Market segments

Chart on Material - Market share 2025-2030 (%)
Data Table on Material - Market share 2025-2030 (%)

8.2 Comparison by Material

Chart on Comparison by Material
Data Table on Comparison by Material

8.3 NdFeB magnets - Market size and forecast 2025-2030

Chart on NdFeB magnets - Market size and forecast 2025-2030 ($ million)
Data Table on NdFeB magnets - Market size and forecast 2025-2030 ($ million)
Chart on NdFeB magnets - Year-over-year growth 2025-2030 (%)
Data Table on NdFeB magnets - Year-over-year growth 2025-2030 (%)

8.4 Ferrite magnets - Market size and forecast 2025-2030

Chart on Ferrite magnets - Market size and forecast 2025-2030 ($ million)
Data Table on Ferrite magnets - Market size and forecast 2025-2030 ($ million)
Chart on Ferrite magnets - Year-over-year growth 2025-2030 (%)
Data Table on Ferrite magnets - Year-over-year growth 2025-2030 (%)

8.5 Samarium cobalt magnets - Market size and forecast 2025-2030

Chart on Samarium cobalt magnets - Market size and forecast 2025-2030 ($ million)
Data Table on Samarium cobalt magnets - Market size and forecast 2025-2030 ($ million)
Chart on Samarium cobalt magnets - Year-over-year growth 2025-2030 (%)
Data Table on Samarium cobalt magnets - Year-over-year growth 2025-2030 (%)

8.6 Alnico magnets - Market size and forecast 2025-2030

Chart on Alnico magnets - Market size and forecast 2025-2030 ($ million)
Data Table on Alnico magnets - Market size and forecast 2025-2030 ($ million)
Chart on Alnico magnets - Year-over-year growth 2025-2030 (%)
Data Table on Alnico magnets - Year-over-year growth 2025-2030 (%)

8.7 Market opportunity by Material

Market opportunity by Material ($ million)
Data Table on Market opportunity by Material ($ million)

9. Market Segmentation by End-user

9.1 Market segments

Chart on End-user - Market share 2025-2030 (%)
Data Table on End-user - Market share 2025-2030 (%)

9.2 Comparison by End-user

Chart on Comparison by End-user
Data Table on Comparison by End-user

9.3 Consumer goods and electronics - Market size and forecast 2025-2030

Chart on Consumer goods and electronics - Market size and forecast 2025-2030 ($ million)
Data Table on Consumer goods and electronics - Market size and forecast 2025-2030 ($ million)
Chart on Consumer goods and electronics - Year-over-year growth 2025-2030 (%)
Data Table on Consumer goods and electronics - Year-over-year growth 2025-2030 (%)

9.4 Automotive - Market size and forecast 2025-2030

Chart on Automotive - Market size and forecast 2025-2030 ($ million)
Data Table on Automotive - Market size and forecast 2025-2030 ($ million)
Chart on Automotive - Year-over-year growth 2025-2030 (%)
Data Table on Automotive - Year-over-year growth 2025-2030 (%)

9.5 General industrial - Market size and forecast 2025-2030

Chart on General industrial - Market size and forecast 2025-2030 ($ million)
Data Table on General industrial - Market size and forecast 2025-2030 ($ million)
Chart on General industrial - Year-over-year growth 2025-2030 (%)
Data Table on General industrial - Year-over-year growth 2025-2030 (%)

9.6 Aerospace and defense - Market size and forecast 2025-2030

Chart on Aerospace and defense - Market size and forecast 2025-2030 ($ million)
Data Table on Aerospace and defense - Market size and forecast 2025-2030 ($ million)
Chart on Aerospace and defense - Year-over-year growth 2025-2030 (%)
Data Table on Aerospace and defense - Year-over-year growth 2025-2030 (%)

9.7 Others - Market size and forecast 2025-2030

Chart on Others - Market size and forecast 2025-2030 ($ million)
Data Table on Others - Market size and forecast 2025-2030 ($ million)
Chart on Others - Year-over-year growth 2025-2030 (%)
Data Table on Others - Year-over-year growth 2025-2030 (%)

9.8 Market opportunity by End-user

Market opportunity by End-user ($ million)
Data Table on Market opportunity by End-user ($ million)

10. Market Segmentation by Method

10.1 Market segments

Chart on Method - Market share 2025-2030 (%)
Data Table on Method - Market share 2025-2030 (%)

10.2 Comparison by Method

Chart on Comparison by Method
Data Table on Comparison by Method

10.3 Sintered magnets - Market size and forecast 2025-2030

Chart on Sintered magnets - Market size and forecast 2025-2030 ($ million)
Data Table on Sintered magnets - Market size and forecast 2025-2030 ($ million)
Chart on Sintered magnets - Year-over-year growth 2025-2030 (%)
Data Table on Sintered magnets - Year-over-year growth 2025-2030 (%)

10.4 Bonded magnets - Market size and forecast 2025-2030

Chart on Bonded magnets - Market size and forecast 2025-2030 ($ million)
Data Table on Bonded magnets - Market size and forecast 2025-2030 ($ million)
Chart on Bonded magnets - Year-over-year growth 2025-2030 (%)
Data Table on Bonded magnets - Year-over-year growth 2025-2030 (%)

10.5 Injection molded magnets - Market size and forecast 2025-2030

Chart on Injection molded magnets - Market size and forecast 2025-2030 ($ million)
Data Table on Injection molded magnets - Market size and forecast 2025-2030 ($ million)
Chart on Injection molded magnets - Year-over-year growth 2025-2030 (%)
Data Table on Injection molded magnets - Year-over-year growth 2025-2030 (%)

10.6 Hot-pressed magnets - Market size and forecast 2025-2030

Chart on Hot-pressed magnets - Market size and forecast 2025-2030 ($ million)
Data Table on Hot-pressed magnets - Market size and forecast 2025-2030 ($ million)
Chart on Hot-pressed magnets - Year-over-year growth 2025-2030 (%)
Data Table on Hot-pressed magnets - Year-over-year growth 2025-2030 (%)

10.7 Market opportunity by Method

Market opportunity by Method ($ million)
Data Table on Market opportunity by Method ($ million)

11. Customer Landscape

11.1 Customer landscape overview

Analysis of price sensitivity, lifecycle, customer purchase basket, adoption rates, and purchase criteria

12. Geographic Landscape

12.1 Geographic segmentation

Chart on Market share by geography 2025-2030 (%)
Data Table on Market share by geography 2025-2030 (%)

12.2 Geographic comparison

Chart on Geographic comparison
Data Table on Geographic comparison

12.3 APAC - Market size and forecast 2025-2030

Chart on APAC - Market size and forecast 2025-2030 ($ million)
Data Table on APAC - Market size and forecast 2025-2030 ($ million)
Chart on APAC - Year-over-year growth 2025-2030 (%)
Data Table on APAC - Year-over-year growth 2025-2030 (%)
Chart on Regional Comparison - APAC
Data Table on Regional Comparison - APAC

12.3.1 China - Market size and forecast 2025-2030

Chart on China - Market size and forecast 2025-2030 ($ million)
Data Table on China - Market size and forecast 2025-2030 ($ million)
Chart on China - Year-over-year growth 2025-2030 (%)
Data Table on China - Year-over-year growth 2025-2030 (%)

12.3.2 Japan - Market size and forecast 2025-2030

Chart on Japan - Market size and forecast 2025-2030 ($ million)
Data Table on Japan - Market size and forecast 2025-2030 ($ million)
Chart on Japan - Year-over-year growth 2025-2030 (%)
Data Table on Japan - Year-over-year growth 2025-2030 (%)

12.3.3 India - Market size and forecast 2025-2030

Chart on India - Market size and forecast 2025-2030 ($ million)
Data Table on India - Market size and forecast 2025-2030 ($ million)
Chart on India - Year-over-year growth 2025-2030 (%)
Data Table on India - Year-over-year growth 2025-2030 (%)

12.3.4 South Korea - Market size and forecast 2025-2030

Chart on South Korea - Market size and forecast 2025-2030 ($ million)
Data Table on South Korea - Market size and forecast 2025-2030 ($ million)
Chart on South Korea - Year-over-year growth 2025-2030 (%)
Data Table on South Korea - Year-over-year growth 2025-2030 (%)

12.3.5 Australia - Market size and forecast 2025-2030

Chart on Australia - Market size and forecast 2025-2030 ($ million)
Data Table on Australia - Market size and forecast 2025-2030 ($ million)
Chart on Australia - Year-over-year growth 2025-2030 (%)
Data Table on Australia - Year-over-year growth 2025-2030 (%)

12.3.6 Indonesia - Market size and forecast 2025-2030

Chart on Indonesia - Market size and forecast 2025-2030 ($ million)
Data Table on Indonesia - Market size and forecast 2025-2030 ($ million)
Chart on Indonesia - Year-over-year growth 2025-2030 (%)
Data Table on Indonesia - Year-over-year growth 2025-2030 (%)

12.4 North America - Market size and forecast 2025-2030

Chart on North America - Market size and forecast 2025-2030 ($ million)
Data Table on North America - Market size and forecast 2025-2030 ($ million)
Chart on North America - Year-over-year growth 2025-2030 (%)
Data Table on North America - Year-over-year growth 2025-2030 (%)
Chart on Regional Comparison - North America
Data Table on Regional Comparison - North America

12.4.1 US - Market size and forecast 2025-2030

Chart on US - Market size and forecast 2025-2030 ($ million)
Data Table on US - Market size and forecast 2025-2030 ($ million)
Chart on US - Year-over-year growth 2025-2030 (%)
Data Table on US - Year-over-year growth 2025-2030 (%)

12.4.2 Canada - Market size and forecast 2025-2030

Chart on Canada - Market size and forecast 2025-2030 ($ million)
Data Table on Canada - Market size and forecast 2025-2030 ($ million)
Chart on Canada - Year-over-year growth 2025-2030 (%)
Data Table on Canada - Year-over-year growth 2025-2030 (%)

12.4.3 Mexico - Market size and forecast 2025-2030

Chart on Mexico - Market size and forecast 2025-2030 ($ million)
Data Table on Mexico - Market size and forecast 2025-2030 ($ million)
Chart on Mexico - Year-over-year growth 2025-2030 (%)
Data Table on Mexico - Year-over-year growth 2025-2030 (%)

12.5 Europe - Market size and forecast 2025-2030

Chart on Europe - Market size and forecast 2025-2030 ($ million)
Data Table on Europe - Market size and forecast 2025-2030 ($ million)
Chart on Europe - Year-over-year growth 2025-2030 (%)
Data Table on Europe - Year-over-year growth 2025-2030 (%)
Chart on Regional Comparison - Europe
Data Table on Regional Comparison - Europe

12.5.1 Germany - Market size and forecast 2025-2030

Chart on Germany - Market size and forecast 2025-2030 ($ million)
Data Table on Germany - Market size and forecast 2025-2030 ($ million)
Chart on Germany - Year-over-year growth 2025-2030 (%)
Data Table on Germany - Year-over-year growth 2025-2030 (%)

12.5.2 France - Market size and forecast 2025-2030

Chart on France - Market size and forecast 2025-2030 ($ million)
Data Table on France - Market size and forecast 2025-2030 ($ million)
Chart on France - Year-over-year growth 2025-2030 (%)
Data Table on France - Year-over-year growth 2025-2030 (%)

12.5.3 UK - Market size and forecast 2025-2030

Chart on UK - Market size and forecast 2025-2030 ($ million)
Data Table on UK - Market size and forecast 2025-2030 ($ million)
Chart on UK - Year-over-year growth 2025-2030 (%)
Data Table on UK - Year-over-year growth 2025-2030 (%)

12.5.4 Italy - Market size and forecast 2025-2030

Chart on Italy - Market size and forecast 2025-2030 ($ million)
Data Table on Italy - Market size and forecast 2025-2030 ($ million)
Chart on Italy - Year-over-year growth 2025-2030 (%)
Data Table on Italy - Year-over-year growth 2025-2030 (%)

12.5.5 Spain - Market size and forecast 2025-2030

Chart on Spain - Market size and forecast 2025-2030 ($ million)
Data Table on Spain - Market size and forecast 2025-2030 ($ million)
Chart on Spain - Year-over-year growth 2025-2030 (%)
Data Table on Spain - Year-over-year growth 2025-2030 (%)

12.5.6 The Netherlands - Market size and forecast 2025-2030

Chart on The Netherlands - Market size and forecast 2025-2030 ($ million)
Data Table on The Netherlands - Market size and forecast 2025-2030 ($ million)
Chart on The Netherlands - Year-over-year growth 2025-2030 (%)
Data Table on The Netherlands - Year-over-year growth 2025-2030 (%)

12.6 South America - Market size and forecast 2025-2030

Chart on South America - Market size and forecast 2025-2030 ($ million)
Data Table on South America - Market size and forecast 2025-2030 ($ million)
Chart on South America - Year-over-year growth 2025-2030 (%)
Data Table on South America - Year-over-year growth 2025-2030 (%)
Chart on Regional Comparison - South America
Data Table on Regional Comparison - South America

12.6.1 Brazil - Market size and forecast 2025-2030

Chart on Brazil - Market size and forecast 2025-2030 ($ million)
Data Table on Brazil - Market size and forecast 2025-2030 ($ million)
Chart on Brazil - Year-over-year growth 2025-2030 (%)
Data Table on Brazil - Year-over-year growth 2025-2030 (%)

12.6.2 Argentina - Market size and forecast 2025-2030

Chart on Argentina - Market size and forecast 2025-2030 ($ million)
Data Table on Argentina - Market size and forecast 2025-2030 ($ million)
Chart on Argentina - Year-over-year growth 2025-2030 (%)
Data Table on Argentina - Year-over-year growth 2025-2030 (%)

12.6.3 Chile - Market size and forecast 2025-2030

Chart on Chile - Market size and forecast 2025-2030 ($ million)
Data Table on Chile - Market size and forecast 2025-2030 ($ million)
Chart on Chile - Year-over-year growth 2025-2030 (%)
Data Table on Chile - Year-over-year growth 2025-2030 (%)

12.7 Middle East and Africa - Market size and forecast 2025-2030

Chart on Middle East and Africa - Market size and forecast 2025-2030 ($ million)
Data Table on Middle East and Africa - Market size and forecast 2025-2030 ($ million)
Chart on Middle East and Africa - Year-over-year growth 2025-2030 (%)
Data Table on Middle East and Africa - Year-over-year growth 2025-2030 (%)
Chart on Regional Comparison - Middle East and Africa
Data Table on Regional Comparison - Middle East and Africa

12.7.1 Saudi Arabia - Market size and forecast 2025-2030

Chart on Saudi Arabia - Market size and forecast 2025-2030 ($ million)
Data Table on Saudi Arabia - Market size and forecast 2025-2030 ($ million)
Chart on Saudi Arabia - Year-over-year growth 2025-2030 (%)
Data Table on Saudi Arabia - Year-over-year growth 2025-2030 (%)

12.7.2 UAE - Market size and forecast 2025-2030

Chart on UAE - Market size and forecast 2025-2030 ($ million)
Data Table on UAE - Market size and forecast 2025-2030 ($ million)
Chart on UAE - Year-over-year growth 2025-2030 (%)
Data Table on UAE - Year-over-year growth 2025-2030 (%)

12.7.3 South Africa - Market size and forecast 2025-2030

Chart on South Africa - Market size and forecast 2025-2030 ($ million)
Data Table on South Africa - Market size and forecast 2025-2030 ($ million)
Chart on South Africa - Year-over-year growth 2025-2030 (%)
Data Table on South Africa - Year-over-year growth 2025-2030 (%)

12.7.4 Turkey - Market size and forecast 2025-2030

Chart on Turkey - Market size and forecast 2025-2030 ($ million)
Data Table on Turkey - Market size and forecast 2025-2030 ($ million)
Chart on Turkey - Year-over-year growth 2025-2030 (%)
Data Table on Turkey - Year-over-year growth 2025-2030 (%)

12.7.5 Israel - Market size and forecast 2025-2030

Chart on Israel - Market size and forecast 2025-2030 ($ million)
Data Table on Israel - Market size and forecast 2025-2030 ($ million)
Chart on Israel - Year-over-year growth 2025-2030 (%)
Data Table on Israel - Year-over-year growth 2025-2030 (%)

12.8 Market opportunity by geography

Market opportunity by geography ($ million)
Data Tables on Market opportunity by geography ($ million)

13. Drivers, Challenges, and Opportunity

13.1 Market drivers

Acceleration of global electric vehicle propulsion systems
Proliferation of renewable energy and offshore wind infrastructure
Expansion of industrial automation and precision robotics

13.2 Market challenges

Geopolitical supply chain concentration and raw material vulnerability
Regulatory compliance and environmental sustainability mandates
Technological substitution and search for rare earth free alternatives

13.3 Impact of drivers and challenges

Impact of drivers and challenges in 2025 and 2030

13.4 Market opportunities

Strategic shift toward circular economy and magnet recycling
Regionalization of supply chains and indigenous production initiatives
Technological advancements in material science and rare earth free innovation

14. Competitive Landscape

14.1 Overview

14.2

Overview on criticality of inputs and factors of differentiation

14.3 Landscape disruption

Overview on factors of disruption

14.4 Industry risks

Impact of key risks on business

15. Competitive Analysis

15.1 Companies profiled

Companies covered

15.2 Company ranking index

15.3 Market positioning of companies

Matrix on companies position and classification

15.4 Adams Magnetic Products Co.

Adams Magnetic Products Co. - Overview
Adams Magnetic Products Co. - Product / Service
Adams Magnetic Products Co. - Key offerings
SWOT

15.5 Arnold Magnetic Technologies

Arnold Magnetic Technologies - Overview
Arnold Magnetic Technologies - Product / Service
Arnold Magnetic Technologies - Key offerings
SWOT

15.6 Bunting Magnetics Co.

Bunting Magnetics Co. - Overview
Bunting Magnetics Co. - Product / Service
Bunting Magnetics Co. - Key offerings
SWOT

15.7 Daido Electronics Co. Ltd.

Daido Electronics Co. Ltd. - Overview
Daido Electronics Co. Ltd. - Product / Service
Daido Electronics Co. Ltd. - Key offerings
SWOT

15.8 Electron Energy Corp.

Electron Energy Corp. - Overview
Electron Energy Corp. - Product / Service
Electron Energy Corp. - Key offerings
SWOT

15.9 Galaxy Magnetic Co. Ltd.

Galaxy Magnetic Co. Ltd. - Overview
Galaxy Magnetic Co. Ltd. - Product / Service
Galaxy Magnetic Co. Ltd. - Key offerings
SWOT

15.10 Goudsmit Magnetics Groep B.V.

Goudsmit Magnetics Groep B.V. - Overview
Goudsmit Magnetics Groep B.V. - Product / Service
Goudsmit Magnetics Groep B.V. - Key offerings
SWOT

15.11 Hengdian Magnetics Co. Ltd.

Hengdian Magnetics Co. Ltd. - Overview
Hengdian Magnetics Co. Ltd. - Business segments
Hengdian Magnetics Co. Ltd. - Key offerings
Hengdian Magnetics Co. Ltd. - Segment focus
SWOT

15.12 MP Materials Corp.

MP Materials Corp. - Overview
MP Materials Corp. - Product / Service
MP Materials Corp. - Key offerings
SWOT

15.13 Neo Performance Materials Inc.

Neo Performance Materials Inc. - Overview
Neo Performance Materials Inc. - Business segments
Neo Performance Materials Inc. - Key offerings
Neo Performance Materials Inc. - Segment focus
SWOT

15.14 Ningbo Yunsheng Co. Ltd.

Ningbo Yunsheng Co. Ltd. - Overview
Ningbo Yunsheng Co. Ltd. - Business segments
Ningbo Yunsheng Co. Ltd. - Key offerings
Ningbo Yunsheng Co. Ltd. - Segment focus
SWOT

15.15 Proterial Ltd.

Proterial Ltd. - Overview
Proterial Ltd. - Product / Service
Proterial Ltd. - Key offerings
SWOT

15.16 Shin Etsu Chemical Co. Ltd.

Shin Etsu Chemical Co. Ltd. - Overview
Shin Etsu Chemical Co. Ltd. - Business segments
Shin Etsu Chemical Co. Ltd. - Key offerings
Shin Etsu Chemical Co. Ltd. - Segment focus
SWOT

15.17 TDK Corp.

TDK Corp. - Overview
TDK Corp. - Business segments
TDK Corp. - Key offerings
TDK Corp. - Segment focus
SWOT

15.18 Vacuumschmelze GmbH and Co. KG

Vacuumschmelze GmbH and Co. KG - Overview
Vacuumschmelze GmbH and Co. KG - Product / Service
Vacuumschmelze GmbH and Co. KG - Key offerings
SWOT

16. Appendix

16.1 Scope of the report

Market definition
Objectives
Notes and caveats

16.2 Inclusions and exclusions checklist

Inclusions checklist
Exclusions checklist

16.3 Currency conversion rates for US$

16.4 Research methodology

16.5 Data procurement

Information sources

16.6 Data validation

16.7 Validation techniques employed for market sizing

16.8 Data synthesis

16.9 360 degree market analysis

16.10 List of abbreviations

Research Methodology

Technavio presents a detailed picture of the market by way of study, synthesis, and summation of data from multiple sources. The analysts have presented the various facets of the market with a particular focus on identifying the key industry influencers. The data thus presented is comprehensive, reliable, and the result of extensive research, both primary and secondary.

INFORMATION SOURCES

Primary sources

  • Manufacturers and suppliers
  • Channel partners
  • Industry experts
  • Strategic decision makers

Secondary sources

  • Industry journals and periodicals
  • Government data
  • Financial reports of key industry players
  • Historical data
  • Press releases

DATA ANALYSIS

Data Synthesis

  • Collation of data
  • Estimation of key figures
  • Analysis of derived insights

Data Validation

  • Triangulation with data models
  • Reference against proprietary databases
  • Corroboration with industry experts

REPORT WRITING

Qualitative

  • Market drivers
  • Market challenges
  • Market trends
  • Five forces analysis

Quantitative

  • Market size and forecast
  • Market segmentation
  • Geographical insights
  • Competitive landscape

Interested in this report?

Get your sample now to see our research methodology and insights!

Download Now

Frequently Asked Questions

Permanent Magnets market growth will increase by USD 20353.3 million during 2026-2030.

The Permanent Magnets market is expected to grow at a CAGR of 9.1% during 2026-2030.

Permanent Magnets market is segmented by Material (NdFeB magnets, Ferrite magnets, Samarium cobalt magnets, Alnico magnets) End-user (Consumer goods and electronics, Automotive, General industrial, Aerospace and defense, Others) Method (Sintered magnets, Bonded magnets, Injection molded magnets, Hot-pressed magnets)

Adams Magnetic Products Co., Arnold Magnetic Technologies, Bunting Magnetics Co., Daido Electronics Co. Ltd., Dura Magnetics Inc., Earth Panda Magnet GmbH, Electron Energy Corp., Galaxy Magnetic Co. Ltd., Goudsmit Magnetics Groep B.V., Hengdian Magnetics Co. Ltd., MP Materials Corp., Neo Performance Materials Inc., Ningbo Yunsheng Co. Ltd., Proterial Ltd., Shin Etsu Chemical Co. Ltd., Sinomag Technology Co. Ltd., TDK Corp., Tokyo Ferrite Mfg. Co. Ltd., Vacuumschmelze GmbH and Co. KG are a few of the key vendors in the Permanent Magnets market.

APAC will register the highest growth rate of 60.1% among the other regions. Therefore, the Permanent Magnets market in APAC is expected to garner significant business opportunities for the vendors during the forecast period.

China, Japan, India, South Korea, Australia, Indonesia, US, Canada, Mexico, Germany, France, UK, Italy, Spain, The Netherlands, Brazil, Argentina, Chile, Saudi Arabia, UAE, South Africa, Turkey, Israel

  • Acceleration of global electric vehicle propulsion systems is the driving factor this market.

The Permanent Magnets market vendors should focus on grabbing business opportunities from the Material segment as it accounted for the largest market share in the base year.
RIA - Research AI Assistant
Ask RIA