
Pharmaceuticals Wholesale And Distribution Market Size 2026-2030
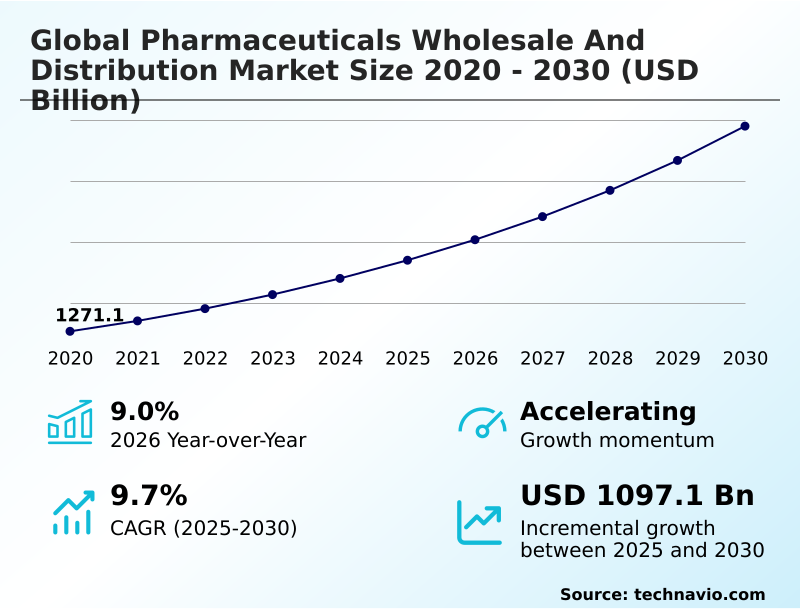
The pharmaceuticals wholesale and distribution market size is valued to increase by USD 1097.1 billion, at a CAGR of 9.7% from 2025 to 2030. Rising prevalence of chronic diseases will drive the pharmaceuticals wholesale and distribution market.
Major Market Trends & Insights
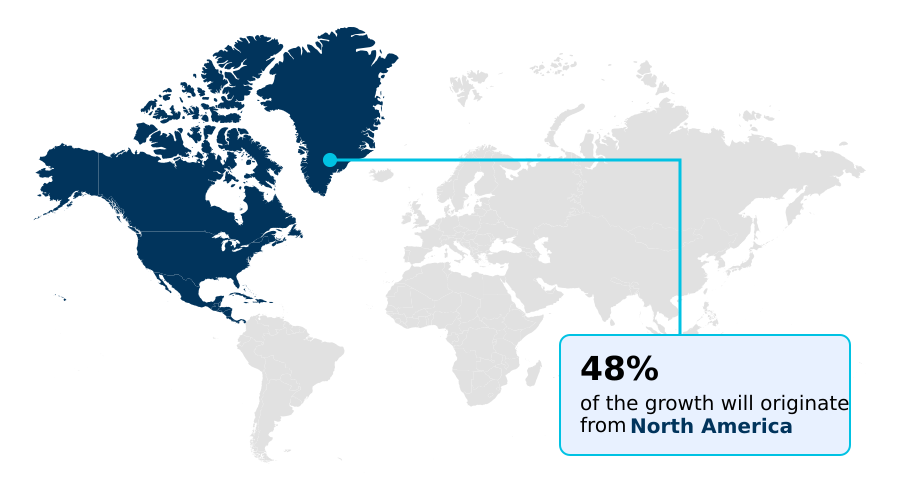
- North America dominated the market and accounted for a 47.5% growth during the forecast period.
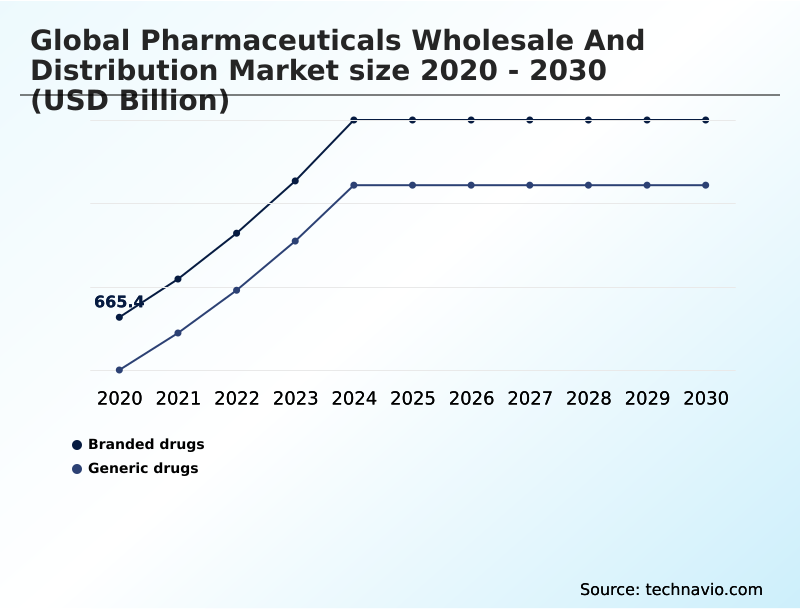
- By Type - Branded drugs segment was valued at USD 888.8 billion in 2024
- By End-user - Retail pharmacies segment accounted for the largest market revenue share in 2024
Market Size & Forecast
- Market Opportunities: USD 1678.7 billion
- Market Future Opportunities: USD 1097.1 billion
- CAGR from 2025 to 2030 : 9.7%
Market Summary
- The pharmaceuticals wholesale and distribution market operates as the critical intermediary in the global healthcare ecosystem, ensuring the safe and timely delivery of medications. Market dynamics are shaped by the dual pressures of rising chronic disease prevalence and an aging global population, which collectively drive sustained demand for both branded and generic drugs.
- A key trend is the integration of digital technologies, where AI in pharmaceutical forecasting and pharmaceutical warehousing automation are enhancing inventory optimization systems. For instance, distributors are leveraging predictive analytics to manage cold chain management for biologics, reducing spoilage by up to 20% and ensuring compliance with good distribution practices (GDP).
- However, the industry grapples with significant challenges, including persistent drug shortages and increasing regulatory compliance in distribution, which require robust supply chain resilience planning. Geopolitical disruptions further complicate drug procurement and sourcing, compelling firms to adopt resilient pharma supply chain strategies and diversify their networks to mitigate risk and maintain the continuous flow of essential medicines to patients.
What will be the Size of the Pharmaceuticals Wholesale And Distribution Market during the forecast period?
Get Key Insights on Market Forecast (PDF) Get Free Sample
How is the Pharmaceuticals Wholesale And Distribution Market Segmented?
The pharmaceuticals wholesale and distribution industry research report provides comprehensive data (region-wise segment analysis), with forecasts and estimates in "USD billion" for the period 2026-2030, as well as historical data from 2020-2024 for the following segments.
- Type
- Branded drugs
- Generic drugs
- End-user
- Retail pharmacies
- Hospital pharmacies
- Others
- Service
- Warehousing and storage
- Cold chain logistics
- Direct-to-pharmacy (DTP) distribution
- Specialty drug distribution
- Geography
- North America
- US
- Canada
- Mexico
- Asia
- Europe
- Germany
- France
- UK
- Rest of World (ROW)
- North America
By Type Insights
The branded drugs segment is estimated to witness significant growth during the forecast period.
The branded drugs segment is characterized by complex logistical requirements and high-value product flows, necessitating advanced inventory optimization systems. These systems have demonstrated the ability to improve forecast accuracy by over 15%, which is critical for high-cost biologics.
Distribution strategies are evolving, with an increase in direct-to-pharmacy (DTP) models and specialized DTP distribution networks designed to maintain brand integrity and control.
Furthermore, sophisticated pharmacy benefit management (PBM) and PBM integration with distribution are essential for managing market access and reimbursement.
Wholesalers are also expanding services to include pharmaceutical repackaging services and support for medication adherence programs, offering unit-dose packaging services to enhance patient safety and compliance in this segment.
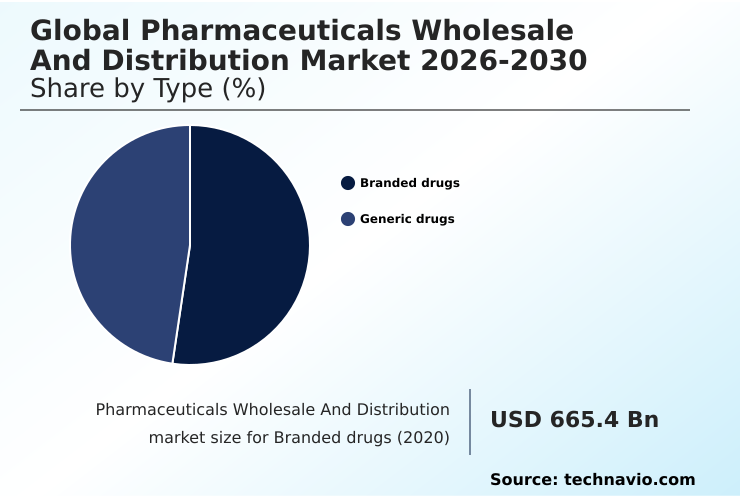
The Branded drugs segment was valued at USD 888.8 billion in 2024 and showed a gradual increase during the forecast period.
Regional Analysis
North America is estimated to contribute 47.5% to the growth of the global market during the forecast period.Technavio’s analysts have elaborately explained the regional trends and drivers that shape the market during the forecast period.
See How Pharmaceuticals Wholesale And Distribution Market Demand is Rising in North America Get Free Sample
North America is poised to contribute nearly 48% of the market's incremental growth, driven by its highly developed infrastructure for drug distribution logistics and pharmaceutical supply chain management.
While Europe shows a strong growth trajectory with a regional rate of 10.4%, North America's established network of wholesale drug distributor services and high adoption of third-party logistics (3PL) for pharma give it a competitive edge.
Companies in the region leverage sophisticated supply chain visibility platforms and outsourced pharmaceutical logistics to manage complex drug procurement and sourcing. GPO pharmaceutical contracts and PBM integration with distribution are deeply embedded, creating a mature ecosystem.
In contrast, emerging regions are focused on building foundational capabilities to support expanding healthcare access.
Market Dynamics
Our researchers analyzed the data with 2025 as the base year, along with the key drivers, trends, and challenges. A holistic analysis of drivers will help companies refine their marketing strategies to gain a competitive advantage.
- A strategic focus on improving pharmaceutical supply chain efficiency is paramount for stakeholders in the pharmaceuticals wholesale and distribution market. This involves addressing multifaceted issues, from the technical challenges in biologics distribution to managing persistent drug shortages through better forecasting and sourcing.
- The role of AI in drug distribution is becoming central to this effort, enabling more agile responses to market dynamics. For instance, implementing blockchain for drug traceability has been shown to reduce verification times by over 50% compared to manual processes, a crucial step in meeting stringent supply chain traceability regulations.
- This technological leap also aids in reducing medication distribution errors. As the industry evolves, the specialty drug distribution network design must be refined to support complex supply chain strategies for oncology drugs and other advanced therapies. At the same time, maintaining cost-effective generic drug distribution remains vital for healthcare accessibility.
- Navigating geopolitical trade disruptions and regulatory hurdles in cross-border distribution requires robust contingency planning. Companies are also optimizing last-mile delivery for pharmacies and enhancing GDP compliance for warehouse storage. This is particularly important for wholesale distribution for retail pharmacies and third-party logistics for hospital pharmacies.
- The impact of an aging population on pharma logistics, coupled with a push for sustainable practices in pharma logistics and new logistics for direct-to-patient fulfillment, is reshaping the entire value chain.
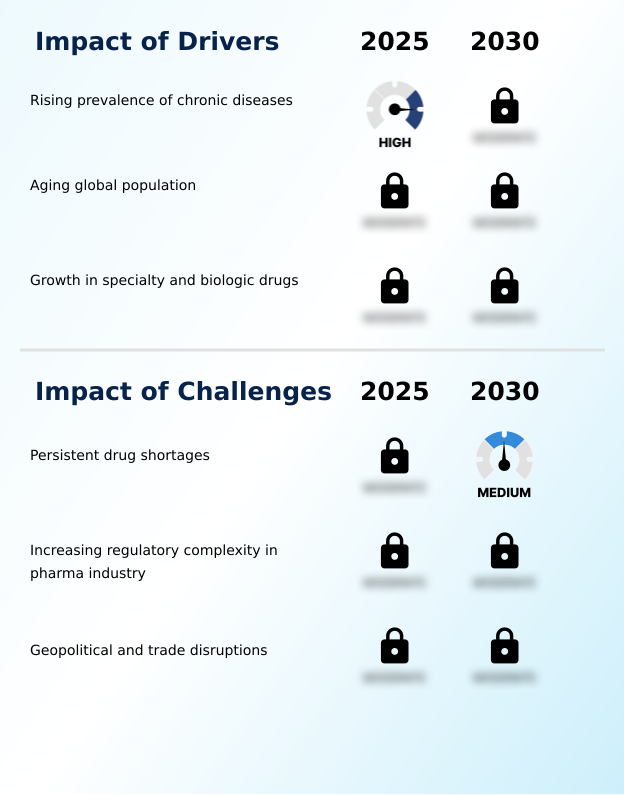
What are the key market drivers leading to the rise in the adoption of Pharmaceuticals Wholesale And Distribution Industry?
- The rising prevalence of chronic diseases is a primary driver for the market, necessitating a continuous and robust supply of medications.
- The expanding portfolio of high-value therapies is a significant market driver, with specialty drug distribution now accounting for an increased share of revenue, reflecting a 12% rise in sales.
- This growth necessitates advanced cold chain management for biologics and specialized clinical trial logistics. As healthcare shifts toward preventative and personalized care, distribution models for cell and gene therapy and enhanced patient support program logistics are becoming critical.
- This is reflected in the 10.4% increase in overall distributor sales, largely driven by these specialty pharmaceutical logistics.
- Distributors are increasingly involved in value-based care distribution support and medication adherence programs, leveraging sophisticated clinical supply chain services to meet complex biologic drug handling requirements and improve patient outcomes.
What are the market trends shaping the Pharmaceuticals Wholesale And Distribution Industry?
- The adoption of digital technologies and artificial intelligence is an emerging trend shaping the market. These innovations enhance operational efficiency and supply chain visibility.
- The focus on enhancing supply chain visibility platforms is a defining market trend, with over 85% of executives planning significant digital investments to build resiliency. The adoption of pharmaceutical warehousing automation and AI in pharmaceutical forecasting is central to this shift, improving inventory turnover by up to 15%.
- Innovations in last-mile pharmaceutical delivery, including pilot programs for drone delivery for pharmaceuticals, are reducing transit times in critical scenarios. Moreover, robust drug traceability and serialization, mandated partly by the drug supply chain security act (DSCSA), are becoming standard.
- These technologies, from automated pharmaceutical warehousing to real-time supply chain tracking, are crucial for creating resilient pharma supply chain strategies that can better manage demand forecasting for medicines and mitigate disruptions.
What challenges does the Pharmaceuticals Wholesale And Distribution Industry face during its growth?
- Persistent drug shortages remain a significant challenge for the industry, disrupting the steady flow of essential medications to healthcare providers and patients.
- Navigating complex regulatory frameworks remains a primary challenge, with manufacturing quality issues contributing to approximately 60% of persistent drug shortages. This environment demands stringent good distribution practices (GDP) and heightened regulatory compliance in distribution.
- Companies are investing in systems for secure logistics for controlled drugs and effective reverse logistics for pharmaceuticals to manage returns, which can represent up to 3% of total sales. Furthermore, with over 50% of drugs sourced internationally, reliance on a global supply chain makes drug procurement and sourcing vulnerable to disruptions.
- Adherence to pharmaceutical distribution regulations and having GDP compliant logistics providers are non-negotiable, forcing firms to build resilient pharma supply chain strategies to ensure continuity in controlled substance handling and pharmaceutical product return management.
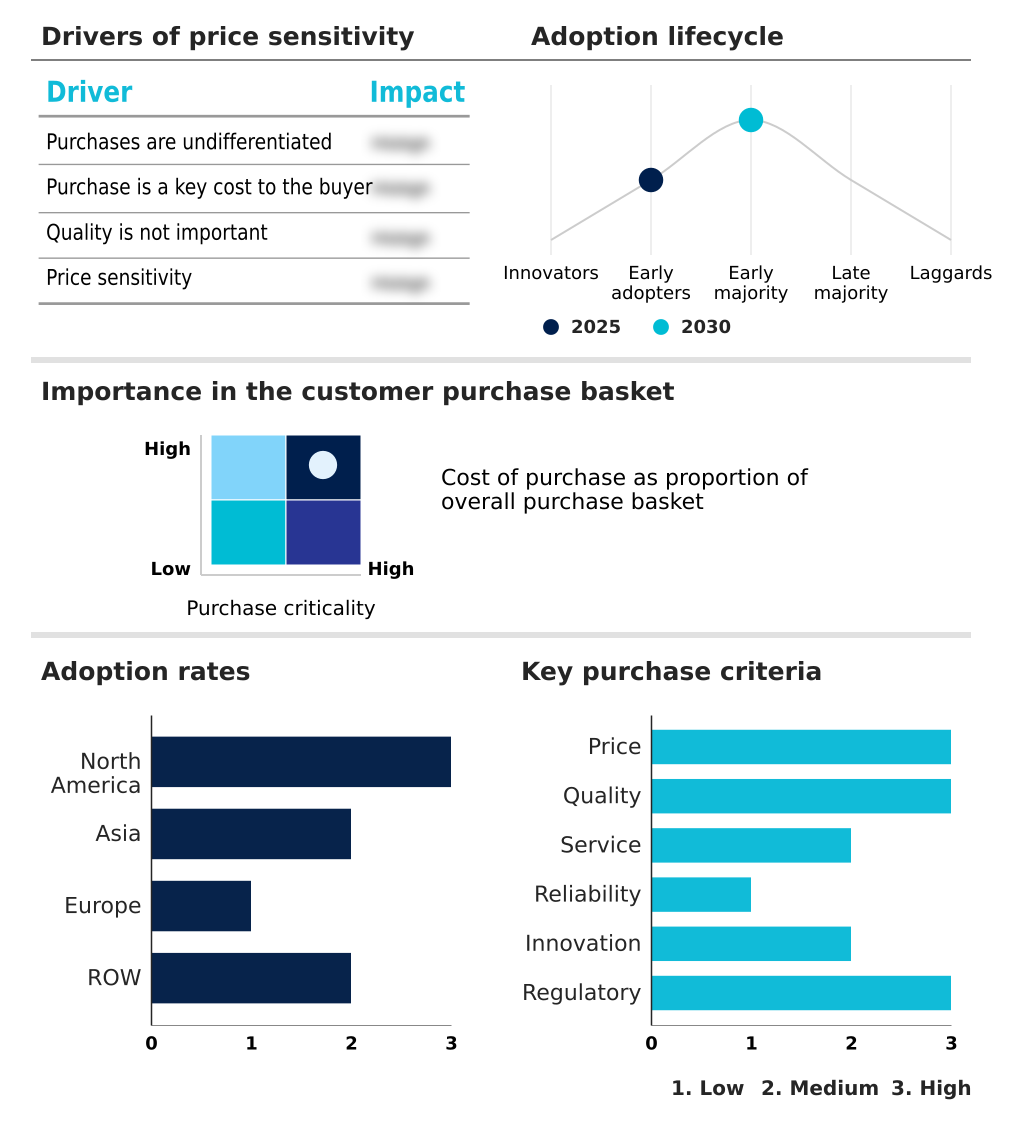
Exclusive Technavio Analysis on Customer Landscape
The pharmaceuticals wholesale and distribution market forecasting report includes the adoption lifecycle of the market, covering from the innovator’s stage to the laggard’s stage. It focuses on adoption rates in different regions based on penetration. Furthermore, the pharmaceuticals wholesale and distribution market report also includes key purchase criteria and drivers of price sensitivity to help companies evaluate and develop their market growth analysis strategies.
Customer Landscape of Pharmaceuticals Wholesale And Distribution Industry
Competitive Landscape
Companies are implementing various strategies, such as strategic alliances, pharmaceuticals wholesale and distribution market forecast, partnerships, mergers and acquisitions, geographical expansion, and product/service launches, to enhance their presence in the industry.
Alfresa Holdings Corp. - Provides nationwide pharmaceuticals wholesale and distribution with a focus on supply chain efficiency, regulatory compliance, and quality control for prescription drugs and medical devices.
The industry research and growth report includes detailed analyses of the competitive landscape of the market and information about key companies, including:
- Alfresa Holdings Corp.
- Alliance Healthcare
- Cardinal Health Inc.
- Cencora Inc.
- Dakota Drug Inc.
- FFF Enterprises Inc.
- Hauser Pharmaceutical Inc.
- J M Smith Corp.
- McKesson Corp.
- Medipal Holdings Corp.
- Medline Inc.
- Morris and Dickson Co. LLC
- Mutual Drug
- Owens and Minor Inc.
- PHOENIX Pharma SE
- Shanghai Fosun Pharmaceutical
- Suzuken Co. Ltd.
- The Cigna Group
Qualitative and quantitative analysis of companies has been conducted to help clients understand the wider business environment as well as the strengths and weaknesses of key industry players. Data is qualitatively analyzed to categorize companies as pure play, category-focused, industry-focused, and diversified; it is quantitatively analyzed to categorize companies as dominant, leading, strong, tentative, and weak.
Recent Development and News in Pharmaceuticals wholesale and distribution market
- In September 2024, Hurricane Helene disrupted IV fluid production at a key facility in North Carolina, impacting hospital supplies and highlighting supply chain weather-related vulnerabilities.
- In December 2024, Cardinal Health finalized its acquisition of Integrated Oncology Network for $1.1 billion, incorporating the network into its Navista oncology alliance to support community practices.
- In February 2025, McKesson Corp. expanded its partnership with Microsoft to implement Azure and AI solutions for inventory management, enhancing forecasting accuracy and operational efficiency.
- In March 2025, hearings in the United States Congress examined pharmaceutical supply chain fragility, highlighting reliance on foreign sources and the need for stronger regulatory oversight.
Dive into Technavio’s robust research methodology, blending expert interviews, extensive data synthesis, and validated models for unparalleled Pharmaceuticals Wholesale And Distribution Market insights. See full methodology.
| Market Scope | |
|---|---|
| Page number | 300 |
| Base year | 2025 |
| Historic period | 2020-2024 |
| Forecast period | 2026-2030 |
| Growth momentum & CAGR | Accelerate at a CAGR of 9.7% |
| Market growth 2026-2030 | USD 1097.1 billion |
| Market structure | Fragmented |
| YoY growth 2025-2026(%) | 9.0% |
| Key countries | US, Canada, Mexico, China, Japan, India, South Korea, Indonesia, Thailand, Germany, France, UK, Italy, Spain, The Netherlands, Brazil, Turkey, Saudi Arabia, South Africa, UAE, Argentina, Colombia and Israel |
| Competitive landscape | Leading Companies, Market Positioning of Companies, Competitive Strategies, and Industry Risks |
Research Analyst Overview
- The pharmaceuticals wholesale and distribution market is undergoing a structural transformation driven by specialization and technological integration. Core operations are moving beyond basic drug distribution logistics to encompass sophisticated services like specialty drug distribution and value-based care distribution support. The adoption of pharmaceutical warehousing automation is a pivotal trend, with boardroom decisions increasingly favoring capital expenditure on these systems.
- A pilot program demonstrating a 25% reduction in order-picking errors often justifies such investments, aligning with stringent good distribution practices (GDP). This shift is critical for managing complex operations such as cold chain management for biologics and clinical trial logistics. Furthermore, enhanced supply chain visibility platforms and advanced demand forecasting for medicines are becoming standard for effective inventory optimization systems.
- These capabilities are essential for ensuring supply chain resilience planning and maintaining regulatory compliance in distribution across all facets of the operation, from pharmaceutical procurement services to last-mile pharmaceutical delivery.
What are the Key Data Covered in this Pharmaceuticals Wholesale And Distribution Market Research and Growth Report?
-
What is the expected growth of the Pharmaceuticals Wholesale And Distribution Market between 2026 and 2030?
-
USD 1097.1 billion, at a CAGR of 9.7%
-
-
What segmentation does the market report cover?
-
The report is segmented by Type (Branded drugs, and Generic drugs), End-user (Retail pharmacies, Hospital pharmacies, and Others), Service (Warehousing and storage, Cold chain logistics, Direct-to-pharmacy (DTP) distribution, and Specialty drug distribution) and Geography (North America, Asia, Europe, Rest of World (ROW))
-
-
Which regions are analyzed in the report?
-
North America, Asia, Europe and Rest of World (ROW)
-
-
What are the key growth drivers and market challenges?
-
Rising prevalence of chronic diseases, Persistent drug shortages
-
-
Who are the major players in the Pharmaceuticals Wholesale And Distribution Market?
-
Alfresa Holdings Corp., Alliance Healthcare, Cardinal Health Inc., Cencora Inc., Dakota Drug Inc., FFF Enterprises Inc., Hauser Pharmaceutical Inc., J M Smith Corp., McKesson Corp., Medipal Holdings Corp., Medline Inc., Morris and Dickson Co. LLC, Mutual Drug, Owens and Minor Inc., PHOENIX Pharma SE, Shanghai Fosun Pharmaceutical, Suzuken Co. Ltd. and The Cigna Group
-
Market Research Insights
- The market is shaped by a strategic focus on high-value services and operational resilience. The growth in specialty pharmaceutical logistics, which outpaces traditional distribution with a 12% increase in sales, highlights the demand for advanced biologic drug handling requirements and distribution models for cell and gene therapy.
- In response to supply chain vulnerabilities, over 85% of executives are prioritizing investments in resilient pharma supply chain strategies. This involves enhancing wholesale drug distributor services with technology for real-time supply chain tracking and pharmacy supply chain optimization.
- These efforts are critical for navigating complex pharmaceutical distribution regulations and ensuring compliance with frameworks like the drug supply chain security act (DSCSA), ultimately securing the delivery of care.
We can help! Our analysts can customize this pharmaceuticals wholesale and distribution market research report to meet your requirements.
 RIA -
RIA - 
