Phosphate Market Analysis, Size, and Forecast 2026-2030: APAC (China, India, and Indonesia), North America (US, Canada, and Mexico), Europe (Spain, Germany, and France), South America (Brazil and Argentina), Middle East and Africa (Saudi Arabia), and Rest of World (ROW)

Phosphate Market Analysis, Size, and Forecast 2026-2030:
APAC (China, India, and Indonesia), North America (US, Canada, and Mexico), Europe (Spain, Germany, and France), South America (Brazil and Argentina), Middle East and Africa (Saudi Arabia), and Rest of World (ROW)

Published: Dec 2025 304 Pages SKU: IRTNTR72115

Market Overview at a Glance

$10.56 B
Market Opportunity
6.1%
CAGR 2025 - 2030
57.6%
APAC Growth
$21.29 B
Fertilizer segment 2024

Phosphate Market Size 2026-2030

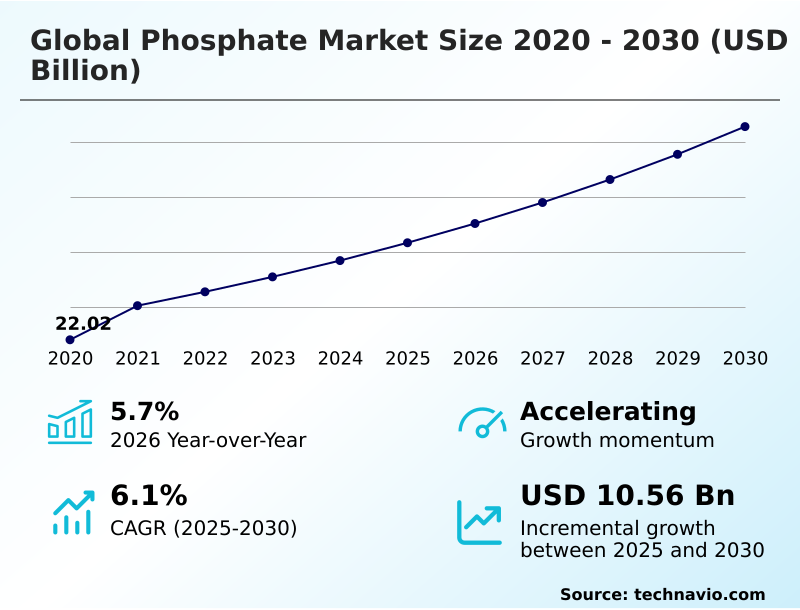
The phosphate market size is valued to increase by USD 10.56 billion, at a CAGR of 6.1% from 2025 to 2030. Growing demand for phosphate fertilizers will drive the phosphate market.

Major Market Trends & Insights

  • APAC dominated the market and accounted for a 57.6% growth during the forecast period.
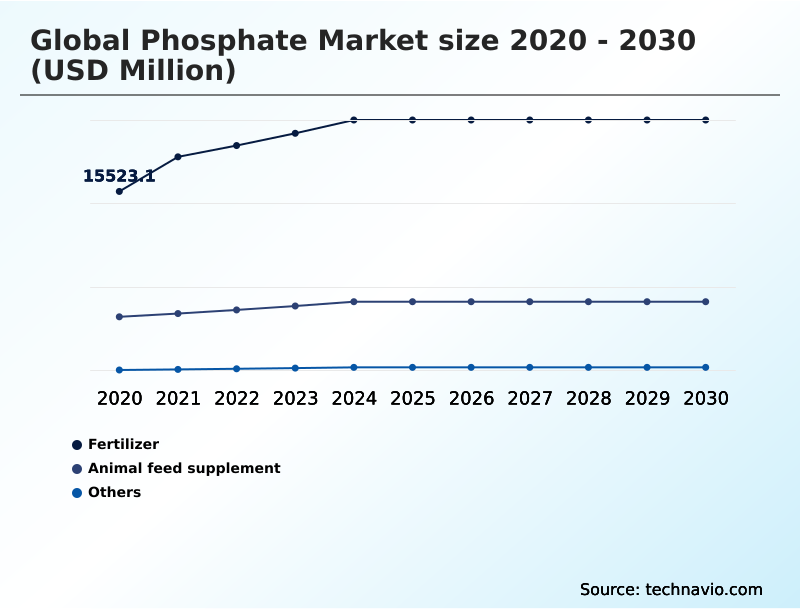
  • By Application - Fertilizer segment was valued at USD 21.29 billion in 2024
  • By Source - Sedimentary deposits segment accounted for the largest market revenue share in 2024

Market Size & Forecast

  • Market Opportunities: USD 19.38 billion
  • Market Future Opportunities: USD 10.56 billion
  • CAGR from 2025 to 2030 : 6.1%

Market Summary

  • The phosphate market is fundamental to global agriculture and increasingly vital for industrial sectors. Its core function remains supporting food production through fertilizers, but its scope is expanding. The industry is navigating complex phosphate market dynamics, influenced by geopolitical factors and the push for sustainable phosphate mining practices. In industrial phosphate applications, the focus is shifting toward high-value products.
  • For instance, a key business scenario involves optimizing the phosphoric acid purification process to meet stringent specifications for electronics or food-grade materials, a far more complex challenge than standard phosphate ore beneficiation for bulk fertilizers. This requires significant capital investment in advanced filtration and treatment technologies.
  • Concurrently, the demand for animal feed supplementation continues to grow with the global livestock industry, requiring feed-grade phosphates free from contaminants. Navigating these divergent demand signals—from bulk agriculture to high-purity industrial use—while addressing environmental concerns and supply chain vulnerabilities defines the strategic landscape for market participants.
  • The ability to pivot between different grades and applications is becoming a critical competitive advantage.

What will be the Size of the Phosphate Market during the forecast period?

Get Key Insights on Market Forecast (PDF) Request Free Sample

How is the Phosphate Market Segmented?

The phosphate industry research report provides comprehensive data (region-wise segment analysis), with forecasts and estimates in "USD million" for the period 2026-2030, as well as historical data from 2020-2024 for the following segments.

  • Application
    • Fertilizer
    • Animal feed supplement
    • Others
  • Source
    • Sedimentary deposits
    • Igneous deposits
    • Marine deposits
  • Product type
    • Diammonium phosphate
    • Monoammonium phosphate
    • Triple superphosphate
    • Single superphosphate
    • Others
  • Geography
    • APAC
      • China
      • India
      • Indonesia
    • North America
      • US
      • Canada
      • Mexico
    • Europe
      • Spain
      • Germany
      • France
    • South America
      • Brazil
      • Argentina
    • Middle East and Africa
      • Saudi Arabia
    • Rest of World (ROW)

By Application Insights

The fertilizer segment is estimated to witness significant growth during the forecast period.

The fertilizer segment is foundational to the phosphate market, driven by the non-negotiable need for agricultural nutrient management to ensure global food security.

Demand for products like diammonium phosphate and monoammonium phosphate is tied directly to crop cycles and the continuous effort for soil fertility enhancement to achieve crop yield improvement.

Phosphate fertilizer production is a complex process, influenced by raw material access and logistics. The market's growth is geographically concentrated, with the APAC region alone representing 57.6% of the incremental growth, underscoring its pivotal role in global agricultural output.

This highlights the segment's deep integration with regional food policies and large-scale farming operations that depend on consistent phosphate supply for sustained productivity.

Request Free Sample

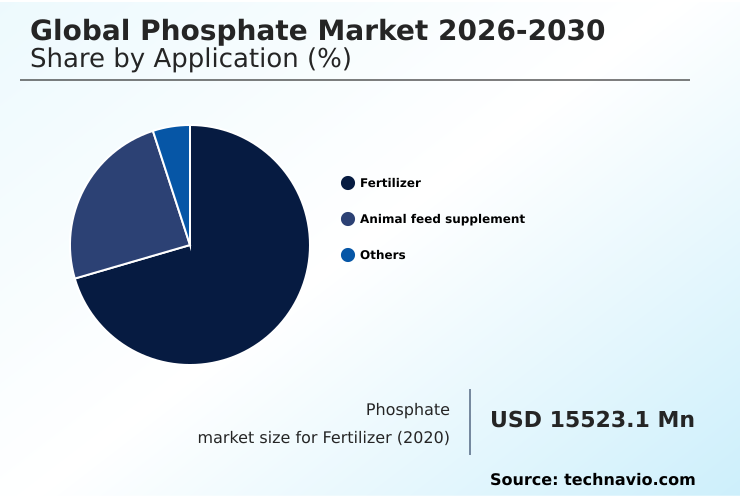
The Fertilizer segment was valued at USD 21.29 billion in 2024 and showed a gradual increase during the forecast period.

Request Free Sample

Regional Analysis

APAC is estimated to contribute 57.6% to the growth of the global market during the forecast period.Technavio’s analysts have elaborately explained the regional trends and drivers that shape the market during the forecast period.

See How Phosphate Market Demand is Rising in APAC Request Free Sample

The geographic landscape is defined by a concentration of phosphate rock reserves in a few key regions, which creates vulnerabilities within the global phosphate supply chain and contributes to fertilizer price fluctuation.

APAC is the dominant growth engine, expanding at a rate of 7.3% and accounting for approximately 57.6% of the market's incremental growth, driven by massive agricultural demand.

North America follows with a more moderate 5.0% growth rate, focusing on high-efficiency agriculture and domestic supply security.

In Europe, the import-dependent market is shaped by regulations like the Critical Raw Materials Act, which prioritizes supply chain diversification and recycling to mitigate geopolitical risks.

This regional disparity in production and consumption underpins global trade flows and strategic investment decisions.

Market Dynamics

Our researchers analyzed the data with 2025 as the base year, along with the key drivers, trends, and challenges. A holistic analysis of drivers will help companies refine their marketing strategies to gain a competitive advantage.

  • The market is undergoing a structural shift, driven by the significant impact of lfp battery demand on phosphate, which pulls high-purity material away from traditional agriculture. This trend is particularly relevant for meeting the needs of low-cadmium phosphate for european markets, where environmental standards are stringent.
  • Simultaneously, the established role of phosphate in animal nutrition continues to grow, although industry faces challenges in managing heavy metal in feed phosphates. The expanding industrial use of phosphate in water treatment corrosion prevention highlights its versatility. Strategic sourcing decisions increasingly weigh sedimentary vs igneous phosphate sourcing, as igneous deposits often offer higher purity.
  • A key trend is converting green phosphoric acid to fertilizer, which supports circular economy goals. In India, nutrient based subsidy effects on ssp use are reshaping domestic demand patterns. Globally, the challenges of marine phosphate deposit mining remain largely unresolved due to ecological concerns, while land-based operations face tightening environmental regulations on phosphogypsum stacks.
  • In response, technology for enhancing nutrient uptake and innovations in phosphate recovery from municipal wastewater are gaining traction. This is partly driven by market impact of phosphate export quotas from major producers. The choice between dap vs map in alkaline soils remains a key agronomic decision, while the specific use of tsp for nitrogen-fixing legume crops demonstrates niche demand.
  • Circular economy models for phosphorus are becoming central to long-term strategy. The phosphate sourcing for industrial chemicals and the role of phosphates in processed foods represent stable, value-added segments, while producers grapple with how to reduce raw material price volatility through strategic hedging and vertical integration.
  • Overall, sustainable practices in phosphate mining are now a non-negotiable aspect of operational planning, with companies investing in cleaner technologies seeing a 15% improvement in their ESG ratings compared to laggards.

What are the key market drivers leading to the rise in the adoption of Phosphate Industry?

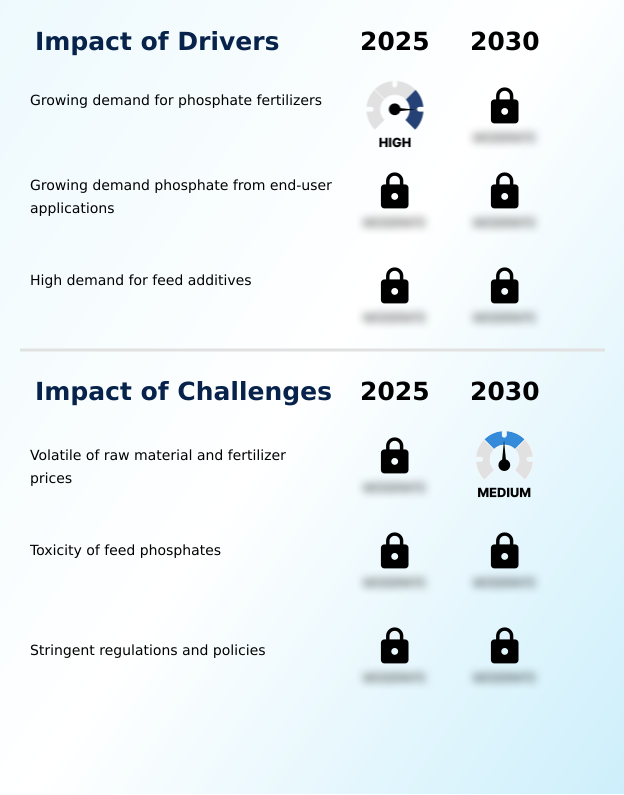
  • The escalating global demand for phosphate fertilizers to enhance agricultural productivity serves as the primary market driver.

  • Market growth is driven by the dual needs of agricultural intensification and industrial diversification. The primary driver remains the need for soil health improvement through effective fertilization, supported by efficient mineral deposit extraction to ensure supply.
  • However, there is a clear shift toward specialty phosphate products designed for high-value crops, which have demonstrated yield increases of 10-15% over conventional fertilizers.
  • Concurrently, environmental regulations are fueling demand for better nutrient runoff management, leading to innovations in liquid fertilizer formulation. These advanced formulations offer up to 95% application uniformity, ensuring precise nutrient delivery while minimizing waste.
  • This drive for efficiency and sustainability is expanding the market beyond traditional applications.

What are the market trends shaping the Phosphate Industry?

  • The increasing production of ammonium phosphate utilizing green phosphoric acid is a notable market trend. This development is creating new opportunities across various end-user applications.

  • Key trends are reshaping product development, moving beyond bulk commodities toward high-efficiency solutions. The focus is on maximizing plant energy transfer and root development stimulation through specialized formulations. The rise of organic farming inputs has spurred innovation in bio-based phosphate fertilizer products, which are shown to improve soil microbial activity by over 25%. These sustainable alternatives address soil degradation concerns.
  • Furthermore, the adoption of precision agriculture nutrients is a major trend, where variable-rate application technologies can reduce phosphate overuse by up to 40%, optimizing farm economics and minimizing environmental runoff. This shift reflects a move from volume to value, where performance and sustainability dictate market preference, especially in regulated agricultural economies.

What challenges does the Phosphate Industry face during its growth?

  • The inherent volatility of raw material and fertilizer prices presents a significant challenge to sustained industry growth.

  • The industry confronts significant hurdles related to supply chain stability and regulatory compliance. Volatile phosphate market dynamics, where geopolitical events can trigger price spikes of over 50% in a quarter, create profound uncertainty for both producers and consumers. The push for sustainable phosphate mining and reducing the environmental impact of mining is adding operational complexity and cost.
  • For example, compliance with stringent heavy metal regulations, such as new cadmium limits in fertilizers, can increase processing costs by as much as 20%. Furthermore, legislative frameworks like the Critical Raw Materials Act are reshaping global trade flows by encouraging regional sourcing and recycling, challenging the business models of traditional, large-scale exporters.

Exclusive Technavio Analysis on Customer Landscape

The phosphate market forecasting report includes the adoption lifecycle of the market, covering from the innovator’s stage to the laggard’s stage. It focuses on adoption rates in different regions based on penetration. Furthermore, the phosphate market report also includes key purchase criteria and drivers of price sensitivity to help companies evaluate and develop their market growth analysis strategies.

Customer Landscape of Phosphate Industry

Competitive Landscape

Companies are implementing various strategies, such as strategic alliances, phosphate market forecast, partnerships, mergers and acquisitions, geographical expansion, and product/service launches, to enhance their presence in the industry.

AquaPhoenix Scientific Inc. - Provides a specialized portfolio of phosphate compounds, such as orthophosphate and metaphosphate, in addition to vital laboratory reagents and high-purity analytical standards.

The industry research and growth report includes detailed analyses of the competitive landscape of the market and information about key companies, including:

  • AquaPhoenix Scientific Inc.
  • Avantor Inc.
  • CMOC Group Limited
  • EuroChem Group AG
  • Fertoz Ltd.
  • Innophos Holdings Inc.
  • Israel Chemicals Ltd.
  • Jordan Phosphate Mines Co. PLC
  • Koch Fertilizer LLC
  • Misr Phosphate Co.
  • Nutrien Ltd.
  • OCP Group
  • PhosAgro Group of Companies
  • Saudi Arabian Mining Co.
  • Solvay SA
  • The Mosaic Co.
  • Yunnan Phosphate Haikou Co.
  • Yuntianhua Group Co. Ltd.

Qualitative and quantitative analysis of companies has been conducted to help clients understand the wider business environment as well as the strengths and weaknesses of key industry players. Data is qualitatively analyzed to categorize companies as pure play, category-focused, industry-focused, and diversified; it is quantitatively analyzed to categorize companies as dominant, leading, strong, tentative, and weak.

Recent Development and News in Phosphate market

  • In December 2024, the Saudi Arabian Mining Company (Maaden) finalized the acquisition of the entire stake of the Mosaic Company in the Waad Al Shamal Phosphate Company, strengthening its global leadership in phosphate fertilizer production.
  • In February 2025, the European Commission introduced a directive requiring member states to increase phosphorus recovery from municipal wastewater sludge by 20%, aiming to advance the circular economy.
  • In June 2025, a leading fertilizer company in Tampa unveiled a new facility for producing high-purity monoammonium phosphate, specifically targeting the growing battery materials supply chain.
  • In July 2025, OCP Group in Morocco commissioned a major industrial desalination facility at its Jorf Lasfar hub, securing water supply for phosphoric acid production amid climatic volatility.

Dive into Technavio’s robust research methodology, blending expert interviews, extensive data synthesis, and validated models for unparalleled Phosphate Market insights. See full methodology.

Market Scope
Page number 304
Base year 2025
Historic period 2020-2024
Forecast period 2026-2030
Growth momentum & CAGR Accelerate at a CAGR of 6.1%
Market growth 2026-2030 USD 10561.4 million
Market structure Fragmented
YoY growth 2025-2026(%) 5.7%
Key countries China, India, Vietnam, Thailand, Indonesia, Australia, US, Canada, Mexico, Russia, Spain, Germany, France, Poland, The Netherlands, Brazil, Argentina, Chile, Morocco, Saudi Arabia, Egypt, Algeria and Tunisia
Competitive landscape Leading Companies, Market Positioning of Companies, Competitive Strategies, and Industry Risks

Request Free Sample

Research Analyst Overview

  • The phosphate market is evolving beyond its agricultural foundations, now defined by raw material volatility and a strategic pivot towards a circular nutrient economy.
  • While demand for fertilizers like diammonium phosphate (dap), monoammonium phosphate (map), triple superphosphate (tsp), and single superphosphate (ssp) remains strong, influenced by policies like the nutrient based subsidy (nbs), a significant boardroom decision involves allocating resources to produce high-purity phosphoric acid for the lithium iron phosphate (lfp) battery sector.
  • This requires a sophisticated beneficiation process and granulation technology to create superior phosphate rock concentrate. Producers are diversifying from sedimentary phosphate deposits to explore igneous phosphate deposits and even nascent marine phosphate deposits. The industry faces pressures from phosphogypsum waste management and stringent cadmium content regulation.
  • Investment in apatite rock processing now includes advanced fluorine removal process technology to mitigate heavy metal contamination and lower the arsenic impurity level, especially for food-grade phosphoric acid and feed grade phosphate products like monocalcium phosphate and dicalcium phosphate. The focus on sustainability is driving innovation in phosphate recovery technology, including struvite precipitation, to reduce eutrophication risk.
  • This push creates demand for enhanced efficiency fertilizer and slow-release fertilizer products that improve crop nutrient uptake and act as a soil ph amendment, with some solutions improving uptake efficiency by 20%. Simultaneously, phosphate’s role as a corrosion inhibitor and water treatment chemical continues to expand.

What are the Key Data Covered in this Phosphate Market Research and Growth Report?

  • What is the expected growth of the Phosphate Market between 2026 and 2030?

    • USD 10.56 billion, at a CAGR of 6.1%

  • What segmentation does the market report cover?

    • The report is segmented by Application (Fertilizer, Animal feed supplement, and Others), Source (Sedimentary deposits, Igneous deposits, and Marine deposits), Product Type (Diammonium phosphate, Monoammonium phosphate, Triple superphosphate, Single superphosphate, and Others) and Geography (APAC, North America, Europe, South America, Middle East and Africa)

  • Which regions are analyzed in the report?

    • APAC, North America, Europe, South America and Middle East and Africa

  • What are the key growth drivers and market challenges?

    • Growing demand for phosphate fertilizers, Volatile of raw material and fertilizer prices

  • Who are the major players in the Phosphate Market?

    • AquaPhoenix Scientific Inc., Avantor Inc., CMOC Group Limited, EuroChem Group AG, Fertoz Ltd., Innophos Holdings Inc., Israel Chemicals Ltd., Jordan Phosphate Mines Co. PLC, Koch Fertilizer LLC, Misr Phosphate Co., Nutrien Ltd., OCP Group, PhosAgro Group of Companies, Saudi Arabian Mining Co., Solvay SA, The Mosaic Co., Yunnan Phosphate Haikou Co. and Yuntianhua Group Co. Ltd.

Market Research Insights

  • Market dynamics are shaped by demand diversification beyond agriculture. While essential for livestock bone development in animal feed, phosphates are critical as food and beverage additives, enhancing product stability. In industrial use cases, phosphates function as a key metal finishing agent, where process efficiency has improved coating adhesion by 10%. Concurrently, stringent environmental regulations are driving innovation.
  • Advanced wastewater treatment solutions now achieve up to a 30% greater phosphorus recovery rate, turning a waste stream into a valuable resource. Furthermore, new methods are reducing the environmental impact of mining, with some operations cutting water consumption by over 15%. This shift toward value-added applications and sustainable practices defines the market's trajectory, balancing industrial need with ecological responsibility.

We can help! Our analysts can customize this phosphate market research report to meet your requirements.

Get in touch

1. Executive Summary

1.1 Market overview

Executive Summary - Chart on Market Overview
Executive Summary - Data Table on Market Overview
Executive Summary - Chart on Global Market Characteristics
Executive Summary - Chart on Market by Geography
Executive Summary - Chart on Market Segmentation by Application
Executive Summary - Chart on Market Segmentation by Source
Executive Summary - Chart on Market Segmentation by Product Type
Executive Summary - Chart on Incremental Growth
Executive Summary - Data Table on Incremental Growth
Executive Summary - Chart on Company Market Positioning

2. Technavio Analysis

2.1 Analysis of price sensitivity, lifecycle, customer purchase basket, adoption rates, and purchase criteria

2.2 Criticality of inputs and Factors of differentiation

Chart on Overview on criticality of inputs and factors of differentiation

2.3 Factors of disruption

Chart on Overview on factors of disruption

2.4 Impact of drivers and challenges

Chart on Impact of drivers and challenges in 2025 and 2030

3. Market Landscape

3.1 Market ecosystem

Chart on Parent Market
Data Table on - Parent Market

3.2 Market characteristics

Chart on Market characteristics analysis

3.3 Value chain analysis

Chart on Value chain analysis

4. Market Sizing

4.1 Market definition

Data Table on Offerings of companies included in the market definition

4.2 Market segment analysis

Market segments

4.3 Market size 2025

4.4 Market outlook: Forecast for 2025-2030

Chart on Global - Market size and forecast 2025-2030 ($ million)
Data Table on Global - Market size and forecast 2025-2030 ($ million)
Chart on Global Market: Year-over-year growth 2025-2030 (%)
Data Table on Global Market: Year-over-year growth 2025-2030 (%)

5. Historic Market Size

5.1 Global Phosphate Market 2020 - 2024

Historic Market Size - Data Table on Global Phosphate Market 2020 - 2024 ($ million)

5.2 Application segment analysis 2020 - 2024

Historic Market Size - Application Segment 2020 - 2024 ($ million)

5.3 Source segment analysis 2020 - 2024

Historic Market Size - Source Segment 2020 - 2024 ($ million)

5.4 Product Type segment analysis 2020 - 2024

Historic Market Size - Product Type Segment 2020 - 2024 ($ million)

5.5 Geography segment analysis 2020 - 2024

Historic Market Size - Geography Segment 2020 - 2024 ($ million)

5.6 Country segment analysis 2020 - 2024

Historic Market Size - Country Segment 2020 - 2024 ($ million)

6. Qualitative Analysis

6.1 The AI impact on Global Phosphate Market

7. Five Forces Analysis

7.1 Five forces summary

Five forces analysis - Comparison between 2025 and 2030

7.2 Bargaining power of buyers

Bargaining power of buyers - Impact of key factors 2025 and 2030

7.3 Bargaining power of suppliers

Bargaining power of suppliers - Impact of key factors in 2025 and 2030

7.4 Threat of new entrants

Threat of new entrants - Impact of key factors in 2025 and 2030

7.5 Threat of substitutes

Threat of substitutes - Impact of key factors in 2025 and 2030

7.6 Threat of rivalry

Threat of rivalry - Impact of key factors in 2025 and 2030

7.7 Market condition

Chart on Market condition - Five forces 2025 and 2030

8. Market Segmentation by Application

8.1 Market segments

Chart on Application - Market share 2025-2030 (%)
Data Table on Application - Market share 2025-2030 (%)

8.2 Comparison by Application

Chart on Comparison by Application
Data Table on Comparison by Application

8.3 Fertilizer - Market size and forecast 2025-2030

Chart on Fertilizer - Market size and forecast 2025-2030 ($ million)
Data Table on Fertilizer - Market size and forecast 2025-2030 ($ million)
Chart on Fertilizer - Year-over-year growth 2025-2030 (%)
Data Table on Fertilizer - Year-over-year growth 2025-2030 (%)

8.4 Animal feed supplement - Market size and forecast 2025-2030

Chart on Animal feed supplement - Market size and forecast 2025-2030 ($ million)
Data Table on Animal feed supplement - Market size and forecast 2025-2030 ($ million)
Chart on Animal feed supplement - Year-over-year growth 2025-2030 (%)
Data Table on Animal feed supplement - Year-over-year growth 2025-2030 (%)

8.5 Others - Market size and forecast 2025-2030

Chart on Others - Market size and forecast 2025-2030 ($ million)
Data Table on Others - Market size and forecast 2025-2030 ($ million)
Chart on Others - Year-over-year growth 2025-2030 (%)
Data Table on Others - Year-over-year growth 2025-2030 (%)

8.6 Market opportunity by Application

Market opportunity by Application ($ million)
Data Table on Market opportunity by Application ($ million)

9. Market Segmentation by Source

9.1 Market segments

Chart on Source - Market share 2025-2030 (%)
Data Table on Source - Market share 2025-2030 (%)

9.2 Comparison by Source

Chart on Comparison by Source
Data Table on Comparison by Source

9.3 Sedimentary deposits - Market size and forecast 2025-2030

Chart on Sedimentary deposits - Market size and forecast 2025-2030 ($ million)
Data Table on Sedimentary deposits - Market size and forecast 2025-2030 ($ million)
Chart on Sedimentary deposits - Year-over-year growth 2025-2030 (%)
Data Table on Sedimentary deposits - Year-over-year growth 2025-2030 (%)

9.4 Igneous deposits - Market size and forecast 2025-2030

Chart on Igneous deposits - Market size and forecast 2025-2030 ($ million)
Data Table on Igneous deposits - Market size and forecast 2025-2030 ($ million)
Chart on Igneous deposits - Year-over-year growth 2025-2030 (%)
Data Table on Igneous deposits - Year-over-year growth 2025-2030 (%)

9.5 Marine deposits - Market size and forecast 2025-2030

Chart on Marine deposits - Market size and forecast 2025-2030 ($ million)
Data Table on Marine deposits - Market size and forecast 2025-2030 ($ million)
Chart on Marine deposits - Year-over-year growth 2025-2030 (%)
Data Table on Marine deposits - Year-over-year growth 2025-2030 (%)

9.6 Market opportunity by Source

Market opportunity by Source ($ million)
Data Table on Market opportunity by Source ($ million)

10. Market Segmentation by Product Type

10.1 Market segments

Chart on Product Type - Market share 2025-2030 (%)
Data Table on Product Type - Market share 2025-2030 (%)

10.2 Comparison by Product Type

Chart on Comparison by Product Type
Data Table on Comparison by Product Type

10.3 Diammonium phosphate - Market size and forecast 2025-2030

Chart on Diammonium phosphate - Market size and forecast 2025-2030 ($ million)
Data Table on Diammonium phosphate - Market size and forecast 2025-2030 ($ million)
Chart on Diammonium phosphate - Year-over-year growth 2025-2030 (%)
Data Table on Diammonium phosphate - Year-over-year growth 2025-2030 (%)

10.4 Monoammonium phosphate - Market size and forecast 2025-2030

Chart on Monoammonium phosphate - Market size and forecast 2025-2030 ($ million)
Data Table on Monoammonium phosphate - Market size and forecast 2025-2030 ($ million)
Chart on Monoammonium phosphate - Year-over-year growth 2025-2030 (%)
Data Table on Monoammonium phosphate - Year-over-year growth 2025-2030 (%)

10.5 Triple superphosphate - Market size and forecast 2025-2030

Chart on Triple superphosphate - Market size and forecast 2025-2030 ($ million)
Data Table on Triple superphosphate - Market size and forecast 2025-2030 ($ million)
Chart on Triple superphosphate - Year-over-year growth 2025-2030 (%)
Data Table on Triple superphosphate - Year-over-year growth 2025-2030 (%)

10.6 Single superphosphate - Market size and forecast 2025-2030

Chart on Single superphosphate - Market size and forecast 2025-2030 ($ million)
Data Table on Single superphosphate - Market size and forecast 2025-2030 ($ million)
Chart on Single superphosphate - Year-over-year growth 2025-2030 (%)
Data Table on Single superphosphate - Year-over-year growth 2025-2030 (%)

10.7 Others - Market size and forecast 2025-2030

Chart on Others - Market size and forecast 2025-2030 ($ million)
Data Table on Others - Market size and forecast 2025-2030 ($ million)
Chart on Others - Year-over-year growth 2025-2030 (%)
Data Table on Others - Year-over-year growth 2025-2030 (%)

10.8 Market opportunity by Product Type

Market opportunity by Product Type ($ million)
Data Table on Market opportunity by Product Type ($ million)

11. Customer Landscape

11.1 Customer landscape overview

Analysis of price sensitivity, lifecycle, customer purchase basket, adoption rates, and purchase criteria

12. Geographic Landscape

12.1 Geographic segmentation

Chart on Market share by geography 2025-2030 (%)
Data Table on Market share by geography 2025-2030 (%)

12.2 Geographic comparison

Chart on Geographic comparison
Data Table on Geographic comparison

12.3 APAC - Market size and forecast 2025-2030

Chart on APAC - Market size and forecast 2025-2030 ($ million)
Data Table on APAC - Market size and forecast 2025-2030 ($ million)
Chart on APAC - Year-over-year growth 2025-2030 (%)
Data Table on APAC - Year-over-year growth 2025-2030 (%)
Chart on Regional Comparison - APAC
Data Table on Regional Comparison - APAC

12.3.1 China - Market size and forecast 2025-2030

Chart on China - Market size and forecast 2025-2030 ($ million)
Data Table on China - Market size and forecast 2025-2030 ($ million)
Chart on China - Year-over-year growth 2025-2030 (%)
Data Table on China - Year-over-year growth 2025-2030 (%)

12.3.2 India - Market size and forecast 2025-2030

Chart on India - Market size and forecast 2025-2030 ($ million)
Data Table on India - Market size and forecast 2025-2030 ($ million)
Chart on India - Year-over-year growth 2025-2030 (%)
Data Table on India - Year-over-year growth 2025-2030 (%)

12.3.3 Vietnam - Market size and forecast 2025-2030

Chart on Vietnam - Market size and forecast 2025-2030 ($ million)
Data Table on Vietnam - Market size and forecast 2025-2030 ($ million)
Chart on Vietnam - Year-over-year growth 2025-2030 (%)
Data Table on Vietnam - Year-over-year growth 2025-2030 (%)

12.3.4 Thailand - Market size and forecast 2025-2030

Chart on Thailand - Market size and forecast 2025-2030 ($ million)
Data Table on Thailand - Market size and forecast 2025-2030 ($ million)
Chart on Thailand - Year-over-year growth 2025-2030 (%)
Data Table on Thailand - Year-over-year growth 2025-2030 (%)

12.3.5 Indonesia - Market size and forecast 2025-2030

Chart on Indonesia - Market size and forecast 2025-2030 ($ million)
Data Table on Indonesia - Market size and forecast 2025-2030 ($ million)
Chart on Indonesia - Year-over-year growth 2025-2030 (%)
Data Table on Indonesia - Year-over-year growth 2025-2030 (%)

12.3.6 Australia - Market size and forecast 2025-2030

Chart on Australia - Market size and forecast 2025-2030 ($ million)
Data Table on Australia - Market size and forecast 2025-2030 ($ million)
Chart on Australia - Year-over-year growth 2025-2030 (%)
Data Table on Australia - Year-over-year growth 2025-2030 (%)

12.4 North America - Market size and forecast 2025-2030

Chart on North America - Market size and forecast 2025-2030 ($ million)
Data Table on North America - Market size and forecast 2025-2030 ($ million)
Chart on North America - Year-over-year growth 2025-2030 (%)
Data Table on North America - Year-over-year growth 2025-2030 (%)
Chart on Regional Comparison - North America
Data Table on Regional Comparison - North America

12.4.1 US - Market size and forecast 2025-2030

Chart on US - Market size and forecast 2025-2030 ($ million)
Data Table on US - Market size and forecast 2025-2030 ($ million)
Chart on US - Year-over-year growth 2025-2030 (%)
Data Table on US - Year-over-year growth 2025-2030 (%)

12.4.2 Canada - Market size and forecast 2025-2030

Chart on Canada - Market size and forecast 2025-2030 ($ million)
Data Table on Canada - Market size and forecast 2025-2030 ($ million)
Chart on Canada - Year-over-year growth 2025-2030 (%)
Data Table on Canada - Year-over-year growth 2025-2030 (%)

12.4.3 Mexico - Market size and forecast 2025-2030

Chart on Mexico - Market size and forecast 2025-2030 ($ million)
Data Table on Mexico - Market size and forecast 2025-2030 ($ million)
Chart on Mexico - Year-over-year growth 2025-2030 (%)
Data Table on Mexico - Year-over-year growth 2025-2030 (%)

12.5 Europe - Market size and forecast 2025-2030

Chart on Europe - Market size and forecast 2025-2030 ($ million)
Data Table on Europe - Market size and forecast 2025-2030 ($ million)
Chart on Europe - Year-over-year growth 2025-2030 (%)
Data Table on Europe - Year-over-year growth 2025-2030 (%)
Chart on Regional Comparison - Europe
Data Table on Regional Comparison - Europe

12.5.1 Russia - Market size and forecast 2025-2030

Chart on Russia - Market size and forecast 2025-2030 ($ million)
Data Table on Russia - Market size and forecast 2025-2030 ($ million)
Chart on Russia - Year-over-year growth 2025-2030 (%)
Data Table on Russia - Year-over-year growth 2025-2030 (%)

12.5.2 Spain - Market size and forecast 2025-2030

Chart on Spain - Market size and forecast 2025-2030 ($ million)
Data Table on Spain - Market size and forecast 2025-2030 ($ million)
Chart on Spain - Year-over-year growth 2025-2030 (%)
Data Table on Spain - Year-over-year growth 2025-2030 (%)

12.5.3 Germany - Market size and forecast 2025-2030

Chart on Germany - Market size and forecast 2025-2030 ($ million)
Data Table on Germany - Market size and forecast 2025-2030 ($ million)
Chart on Germany - Year-over-year growth 2025-2030 (%)
Data Table on Germany - Year-over-year growth 2025-2030 (%)

12.5.4 France - Market size and forecast 2025-2030

Chart on France - Market size and forecast 2025-2030 ($ million)
Data Table on France - Market size and forecast 2025-2030 ($ million)
Chart on France - Year-over-year growth 2025-2030 (%)
Data Table on France - Year-over-year growth 2025-2030 (%)

12.5.5 Poland - Market size and forecast 2025-2030

Chart on Poland - Market size and forecast 2025-2030 ($ million)
Data Table on Poland - Market size and forecast 2025-2030 ($ million)
Chart on Poland - Year-over-year growth 2025-2030 (%)
Data Table on Poland - Year-over-year growth 2025-2030 (%)

12.5.6 The Netherlands - Market size and forecast 2025-2030

Chart on The Netherlands - Market size and forecast 2025-2030 ($ million)
Data Table on The Netherlands - Market size and forecast 2025-2030 ($ million)
Chart on The Netherlands - Year-over-year growth 2025-2030 (%)
Data Table on The Netherlands - Year-over-year growth 2025-2030 (%)

12.6 South America - Market size and forecast 2025-2030

Chart on South America - Market size and forecast 2025-2030 ($ million)
Data Table on South America - Market size and forecast 2025-2030 ($ million)
Chart on South America - Year-over-year growth 2025-2030 (%)
Data Table on South America - Year-over-year growth 2025-2030 (%)
Chart on Regional Comparison - South America
Data Table on Regional Comparison - South America

12.6.1 Brazil - Market size and forecast 2025-2030

Chart on Brazil - Market size and forecast 2025-2030 ($ million)
Data Table on Brazil - Market size and forecast 2025-2030 ($ million)
Chart on Brazil - Year-over-year growth 2025-2030 (%)
Data Table on Brazil - Year-over-year growth 2025-2030 (%)

12.6.2 Argentina - Market size and forecast 2025-2030

Chart on Argentina - Market size and forecast 2025-2030 ($ million)
Data Table on Argentina - Market size and forecast 2025-2030 ($ million)
Chart on Argentina - Year-over-year growth 2025-2030 (%)
Data Table on Argentina - Year-over-year growth 2025-2030 (%)

12.6.3 Chile - Market size and forecast 2025-2030

Chart on Chile - Market size and forecast 2025-2030 ($ million)
Data Table on Chile - Market size and forecast 2025-2030 ($ million)
Chart on Chile - Year-over-year growth 2025-2030 (%)
Data Table on Chile - Year-over-year growth 2025-2030 (%)

12.7 Middle East and Africa - Market size and forecast 2025-2030

Chart on Middle East and Africa - Market size and forecast 2025-2030 ($ million)
Data Table on Middle East and Africa - Market size and forecast 2025-2030 ($ million)
Chart on Middle East and Africa - Year-over-year growth 2025-2030 (%)
Data Table on Middle East and Africa - Year-over-year growth 2025-2030 (%)
Chart on Regional Comparison - Middle East and Africa
Data Table on Regional Comparison - Middle East and Africa

12.7.1 Morocco - Market size and forecast 2025-2030

Chart on Morocco - Market size and forecast 2025-2030 ($ million)
Data Table on Morocco - Market size and forecast 2025-2030 ($ million)
Chart on Morocco - Year-over-year growth 2025-2030 (%)
Data Table on Morocco - Year-over-year growth 2025-2030 (%)

12.7.2 Saudi Arabia - Market size and forecast 2025-2030

Chart on Saudi Arabia - Market size and forecast 2025-2030 ($ million)
Data Table on Saudi Arabia - Market size and forecast 2025-2030 ($ million)
Chart on Saudi Arabia - Year-over-year growth 2025-2030 (%)
Data Table on Saudi Arabia - Year-over-year growth 2025-2030 (%)

12.7.3 Egypt - Market size and forecast 2025-2030

Chart on Egypt - Market size and forecast 2025-2030 ($ million)
Data Table on Egypt - Market size and forecast 2025-2030 ($ million)
Chart on Egypt - Year-over-year growth 2025-2030 (%)
Data Table on Egypt - Year-over-year growth 2025-2030 (%)

12.7.4 Algeria - Market size and forecast 2025-2030

Chart on Algeria - Market size and forecast 2025-2030 ($ million)
Data Table on Algeria - Market size and forecast 2025-2030 ($ million)
Chart on Algeria - Year-over-year growth 2025-2030 (%)
Data Table on Algeria - Year-over-year growth 2025-2030 (%)

12.7.5 Tunisia - Market size and forecast 2025-2030

Chart on Tunisia - Market size and forecast 2025-2030 ($ million)
Data Table on Tunisia - Market size and forecast 2025-2030 ($ million)
Chart on Tunisia - Year-over-year growth 2025-2030 (%)
Data Table on Tunisia - Year-over-year growth 2025-2030 (%)

12.8 Market opportunity by geography

Market opportunity by geography ($ million)
Data Tables on Market opportunity by geography ($ million)

13. Drivers, Challenges, and Opportunity

13.1 Market drivers

Growing demand for phosphate fertilizers
Growing demand phosphate from end-user applications
High demand for feed additives

13.2 Market challenges

Volatile of raw material and fertilizer prices
Toxicity of feed phosphates
Stringent regulations and policies

13.3 Impact of drivers and challenges

Impact of drivers and challenges in 2025 and 2030

13.4 Market opportunities

Growth in production of ammonium phosphate using green phosphoric acid
Rising awareness regarding organic farming
Growing demand for water treatment chemicals

14. Competitive Landscape

14.1 Overview

14.2

Overview on criticality of inputs and factors of differentiation

14.3 Landscape disruption

Overview on factors of disruption

14.4 Industry risks

Impact of key risks on business

15. Competitive Analysis

15.1 Companies profiled

Companies covered

15.2 Company ranking index

15.3 Market positioning of companies

Matrix on companies position and classification

15.4 AquaPhoenix Scientific Inc.

AquaPhoenix Scientific Inc. - Overview
AquaPhoenix Scientific Inc. - Product / Service
AquaPhoenix Scientific Inc. - Key offerings
SWOT

15.5 CMOC Group Limited

CMOC Group Limited - Overview
CMOC Group Limited - Product / Service
CMOC Group Limited - Key offerings
SWOT

15.6 EuroChem Group AG

EuroChem Group AG - Overview
EuroChem Group AG - Product / Service
EuroChem Group AG - Key offerings
SWOT

15.7 Fertoz Ltd.

Fertoz Ltd. - Overview
Fertoz Ltd. - Product / Service
Fertoz Ltd. - Key offerings
SWOT

15.8 Innophos Holdings Inc.

Innophos Holdings Inc. - Overview
Innophos Holdings Inc. - Product / Service
Innophos Holdings Inc. - Key offerings
SWOT

15.9 Israel Chemicals Ltd.

Israel Chemicals Ltd. - Overview
Israel Chemicals Ltd. - Business segments
Israel Chemicals Ltd. - Key offerings
Israel Chemicals Ltd. - Segment focus
SWOT

15.10 Jordan Phosphate Mines Co. PLC

Jordan Phosphate Mines Co. PLC - Overview
Jordan Phosphate Mines Co. PLC - Business segments
Jordan Phosphate Mines Co. PLC - Key offerings
Jordan Phosphate Mines Co. PLC - Segment focus
SWOT

15.11 Koch Fertilizer LLC

Koch Fertilizer LLC - Overview
Koch Fertilizer LLC - Product / Service
Koch Fertilizer LLC - Key offerings
SWOT

15.12 Misr Phosphate Co.

Misr Phosphate Co. - Overview
Misr Phosphate Co. - Product / Service
Misr Phosphate Co. - Key offerings
SWOT

15.13 Nutrien Ltd.

Nutrien Ltd. - Overview
Nutrien Ltd. - Business segments
Nutrien Ltd. - Key offerings
Nutrien Ltd. - Segment focus
SWOT

15.14 OCP Group

OCP Group - Overview
OCP Group - Business segments
OCP Group - Key offerings
OCP Group - Segment focus
SWOT

15.15 PhosAgro Group of Companies

PhosAgro Group of Companies - Overview
PhosAgro Group of Companies - Product / Service
PhosAgro Group of Companies - Key offerings
SWOT

15.16 Saudi Arabian Mining Co.

Saudi Arabian Mining Co. - Overview
Saudi Arabian Mining Co. - Business segments
Saudi Arabian Mining Co. - Key news
Saudi Arabian Mining Co. - Key offerings
Saudi Arabian Mining Co. - Segment focus
SWOT

15.17 Solvay SA

Solvay SA - Overview
Solvay SA - Business segments
Solvay SA - Key news
Solvay SA - Key offerings
Solvay SA - Segment focus
SWOT

15.18 The Mosaic Co.

The Mosaic Co. - Overview
The Mosaic Co. - Business segments
The Mosaic Co. - Key offerings
The Mosaic Co. - Segment focus
SWOT

16. Appendix

16.1 Scope of the report

Market definition
Objectives
Notes and caveats

16.2 Inclusions and exclusions checklist

Inclusions checklist
Exclusions checklist

16.3 Currency conversion rates for US$

16.4 Research methodology

16.5 Data procurement

Information sources

16.6 Data validation

16.7 Validation techniques employed for market sizing

16.8 Data synthesis

16.9 360 degree market analysis

16.10 List of abbreviations

Research Methodology

Technavio presents a detailed picture of the market by way of study, synthesis, and summation of data from multiple sources. The analysts have presented the various facets of the market with a particular focus on identifying the key industry influencers. The data thus presented is comprehensive, reliable, and the result of extensive research, both primary and secondary.

INFORMATION SOURCES

Primary sources

  • Manufacturers and suppliers
  • Channel partners
  • Industry experts
  • Strategic decision makers

Secondary sources

  • Industry journals and periodicals
  • Government data
  • Financial reports of key industry players
  • Historical data
  • Press releases

DATA ANALYSIS

Data Synthesis

  • Collation of data
  • Estimation of key figures
  • Analysis of derived insights

Data Validation

  • Triangulation with data models
  • Reference against proprietary databases
  • Corroboration with industry experts

REPORT WRITING

Qualitative

  • Market drivers
  • Market challenges
  • Market trends
  • Five forces analysis

Quantitative

  • Market size and forecast
  • Market segmentation
  • Geographical insights
  • Competitive landscape

Interested in this report?

Get your sample now to see our research methodology and insights!

Download Now

Frequently Asked Questions

Phosphate market growth will increase by USD 10561.4 million during 2026-2030 .

The Phosphate market is expected to grow at a CAGR of 6.1% during 2026-2030 .

Phosphate market is segmented by Application (Fertilizer, Animal feed supplement, Others) Source (Sedimentary deposits, Igneous deposits, Marine deposits) Product type (Diammonium phosphate, Monoammonium phosphate, Triple superphosphate, Single superphosphate, Others)

AquaPhoenix Scientific Inc., Avantor Inc., CMOC Group Limited, EuroChem Group AG, Fertoz Ltd., Innophos Holdings Inc., Israel Chemicals Ltd., Jordan Phosphate Mines Co. PLC, Koch Fertilizer LLC, Misr Phosphate Co., Nutrien Ltd., OCP Group, PhosAgro Group of Companies, Saudi Arabian Mining Co., Solvay SA, The Mosaic Co., Yunnan Phosphate Haikou Co., Yuntianhua Group Co. Ltd. are a few of the key vendors in the Phosphate market.

APAC will register the highest growth rate of 57.6% among the other regions. Therefore, the Phosphate market in APAC is expected to garner significant business opportunities for the vendors during the forecast period.

China, India, Vietnam, Thailand, Indonesia, Australia, US, Canada, Mexico, Russia, Spain, Germany, France, Poland, The Netherlands, Brazil, Argentina, Chile, Morocco, Saudi Arabia, Egypt, Algeria, Tunisia

  • Growing demand for phosphate fertilizers is the driving factor this market.

The Phosphate market vendors should focus on grabbing business opportunities from the Application segment as it accounted for the largest market share in the base year.