Plastic Pallets Market Analysis, Size, and Forecast 2026-2030: APAC (China, Japan, and India), Europe (Germany, UK, and France), North America (US, Canada, and Mexico), South America (Brazil, Argentina, and Chile), Middle East and Africa (Saudi Arabia, UAE, and South Africa), and Rest of World (ROW)

Plastic Pallets Market Analysis, Size, and Forecast 2026-2030:
APAC (China, Japan, and India), Europe (Germany, UK, and France), North America (US, Canada, and Mexico), South America (Brazil, Argentina, and Chile), Middle East and Africa (Saudi Arabia, UAE, and South Africa), and Rest of World (ROW)

Published: Oct 2026 300 Pages SKU: IRTNTR40003

Market Overview at a Glance

$1.44 B
Market Opportunity
3.9%
CAGR 2025 - 2030
41.3%
APAC Growth
$4.41 B
HDPE segment 2024

Plastic Pallets Market Size 2026-2030

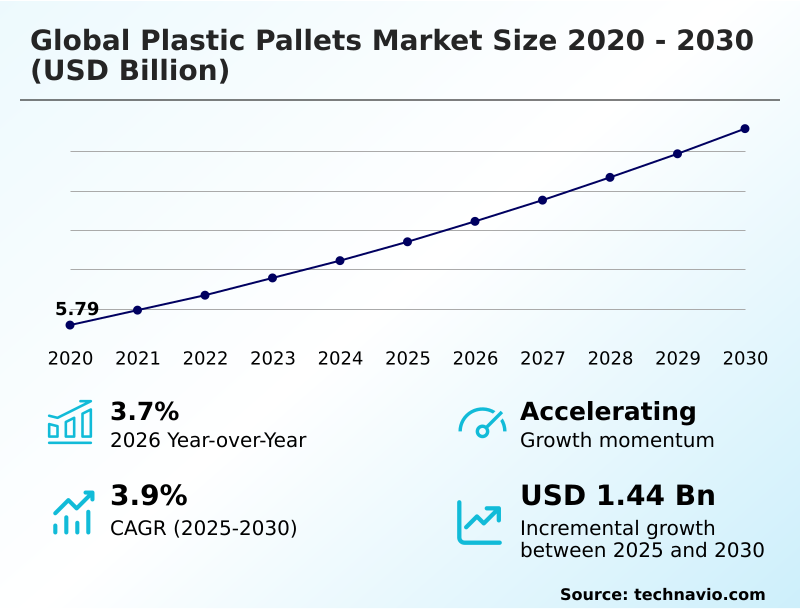
The plastic pallets market size is valued to increase by USD 1.44 billion, at a CAGR of 3.9% from 2025 to 2030. Proliferation of automated warehousing technologies will drive the plastic pallets market.

Major Market Trends & Insights

  • APAC dominated the market and accounted for a 41.3% growth during the forecast period.
  • By Material - HDPE segment was valued at USD 4.41 billion in 2024
  • By Type - Rackable segment accounted for the largest market revenue share in 2024

Market Size & Forecast

  • Market Opportunities: USD 2.50 billion
  • Market Future Opportunities: USD 1.44 billion
  • CAGR from 2025 to 2030 : 3.9%

Market Summary

  • The Plastic Pallets Market is undergoing a structural transformation driven by the integration of durable polymer platforms across high-volume distribution networks. Businesses operating in fast-moving consumer goods sectors utilize advanced formulations to execute closed-loop pooling strategies, significantly lowering packaging waste. By implementing these reusable assets, logistics operators achieve a 30% reduction in long-term procurement expenditures compared to single-use wooden alternatives.
  • The primary driver accelerating this transition is the rapid expansion of automated storage infrastructure, which demands absolute dimensional stability to prevent mechanical jamming in high-speed sorting facilities. Conversely, substantial upfront acquisition costs pose a significant challenge, limiting immediate deployment for small-scale warehouse operators managing constrained capital budgets.
  • To maximize return on investment, enterprises are incorporating asset tracking integration directly into the injection molding process, allowing supply chain managers to monitor inventory movement precisely. This continuous technological refinement ensures that precision-engineered platforms remain critical for maintaining seamless and compliant industrial operations.

What will be the Size of the Plastic Pallets Market during the forecast period?
Get Key Insights on Market Forecast (PDF) Get Free Sample

How is the Plastic Pallets Market Segmented?

The plastic pallets industry research report provides comprehensive data (region-wise segment analysis), with forecasts and estimates in "USD million" for the period 2026-2030, as well as historical data from 2020-2024 for the following segments.

  • Material
    • HDPE
    • PP
  • Type
    • Rackable
    • Nestable
    • Stackable
    • Others
  • End-user
    • Food and beverages
    • Chemicals
    • Pharmaceuticals
    • Automotive
    • Others
  • Geography
    • APAC
      • China
      • Japan
      • India
      • South Korea
      • Australia
      • Indonesia
    • Europe
      • Germany
      • UK
      • France
      • Italy
      • Spain
      • The Netherlands
    • North America
      • US
      • Canada
      • Mexico
    • South America
      • Brazil
      • Argentina
      • Chile
    • Middle East and Africa
      • Saudi Arabia
      • UAE
      • South Africa
      • Israel
      • Turkey

By Material Insights

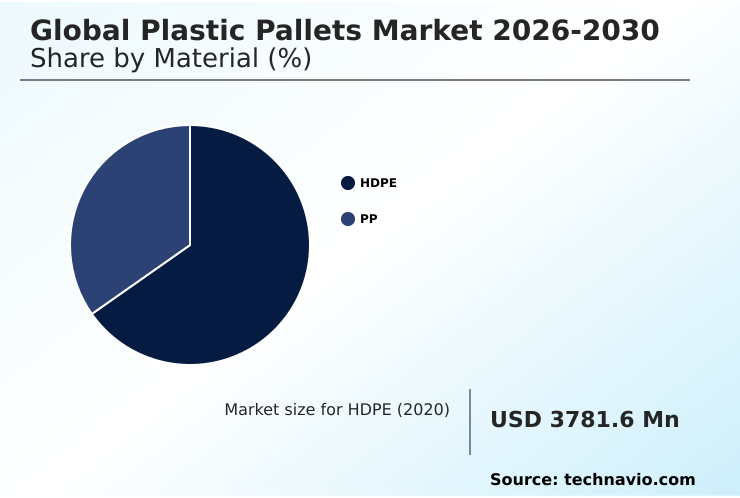
The hdpe segment is estimated to witness significant growth during the forecast period.

High-density polyethylene segments command the largest volume due to exceptional material characteristics fulfilling rigorous industrial requirements.

This material provides superior impact resistance and chemical inertness, establishing it as the standard for any heavy-duty industrial application requiring high structural load capacity and structural integrity.

The hygienic non-porous surface prevents moisture absorption, virtually eliminating bacterial growth risks in sensitive supply chains.

By transitioning to these advanced polymer platforms, warehouse automation systems and automated storage hubs achieve a 15% improvement in handling precision compared to traditional timber.

Furthermore, the operational shift toward sustainable material recovery and industrial waste minimization significantly lowers the total ownership burden. These platforms deliver an extended service lifespan, driving continuous replacement of legacy wooden inventory assets and enhancing overall logistics performance.
Get Free Sample

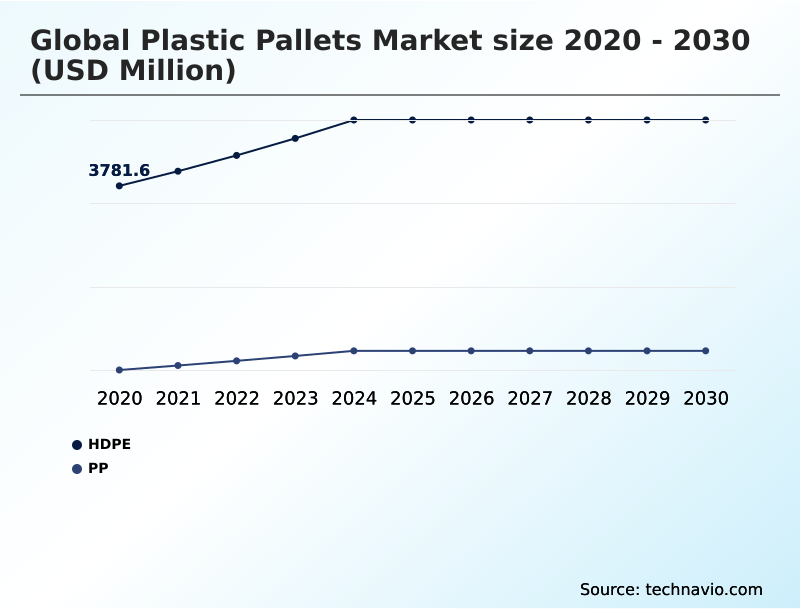
The HDPE segment was valued at USD 4.41 billion in 2024 and showed a gradual increase during the forecast period.
Get Free Sample

Regional Analysis

APAC is estimated to contribute 41.3% to the growth of the global market during the forecast period.Technavio’s analysts have elaborately explained the regional trends and drivers that shape the market during the forecast period.
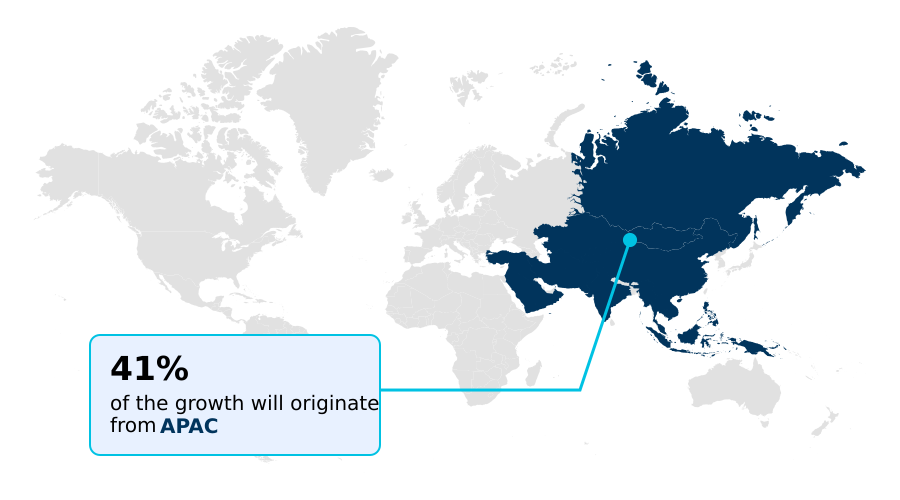
See How Plastic Pallets Market Demand is Rising in APAC Get Free Sample

The geographic landscape of the Plastic Pallets Market demonstrates distinct adoption disparities driven by infrastructure readiness and regulatory frameworks.

North America accelerates the deployment of specialized platforms within every major retail distribution hub, yielding a 25% higher asset recovery rate than competing regions.

In contrast, APAC experiences rapid modernization of export corridors, prioritizing phytosanitary compliance to bypass rigorous chemical treatment mandates required for timber alternatives.

European logistics operators focus heavily on reverse logistics networks, achieving a 40% reduction in transit dead-weight by utilizing the nestable logistics platform that offers substantial tare weight reduction.

Consequently, cold storage facilities in North America report a 20% enhancement in cross-contamination prevention during temperature-sensitive transit.

These regional variations highlight how mature economies leverage excellent static load bearing capacities to lower operational costs, while emerging markets primarily invest in durable load carriers to meet strict international shipping standards.

Market Dynamics

Our researchers analyzed the data with 2025 as the base year, along with the key drivers, trends, and challenges. A holistic analysis of drivers will help companies refine their marketing strategies to gain a competitive advantage.

  • Modern commercial distribution relies heavily on durable material handling systems to streamline operations and ensure rigorous safety standards across international borders. As organizations transition toward sustainable practices, the implementation of circular supply chain asset management has become fundamentally important.
  • By tracking and reusing high-density polymer platforms, enterprises experience an estimated 35% improvement in lifecycle resource utilization relative to traditional single-use packaging. This optimization is highly visible in temperature-sensitive sectors, where the heavy duty pharmaceutical cold chain requires pristine, non-absorbent surfaces to maintain product integrity and prevent microbial growth during extended transit periods.
  • Concurrently, international trade regulations demand robust solutions for export shipping compliance standardization, allowing companies to seamlessly bypass the complex fumigation and quarantine protocols associated with wooden crates. Operational planning within large-scale retail environments further benefits from specialized rackable load carrier configurations, which maximize vertical storage efficiency without compromising structural safety under massive weight loads.
  • As a result, automated fulfillment center inventory throughput increases by approximately 20%, as the dimensional consistency of these advanced platforms prevents conveyor disruptions and robotic handling errors. Through strategic adoption of these optimized logistical assets, supply chain directors effectively balance upfront infrastructure investments with long-term operational cost reductions.
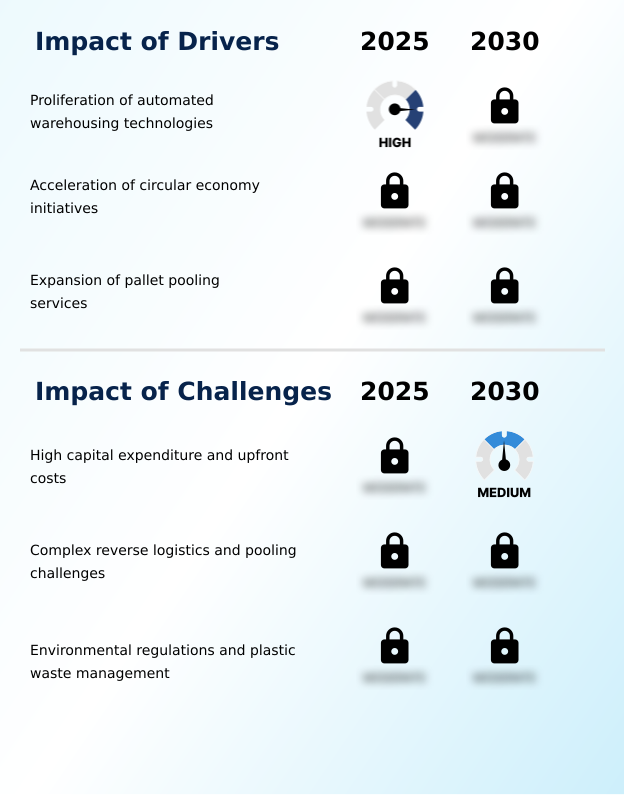
What are the key market drivers leading to the rise in the adoption of Plastic Pallets Industry?

  • The rapid proliferation of automated warehousing technologies serves as a primary catalyst, propelling the demand for dimensionally stable material handling platforms.

  • The exponential expansion of multi-channel fulfillment and the requisite automation of warehousing infrastructure act as principal demand catalysts for precision-engineered load carriers. Modern distribution centers deploy sophisticated robotic handling equipment that requires absolute dimensional stability to function without interruption.
  • By transitioning to polymer platforms featuring high impact resistance and a superior dynamic load rating, facility managers achieve a 20% reduction in automated conveyor downtime.
  • Furthermore, the exceptional structural design of these units maximizes vertical storage capacity, allowing operators to increase warehouse density by up to 15%. This reliability is essential for navigating the complex last-mile delivery network and supporting freight optimization.
  • Within cold chain logistics, these durable assets directly facilitate a 30% enhancement in cargo spoilage reduction for perishable goods, eliminating the costly inefficiencies associated with legacy wooden pallets.

What are the market trends shaping the Plastic Pallets Industry?

  • The enforcement of strict hygiene standards within the pharmaceutical sector represents a definitive market trend. This development drives the widespread adoption of sterile, non-porous material handling solutions to ensure regulatory compliance.

  • The continuous integration of intelligent tracking technologies and clean materials is reshaping modern material handling infrastructure. Logistics operators increasingly deploy the antimicrobial platform to secure sensitive biomedical shipments, yielding a 40% decrease in contamination-related product rejections compared to standard wooden units. Concurrently, the implementation of radio-frequency identification and bluetooth low energy sensors fundamentally enhances fleet management efficiency.
  • This direct asset tracking integration provides real-time data that aids in strategic transit bottleneck mitigation and bolsters overall supply chain resilience. Because these advanced polymer structures interface perfectly with retrieval systems, warehouse facilities observe a 25% improvement in inventory turnover and a significant drop in mechanical jamming.
  • These transformative shifts occur as corporate boards mandate strict carbon footprint reduction protocols, driving the adoption of fully recyclable platforms.

What challenges does the Plastic Pallets Industry face during its growth?

  • High capital expenditure and significant upfront acquisition costs present substantial financial barriers that constrain rapid adoption among cost-sensitive logistics operators.

  • The transition toward advanced material handling solutions is heavily constrained by substantial upfront acquisition costs and raw material price volatility. Procuring a specialized compression molded base engineered through high-tonnage injection molding requires a capital investment significantly higher than purchasing traditional timber.
  • Developing a high-performance polypropylene formulation integrated with post-consumer recycled resin remains expensive, deterring immediate adoption among smaller logistics providers despite alignment with the circular economy framework. Furthermore, the financial viability of returnable transport packaging relies entirely on highly efficient closed-loop pooling systems. When shipping partners fail to return empty assets, pooling companies experience a 25% increase in inventory replacement expenses.
  • Inefficient yard management operation across developing commercial regions exacerbates this issue, elevating the total cost of ownership and disrupting the steady flow of goods through automated sortation machinery.

Exclusive Technavio Analysis on Customer Landscape

The plastic pallets market forecasting report includes the adoption lifecycle of the market, covering from the innovator’s stage to the laggard’s stage. It focuses on adoption rates in different regions based on penetration. Furthermore, the plastic pallets market report also includes key purchase criteria and drivers of price sensitivity to help companies evaluate and develop their market growth analysis strategies.
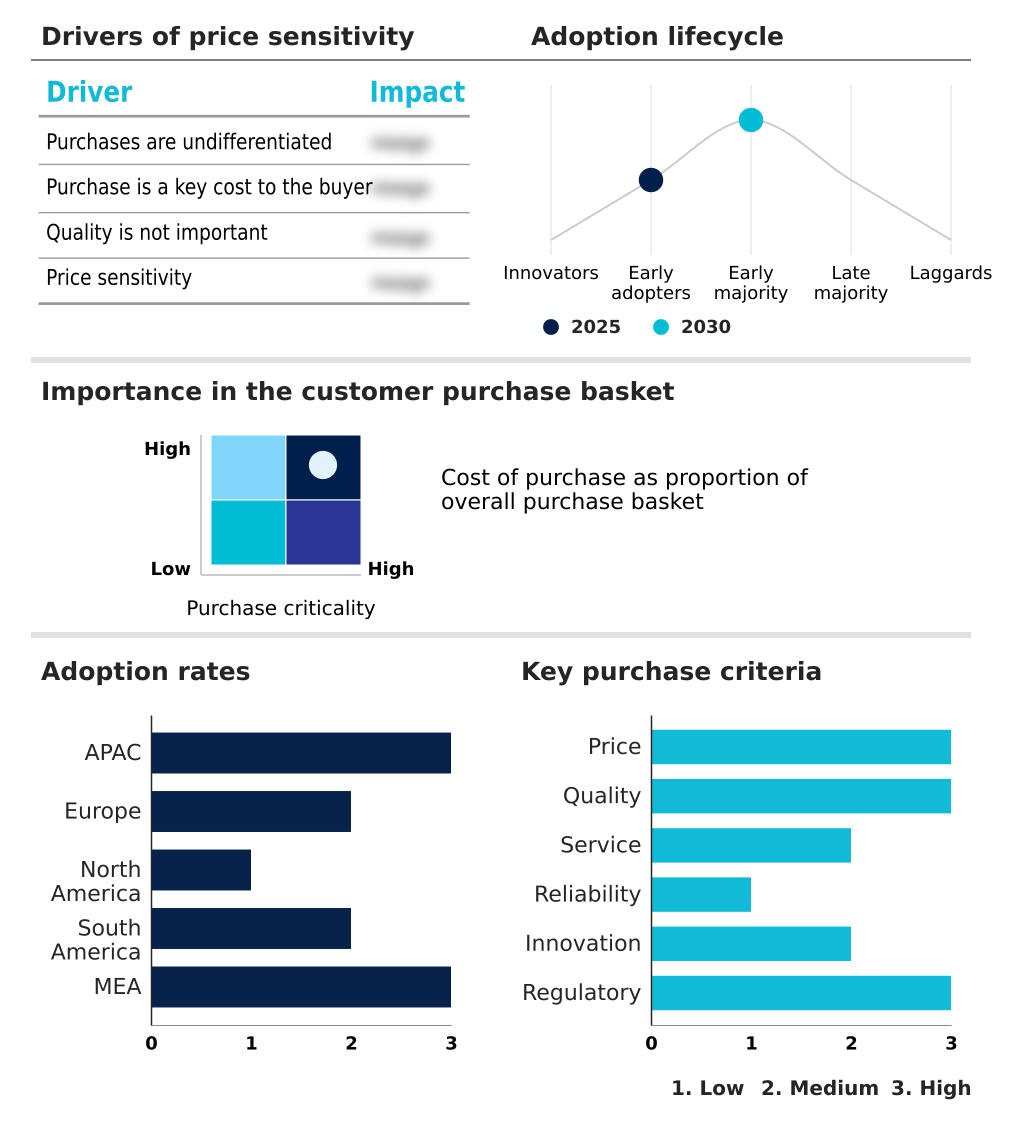
Customer Landscape of Plastic Pallets Industry

Competitive Landscape

Companies are implementing various strategies, such as strategic alliances, plastic pallets market forecast, partnerships, mergers and acquisitions, geographical expansion, and product/service launches, to enhance their presence in the industry.

AUER GmbH - Providers supply a comprehensive range of resilient material handling platforms, including versatile and flat configurations designed to optimize warehouse storage efficiency and support automated supply chain logistics seamlessly.

The industry research and growth report includes detailed analyses of the competitive landscape of the market and information about key companies, including:

  • AUER GmbH
  • Buckhorn Inc.
  • CABKA Group GmbH
  • CHEP
  • Craemer GmbH
  • Georg Utz Holding AG
  • Greystone Logistics Inc.
  • IPL Plastics
  • IPP
  • Kamps Inc.
  • Loscam International Holdings
  • Nelson Co.
  • Nilkamal Ltd.
  • ORBIS Corp.
  • Q Pall
  • Rehrig Pacific Co.
  • Saeplast
  • Schoeller Allibert
  • Smart Flow
  • T.M. Fitzgerald and Associates

Qualitative and quantitative analysis of companies has been conducted to help clients understand the wider business environment as well as the strengths and weaknesses of key industry players. Data is qualitatively analyzed to categorize companies as pure play, category-focused, industry-focused, and diversified; it is quantitatively analyzed to categorize companies as dominant, leading, strong, tentative, and weak.

Recent Development and News in Plastic pallets market

  • In the Metal, Glass and Plastic Containers industry, the transition toward advanced injection molding techniques has drastically improved structural consistency, directly impacting Global Plastic Pallets Market 2026-2030 demand by enabling 20% faster processing on automated sortation machinery.
  • Stringent European Union packaging waste directives have mandated higher usage of post-consumer recycled plastics, forcing suppliers to redesign returnable transport packaging and subsequently increasing adoption of sustainable material recovery platforms by 35%.
  • The accelerated deployment of integrated IOT sensors across bulk packaging operations has enhanced supply chain resilience, driving a 25% surge in orders for precision-molded platforms featuring embedded tracking cavities.
  • Expansions in temperature-controlled biopharmaceutical transit have established new compliance thresholds for sterile packaging, amplifying the need for cross-contamination prevention and resulting in a 40% rise in demand for clean load carriers within cold chain logistics.

Dive into Technavio’s robust research methodology, blending expert interviews, extensive data synthesis, and validated models for unparalleled Plastic Pallets Market insights. See full methodology.

Market Scope
Page number 300
Base year 2025
Historic period 2020-2024
Forecast period 2026-2030
Growth momentum & CAGR Accelerate at a CAGR of 3.9%
Market growth 2026-2030 USD 1440.5 million
Market structure Fragmented
YoY growth 2025-2026(%) 3.7%
Key countries China, Japan, India, South Korea, Australia, Indonesia, Germany, UK, France, Italy, Spain, The Netherlands, US, Canada, Mexico, Brazil, Argentina, Chile, Saudi Arabia, UAE, South Africa, Israel and Turkey
Competitive landscape Leading Companies, Market Positioning of Companies, Competitive Strategies, and Industry Risks

Request Free Sample

Research Analyst Overview

  • The Plastic Pallets Market is undergoing a rapid evolution as global supply chains demand greater durability, visibility, and environmental compliance. Strategic boardroom decisions now prioritize the integration of embedded radio-frequency identification and bluetooth low energy tracking modules directly into asset fleets to optimize inventory visibility.
  • By deploying these connected assets, logistics providers have achieved a 30% reduction in equipment loss and misrouting incidents compared to unmonitored baseline fleets. Advanced manufacturing techniques yield superior impact resistance and an enhanced dynamic load rating, enabling platforms to withstand the intense mechanical stresses of automated sorting facilities.
  • Furthermore, a highly optimized static load bearing capacity ensures safe vertical storage of heavy industrial commodities without structural deflection. Executives focused on cost-efficiency heavily favor the nestable logistics platform, which leverages significant tare weight reduction to minimize reverse transportation expenditures.
  • This technological shift is particularly vital for temperature-sensitive transit, where structural integrity and contamination prevention are paramount for maintaining regulatory adherence.

What are the Key Data Covered in this Plastic Pallets Market Research and Growth Report?

  • What is the expected growth of the Plastic Pallets Market between 2026 and 2030?

    • USD 1.44 billion, at a CAGR of 3.9%

  • What segmentation does the market report cover?

    • The report is segmented by Material (HDPE, and PP), Type (Rackable, Nestable, Stackable, and Others), End-user (Food and beverages, Chemicals, Pharmaceuticals, Automotive, and Others) and Geography (APAC, Europe, North America, South America, Middle East and Africa)

  • Which regions are analyzed in the report?

    • APAC, Europe, North America, South America and Middle East and Africa

  • What are the key growth drivers and market challenges?

    • Proliferation of automated warehousing technologies, High capital expenditure and upfront costs

  • Who are the major players in the Plastic Pallets Market?

    • AUER GmbH, Buckhorn Inc., CABKA Group GmbH, CHEP, Craemer GmbH, Georg Utz Holding AG, Greystone Logistics Inc., IPL Plastics, IPP, Kamps Inc., Loscam International Holdings, Nelson Co., Nilkamal Ltd., ORBIS Corp., Q Pall, Rehrig Pacific Co., Saeplast, Schoeller Allibert, Smart Flow and T.M. Fitzgerald and Associates

Market Research Insights

  • The Plastic Pallets Market serves as a critical enabler for modern distribution, delivering essential structural consistency required for advanced logistics. Enterprises engaged in multi-channel fulfillment deploy these engineered platforms to streamline complex material handling procedures. Implementing highly durable polymer assets results in a 25% acceleration in inventory turnover rates compared to legacy timber systems.
  • Furthermore, lightweight structural designs facilitate significant freight optimization, lowering transit fuel consumption by an estimated 12% across long-haul delivery routes. This transition profoundly supports industrial waste minimization targets by extending product lifecycles and enabling full recyclability. Supply chain operators continually leverage these high-performance load carriers to enhance operational efficiency, reduce physical cargo damage, and align with stringent international sustainability mandates.

We can help! Our analysts can customize this plastic pallets market research report to meet your requirements.

Get in touch

1. Executive Summary

1.1 Market overview

Executive Summary - Chart on Market Overview
Executive Summary - Data Table on Market Overview
Executive Summary - Chart on Global Market Characteristics
Executive Summary - Chart on Market by Geography
Executive Summary - Chart on Market Segmentation by Material
Executive Summary - Chart on Market Segmentation by Type
Executive Summary - Chart on Market Segmentation by End-user
Executive Summary - Chart on Incremental Growth
Executive Summary - Data Table on Incremental Growth
Executive Summary - Chart on Company Market Positioning

2. Technavio Analysis

2.1 Analysis of price sensitivity, lifecycle, customer purchase basket, adoption rates, and purchase criteria

2.2 Criticality of inputs and Factors of differentiation

Chart on Overview on criticality of inputs and factors of differentiation

2.3 Factors of disruption

Chart on Overview on factors of disruption

2.4 Impact of drivers and challenges

Chart on Impact of drivers and challenges in 2025 and 2030

3. Market Landscape

3.1 Market ecosystem

Chart on Parent Market
Data Table on - Parent Market

3.2 Market characteristics

Chart on Market characteristics analysis

3.3 Value chain analysis

Chart on Value chain analysis

4. Market Sizing

4.1 Market definition

Data Table on Offerings of companies included in the market definition

4.2 Market segment analysis

Market segments

4.3 Market size 2025

4.4 Market outlook: Forecast for 2025-2030

Chart on Global - Market size and forecast 2025-2030 ($ million)
Data Table on Global - Market size and forecast 2025-2030 ($ million)
Chart on Global Market: Year-over-year growth 2025-2030 (%)
Data Table on Global Market: Year-over-year growth 2025-2030 (%)

5. Historic Market Size

5.1 Global Plastic Pallets Market 2020 - 2024

Historic Market Size - Data Table on Global Plastic Pallets Market 2020 - 2024 ($ million)

5.2 Material segment analysis 2020 - 2024

Historic Market Size - Material Segment 2020 - 2024 ($ million)

5.3 Type segment analysis 2020 - 2024

Historic Market Size - Type Segment 2020 - 2024 ($ million)

5.4 End-user segment analysis 2020 - 2024

Historic Market Size - End-user Segment 2020 - 2024 ($ million)

5.5 Geography segment analysis 2020 - 2024

Historic Market Size - Geography Segment 2020 - 2024 ($ million)

5.6 Country segment analysis 2020 - 2024

Historic Market Size - Country Segment 2020 - 2024 ($ million)

6. Qualitative Analysis

6.1 Impact of AI on Global Plastic Pallets Market

6.2 Impact of geopolitical conflicts on Global Plastic Pallets Market

7. Five Forces Analysis

7.1 Five forces summary

Five forces analysis - Comparison between 2025 and 2030

7.2 Bargaining power of buyers

Bargaining power of buyers - Impact of key factors 2025 and 2030

7.3 Bargaining power of suppliers

Bargaining power of suppliers - Impact of key factors in 2025 and 2030

7.4 Threat of new entrants

Threat of new entrants - Impact of key factors in 2025 and 2030

7.5 Threat of substitutes

Threat of substitutes - Impact of key factors in 2025 and 2030

7.6 Threat of rivalry

Threat of rivalry - Impact of key factors in 2025 and 2030

7.7 Market condition

Chart on Market condition - Five forces 2025 and 2030

8. Market Segmentation by Material

8.1 Market segments

Chart on Material - Market share 2025-2030 (%)
Data Table on Material - Market share 2025-2030 (%)

8.2 Comparison by Material

Chart on Comparison by Material
Data Table on Comparison by Material

8.3 HDPE - Market size and forecast 2025-2030

Chart on HDPE - Market size and forecast 2025-2030 ($ million)
Data Table on HDPE - Market size and forecast 2025-2030 ($ million)
Chart on HDPE - Year-over-year growth 2025-2030 (%)
Data Table on HDPE - Year-over-year growth 2025-2030 (%)

8.4 PP - Market size and forecast 2025-2030

Chart on PP - Market size and forecast 2025-2030 ($ million)
Data Table on PP - Market size and forecast 2025-2030 ($ million)
Chart on PP - Year-over-year growth 2025-2030 (%)
Data Table on PP - Year-over-year growth 2025-2030 (%)

8.5 Market opportunity by Material

Market opportunity by Material ($ million)
Data Table on Market opportunity by Material ($ million)

9. Market Segmentation by Type

9.1 Market segments

Chart on Type - Market share 2025-2030 (%)
Data Table on Type - Market share 2025-2030 (%)

9.2 Comparison by Type

Chart on Comparison by Type
Data Table on Comparison by Type

9.3 Rackable - Market size and forecast 2025-2030

Chart on Rackable - Market size and forecast 2025-2030 ($ million)
Data Table on Rackable - Market size and forecast 2025-2030 ($ million)
Chart on Rackable - Year-over-year growth 2025-2030 (%)
Data Table on Rackable - Year-over-year growth 2025-2030 (%)

9.4 Nestable - Market size and forecast 2025-2030

Chart on Nestable - Market size and forecast 2025-2030 ($ million)
Data Table on Nestable - Market size and forecast 2025-2030 ($ million)
Chart on Nestable - Year-over-year growth 2025-2030 (%)
Data Table on Nestable - Year-over-year growth 2025-2030 (%)

9.5 Stackable - Market size and forecast 2025-2030

Chart on Stackable - Market size and forecast 2025-2030 ($ million)
Data Table on Stackable - Market size and forecast 2025-2030 ($ million)
Chart on Stackable - Year-over-year growth 2025-2030 (%)
Data Table on Stackable - Year-over-year growth 2025-2030 (%)

9.6 Others - Market size and forecast 2025-2030

Chart on Others - Market size and forecast 2025-2030 ($ million)
Data Table on Others - Market size and forecast 2025-2030 ($ million)
Chart on Others - Year-over-year growth 2025-2030 (%)
Data Table on Others - Year-over-year growth 2025-2030 (%)

9.7 Market opportunity by Type

Market opportunity by Type ($ million)
Data Table on Market opportunity by Type ($ million)

10. Market Segmentation by End-user

10.1 Market segments

Chart on End-user - Market share 2025-2030 (%)
Data Table on End-user - Market share 2025-2030 (%)

10.2 Comparison by End-user

Chart on Comparison by End-user
Data Table on Comparison by End-user

10.3 Food and beverages - Market size and forecast 2025-2030

Chart on Food and beverages - Market size and forecast 2025-2030 ($ million)
Data Table on Food and beverages - Market size and forecast 2025-2030 ($ million)
Chart on Food and beverages - Year-over-year growth 2025-2030 (%)
Data Table on Food and beverages - Year-over-year growth 2025-2030 (%)

10.4 Chemicals - Market size and forecast 2025-2030

Chart on Chemicals - Market size and forecast 2025-2030 ($ million)
Data Table on Chemicals - Market size and forecast 2025-2030 ($ million)
Chart on Chemicals - Year-over-year growth 2025-2030 (%)
Data Table on Chemicals - Year-over-year growth 2025-2030 (%)

10.5 Pharmaceuticals - Market size and forecast 2025-2030

Chart on Pharmaceuticals - Market size and forecast 2025-2030 ($ million)
Data Table on Pharmaceuticals - Market size and forecast 2025-2030 ($ million)
Chart on Pharmaceuticals - Year-over-year growth 2025-2030 (%)
Data Table on Pharmaceuticals - Year-over-year growth 2025-2030 (%)

10.6 Automotive - Market size and forecast 2025-2030

Chart on Automotive - Market size and forecast 2025-2030 ($ million)
Data Table on Automotive - Market size and forecast 2025-2030 ($ million)
Chart on Automotive - Year-over-year growth 2025-2030 (%)
Data Table on Automotive - Year-over-year growth 2025-2030 (%)

10.7 Others - Market size and forecast 2025-2030

Chart on Others - Market size and forecast 2025-2030 ($ million)
Data Table on Others - Market size and forecast 2025-2030 ($ million)
Chart on Others - Year-over-year growth 2025-2030 (%)
Data Table on Others - Year-over-year growth 2025-2030 (%)

10.8 Market opportunity by End-user

Market opportunity by End-user ($ million)
Data Table on Market opportunity by End-user ($ million)

11. Customer Landscape

11.1 Customer landscape overview

Analysis of price sensitivity, lifecycle, customer purchase basket, adoption rates, and purchase criteria

12. Geographic Landscape

12.1 Geographic segmentation

Chart on Market share by geography 2025-2030 (%)
Data Table on Market share by geography 2025-2030 (%)

12.2 Geographic comparison

Chart on Geographic comparison
Data Table on Geographic comparison

12.3 APAC - Market size and forecast 2025-2030

Chart on APAC - Market size and forecast 2025-2030 ($ million)
Data Table on APAC - Market size and forecast 2025-2030 ($ million)
Chart on APAC - Year-over-year growth 2025-2030 (%)
Data Table on APAC - Year-over-year growth 2025-2030 (%)
Chart on Regional Comparison - APAC
Data Table on Regional Comparison - APAC

12.3.1 China - Market size and forecast 2025-2030

Chart on China - Market size and forecast 2025-2030 ($ million)
Data Table on China - Market size and forecast 2025-2030 ($ million)
Chart on China - Year-over-year growth 2025-2030 (%)
Data Table on China - Year-over-year growth 2025-2030 (%)

12.3.2 Japan - Market size and forecast 2025-2030

Chart on Japan - Market size and forecast 2025-2030 ($ million)
Data Table on Japan - Market size and forecast 2025-2030 ($ million)
Chart on Japan - Year-over-year growth 2025-2030 (%)
Data Table on Japan - Year-over-year growth 2025-2030 (%)

12.3.3 India - Market size and forecast 2025-2030

Chart on India - Market size and forecast 2025-2030 ($ million)
Data Table on India - Market size and forecast 2025-2030 ($ million)
Chart on India - Year-over-year growth 2025-2030 (%)
Data Table on India - Year-over-year growth 2025-2030 (%)

12.3.4 South Korea - Market size and forecast 2025-2030

Chart on South Korea - Market size and forecast 2025-2030 ($ million)
Data Table on South Korea - Market size and forecast 2025-2030 ($ million)
Chart on South Korea - Year-over-year growth 2025-2030 (%)
Data Table on South Korea - Year-over-year growth 2025-2030 (%)

12.3.5 Australia - Market size and forecast 2025-2030

Chart on Australia - Market size and forecast 2025-2030 ($ million)
Data Table on Australia - Market size and forecast 2025-2030 ($ million)
Chart on Australia - Year-over-year growth 2025-2030 (%)
Data Table on Australia - Year-over-year growth 2025-2030 (%)

12.3.6 Indonesia - Market size and forecast 2025-2030

Chart on Indonesia - Market size and forecast 2025-2030 ($ million)
Data Table on Indonesia - Market size and forecast 2025-2030 ($ million)
Chart on Indonesia - Year-over-year growth 2025-2030 (%)
Data Table on Indonesia - Year-over-year growth 2025-2030 (%)

12.4 Europe - Market size and forecast 2025-2030

Chart on Europe - Market size and forecast 2025-2030 ($ million)
Data Table on Europe - Market size and forecast 2025-2030 ($ million)
Chart on Europe - Year-over-year growth 2025-2030 (%)
Data Table on Europe - Year-over-year growth 2025-2030 (%)
Chart on Regional Comparison - Europe
Data Table on Regional Comparison - Europe

12.4.1 Germany - Market size and forecast 2025-2030

Chart on Germany - Market size and forecast 2025-2030 ($ million)
Data Table on Germany - Market size and forecast 2025-2030 ($ million)
Chart on Germany - Year-over-year growth 2025-2030 (%)
Data Table on Germany - Year-over-year growth 2025-2030 (%)

12.4.2 UK - Market size and forecast 2025-2030

Chart on UK - Market size and forecast 2025-2030 ($ million)
Data Table on UK - Market size and forecast 2025-2030 ($ million)
Chart on UK - Year-over-year growth 2025-2030 (%)
Data Table on UK - Year-over-year growth 2025-2030 (%)

12.4.3 France - Market size and forecast 2025-2030

Chart on France - Market size and forecast 2025-2030 ($ million)
Data Table on France - Market size and forecast 2025-2030 ($ million)
Chart on France - Year-over-year growth 2025-2030 (%)
Data Table on France - Year-over-year growth 2025-2030 (%)

12.4.4 Italy - Market size and forecast 2025-2030

Chart on Italy - Market size and forecast 2025-2030 ($ million)
Data Table on Italy - Market size and forecast 2025-2030 ($ million)
Chart on Italy - Year-over-year growth 2025-2030 (%)
Data Table on Italy - Year-over-year growth 2025-2030 (%)

12.4.5 Spain - Market size and forecast 2025-2030

Chart on Spain - Market size and forecast 2025-2030 ($ million)
Data Table on Spain - Market size and forecast 2025-2030 ($ million)
Chart on Spain - Year-over-year growth 2025-2030 (%)
Data Table on Spain - Year-over-year growth 2025-2030 (%)

12.4.6 The Netherlands - Market size and forecast 2025-2030

Chart on The Netherlands - Market size and forecast 2025-2030 ($ million)
Data Table on The Netherlands - Market size and forecast 2025-2030 ($ million)
Chart on The Netherlands - Year-over-year growth 2025-2030 (%)
Data Table on The Netherlands - Year-over-year growth 2025-2030 (%)

12.5 North America - Market size and forecast 2025-2030

Chart on North America - Market size and forecast 2025-2030 ($ million)
Data Table on North America - Market size and forecast 2025-2030 ($ million)
Chart on North America - Year-over-year growth 2025-2030 (%)
Data Table on North America - Year-over-year growth 2025-2030 (%)
Chart on Regional Comparison - North America
Data Table on Regional Comparison - North America

12.5.1 US - Market size and forecast 2025-2030

Chart on US - Market size and forecast 2025-2030 ($ million)
Data Table on US - Market size and forecast 2025-2030 ($ million)
Chart on US - Year-over-year growth 2025-2030 (%)
Data Table on US - Year-over-year growth 2025-2030 (%)

12.5.2 Canada - Market size and forecast 2025-2030

Chart on Canada - Market size and forecast 2025-2030 ($ million)
Data Table on Canada - Market size and forecast 2025-2030 ($ million)
Chart on Canada - Year-over-year growth 2025-2030 (%)
Data Table on Canada - Year-over-year growth 2025-2030 (%)

12.5.3 Mexico - Market size and forecast 2025-2030

Chart on Mexico - Market size and forecast 2025-2030 ($ million)
Data Table on Mexico - Market size and forecast 2025-2030 ($ million)
Chart on Mexico - Year-over-year growth 2025-2030 (%)
Data Table on Mexico - Year-over-year growth 2025-2030 (%)

12.6 South America - Market size and forecast 2025-2030

Chart on South America - Market size and forecast 2025-2030 ($ million)
Data Table on South America - Market size and forecast 2025-2030 ($ million)
Chart on South America - Year-over-year growth 2025-2030 (%)
Data Table on South America - Year-over-year growth 2025-2030 (%)
Chart on Regional Comparison - South America
Data Table on Regional Comparison - South America

12.6.1 Brazil - Market size and forecast 2025-2030

Chart on Brazil - Market size and forecast 2025-2030 ($ million)
Data Table on Brazil - Market size and forecast 2025-2030 ($ million)
Chart on Brazil - Year-over-year growth 2025-2030 (%)
Data Table on Brazil - Year-over-year growth 2025-2030 (%)

12.6.2 Argentina - Market size and forecast 2025-2030

Chart on Argentina - Market size and forecast 2025-2030 ($ million)
Data Table on Argentina - Market size and forecast 2025-2030 ($ million)
Chart on Argentina - Year-over-year growth 2025-2030 (%)
Data Table on Argentina - Year-over-year growth 2025-2030 (%)

12.6.3 Chile - Market size and forecast 2025-2030

Chart on Chile - Market size and forecast 2025-2030 ($ million)
Data Table on Chile - Market size and forecast 2025-2030 ($ million)
Chart on Chile - Year-over-year growth 2025-2030 (%)
Data Table on Chile - Year-over-year growth 2025-2030 (%)

12.7 Middle East and Africa - Market size and forecast 2025-2030

Chart on Middle East and Africa - Market size and forecast 2025-2030 ($ million)
Data Table on Middle East and Africa - Market size and forecast 2025-2030 ($ million)
Chart on Middle East and Africa - Year-over-year growth 2025-2030 (%)
Data Table on Middle East and Africa - Year-over-year growth 2025-2030 (%)
Chart on Regional Comparison - Middle East and Africa
Data Table on Regional Comparison - Middle East and Africa

12.7.1 Saudi Arabia - Market size and forecast 2025-2030

Chart on Saudi Arabia - Market size and forecast 2025-2030 ($ million)
Data Table on Saudi Arabia - Market size and forecast 2025-2030 ($ million)
Chart on Saudi Arabia - Year-over-year growth 2025-2030 (%)
Data Table on Saudi Arabia - Year-over-year growth 2025-2030 (%)

12.7.2 UAE - Market size and forecast 2025-2030

Chart on UAE - Market size and forecast 2025-2030 ($ million)
Data Table on UAE - Market size and forecast 2025-2030 ($ million)
Chart on UAE - Year-over-year growth 2025-2030 (%)
Data Table on UAE - Year-over-year growth 2025-2030 (%)

12.7.3 South Africa - Market size and forecast 2025-2030

Chart on South Africa - Market size and forecast 2025-2030 ($ million)
Data Table on South Africa - Market size and forecast 2025-2030 ($ million)
Chart on South Africa - Year-over-year growth 2025-2030 (%)
Data Table on South Africa - Year-over-year growth 2025-2030 (%)

12.7.4 Israel - Market size and forecast 2025-2030

Chart on Israel - Market size and forecast 2025-2030 ($ million)
Data Table on Israel - Market size and forecast 2025-2030 ($ million)
Chart on Israel - Year-over-year growth 2025-2030 (%)
Data Table on Israel - Year-over-year growth 2025-2030 (%)

12.7.5 Turkey - Market size and forecast 2025-2030

Chart on Turkey - Market size and forecast 2025-2030 ($ million)
Data Table on Turkey - Market size and forecast 2025-2030 ($ million)
Chart on Turkey - Year-over-year growth 2025-2030 (%)
Data Table on Turkey - Year-over-year growth 2025-2030 (%)

12.8 Market opportunity by geography

Market opportunity by geography ($ million)
Data Tables on Market opportunity by geography ($ million)

13. Drivers, Challenges, and Opportunity

13.1 Market drivers

Proliferation of automated warehousing technologies
Acceleration of circular economy initiatives
Expansion of pallet pooling services

13.2 Market challenges

High capital expenditure and upfront costs
Complex reverse logistics and pooling challenges
Environmental regulations and plastic waste management

13.3 Impact of drivers and challenges

Impact of drivers and challenges in 2025 and 2030

13.4 Market opportunities

Strict hygiene standards in pharmaceuticals
Growth of smart tracking technologies
Proliferation of E-commerce fulfillment networks

14. Competitive Landscape

14.1 Overview

14.2

Overview on criticality of inputs and factors of differentiation

14.3 Landscape disruption

Overview on factors of disruption

14.4 Industry risks

Impact of key risks on business

15. Competitive Analysis

15.1 Companies profiled

Companies covered

15.2 Company ranking index

15.3 Market positioning of companies

Matrix on companies position and classification

15.4 AUER GmbH

AUER GmbH - Overview
AUER GmbH - Product / Service
AUER GmbH - Key offerings
SWOT

15.5 Buckhorn Inc.

Buckhorn Inc. - Overview
Buckhorn Inc. - Product / Service
Buckhorn Inc. - Key offerings
SWOT

15.6 CHEP

CHEP - Overview
CHEP - Product / Service
CHEP - Key offerings
SWOT

15.7 Craemer GmbH

Craemer GmbH - Overview
Craemer GmbH - Product / Service
Craemer GmbH - Key offerings
SWOT

15.8 Greystone Logistics Inc.

Greystone Logistics Inc. - Overview
Greystone Logistics Inc. - Product / Service
Greystone Logistics Inc. - Key offerings
SWOT

15.9 IPL Plastics

IPL Plastics - Overview
IPL Plastics - Product / Service
IPL Plastics - Key offerings
SWOT

15.10 IPP

IPP - Overview
IPP - Product / Service
IPP - Key offerings
SWOT

15.11 Loscam International Holdings

Loscam International Holdings - Overview
Loscam International Holdings - Product / Service
Loscam International Holdings - Key offerings
SWOT

15.12 Nelson Co.

Nelson Co. - Overview
Nelson Co. - Product / Service
Nelson Co. - Key offerings
SWOT

15.13 Nilkamal Ltd.

Nilkamal Ltd. - Overview
Nilkamal Ltd. - Product / Service
Nilkamal Ltd. - Key offerings
SWOT

15.14 ORBIS Corp.

ORBIS Corp. - Overview
ORBIS Corp. - Product / Service
ORBIS Corp. - Key offerings
SWOT

15.15 Rehrig Pacific Co.

Rehrig Pacific Co. - Overview
Rehrig Pacific Co. - Product / Service
Rehrig Pacific Co. - Key offerings
SWOT

15.16 Saeplast

Saeplast - Overview
Saeplast - Product / Service
Saeplast - Key offerings
SWOT

15.17 Schoeller Allibert

Schoeller Allibert - Overview
Schoeller Allibert - Product / Service
Schoeller Allibert - Key offerings
SWOT

15.18 Smart Flow

Smart Flow - Overview
Smart Flow - Product / Service
Smart Flow - Key offerings
SWOT

16. Appendix

16.1 Scope of the report

Market definition
Objectives
Notes and caveats

16.2 Inclusions and exclusions checklist

Inclusions checklist
Exclusions checklist

16.3 Currency conversion rates for US$

16.4 Research methodology

16.5 Data procurement

Information sources

16.6 Data validation

16.7 Validation techniques employed for market sizing

16.8 Data synthesis

16.9 360 degree market analysis

16.10 List of abbreviations

Research Methodology

Technavio presents a detailed picture of the market by way of study, synthesis, and summation of data from multiple sources. The analysts have presented the various facets of the market with a particular focus on identifying the key industry influencers. The data thus presented is comprehensive, reliable, and the result of extensive research, both primary and secondary.

INFORMATION SOURCES

Primary sources

  • Manufacturers and suppliers
  • Channel partners
  • Industry experts
  • Strategic decision makers

Secondary sources

  • Industry journals and periodicals
  • Government data
  • Financial reports of key industry players
  • Historical data
  • Press releases

DATA ANALYSIS

Data Synthesis

  • Collation of data
  • Estimation of key figures
  • Analysis of derived insights

Data Validation

  • Triangulation with data models
  • Reference against proprietary databases
  • Corroboration with industry experts

REPORT WRITING

Qualitative

  • Market drivers
  • Market challenges
  • Market trends
  • Five forces analysis

Quantitative

  • Market size and forecast
  • Market segmentation
  • Geographical insights
  • Competitive landscape

Interested in this report?

Get your sample now to see our research methodology and insights!

Download Now

Frequently Asked Questions

Plastic Pallets market growth will increase by USD 1440.5 million during 2026-2030.

The Plastic Pallets market is expected to grow at a CAGR of 3.9% during 2026-2030.

Plastic Pallets market is segmented by Material (HDPE, PP) Type (Rackable, Nestable, Stackable, Others) End-user (Food and beverages, Chemicals, Pharmaceuticals, Automotive, Others)

AUER GmbH, Buckhorn Inc., CABKA Group GmbH, CHEP, Craemer GmbH, Georg Utz Holding AG, Greystone Logistics Inc., IPL Plastics, IPP, Kamps Inc., Loscam International Holdings, Nelson Co., Nilkamal Ltd., ORBIS Corp., Q Pall, Rehrig Pacific Co., Saeplast, Schoeller Allibert, Smart Flow, T.M. Fitzgerald and Associates are a few of the key vendors in the Plastic Pallets market.

APAC will register the highest growth rate of 41.3% among the other regions. Therefore, the Plastic Pallets market in APAC is expected to garner significant business opportunities for the vendors during the forecast period.

China, Japan, India, South Korea, Australia, Indonesia, Germany, UK, France, Italy, Spain, The Netherlands, US, Canada, Mexico, Brazil, Argentina, Chile, Saudi Arabia, UAE, South Africa, Israel, Turkey

  • Proliferation of automated warehousing technologies is the driving factor this market.

The Plastic Pallets market vendors should focus on grabbing business opportunities from the Material segment as it accounted for the largest market share in the base year.
RIA - Research AI Assistant
Ask RIA
