Ports And Terminal Operations Market Analysis, Size, and Forecast 2026-2030: APAC (China, South Korea, and Japan), Europe (The Netherlands, Germany, and UK), North America (US, Canada, and Mexico), Middle East and Africa (UAE, Saudi Arabia, and South Africa), South America (Brazil and Argentina), and Rest of World (ROW)

Ports And Terminal Operations Market Analysis, Size, and Forecast 2026-2030:
APAC (China, South Korea, and Japan), Europe (The Netherlands, Germany, and UK), North America (US, Canada, and Mexico), Middle East and Africa (UAE, Saudi Arabia, and South Africa), South America (Brazil and Argentina), and Rest of World (ROW)

Published: Mar 2026 298 Pages SKU: IRTNTR43309

Market Overview at a Glance

$41.25 B
Market Opportunity
7.7%
CAGR 2025 - 2030
66.4%
APAC Growth
$22.97 B
Food transportation segment 2024

Ports And Terminal Operations Market Size 2026-2030

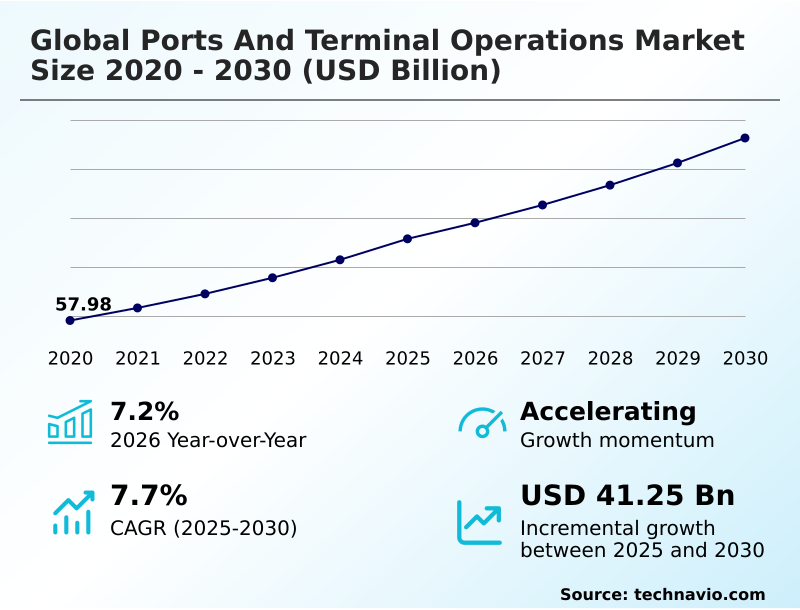
The ports and terminal operations market size is valued to increase by USD 41.25 billion, at a CAGR of 7.7% from 2025 to 2030. Growing adoption of containerization will drive the ports and terminal operations market.

Major Market Trends & Insights

  • APAC dominated the market and accounted for a 66.4% growth during the forecast period.
  • By Application - Food transportation segment was valued at USD 22.97 billion in 2024
  • By Service Type - Stevedoring segment accounted for the largest market revenue share in 2024

Market Size & Forecast

  • Market Opportunities: USD 74.66 billion
  • Market Future Opportunities: USD 41.25 billion
  • CAGR from 2025 to 2030 : 7.7%

Market Summary

  • The ports and terminal operations market is undergoing a significant transformation, driven by the dual imperatives of technological integration and environmental sustainability. As the backbone of international trade, these facilities are evolving from simple transit points into sophisticated logistics hubs powered by automation and data analytics.
  • A key driver is the relentless push for efficiency, compelling operators to adopt advanced technologies like AI and IoT to optimize everything from vessel berthing to yard management.
  • For instance, a terminal operator can leverage a digital twin of its facility to simulate different cargo flow scenarios, identifying and mitigating potential bottlenecks before they occur, which significantly reduces vessel idle times and fuel consumption. This shift toward smart, connected ecosystems is not merely a trend but a strategic necessity.
  • However, this evolution is constrained by challenges such as the high capital expenditure required for infrastructure modernization and the complexities of integrating new digital platforms with legacy systems. The increasing size of container vessels further strains existing capacity, making congestion a persistent operational risk that demands innovative management solutions to ensure the fluid movement of global commerce.

What will be the Size of the Ports And Terminal Operations Market during the forecast period?

Get Key Insights on Market Forecast (PDF) Request Free Sample

How is the Ports And Terminal Operations Market Segmented?

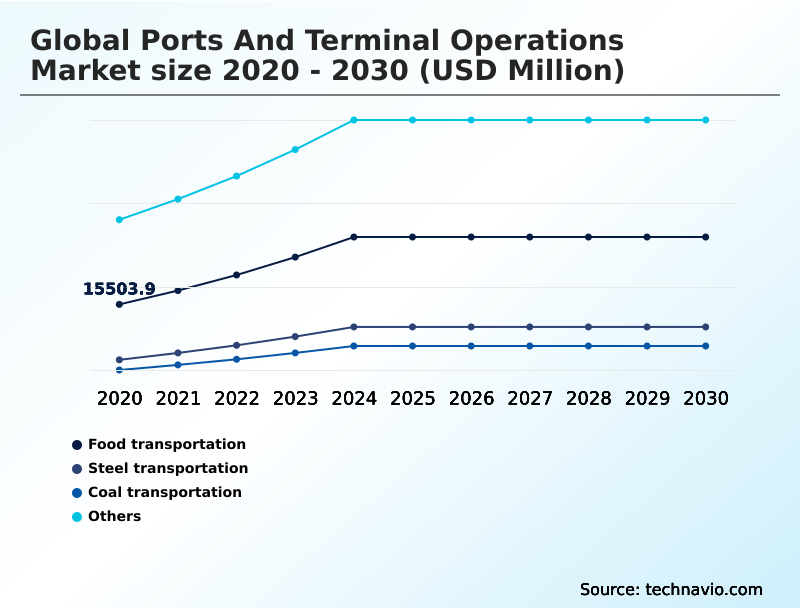
The ports and terminal operations industry research report provides comprehensive data (region-wise segment analysis), with forecasts and estimates in "USD million" for the period 2026-2030, as well as historical data from 2020-2024 for the following segments.

  • Application
    • Food transportation
    • Steel transportation
    • Coal transportation
    • Others
  • Service type
    • Stevedoring
    • Cargo handling and transportation
    • Others
  • Technology
    • Automation and robotics
    • Port management software
    • Smart ports
  • Geography
    • APAC
      • China
      • South Korea
      • Japan
    • Europe
      • The Netherlands
      • Germany
      • UK
    • North America
      • US
      • Canada
      • Mexico
    • Middle East and Africa
      • UAE
      • Saudi Arabia
      • South Africa
    • South America
      • Brazil
      • Argentina
    • Rest of World (ROW)

By Application Insights

The food transportation segment is estimated to witness significant growth during the forecast period.

The food transportation segment is critical within the global ports and terminal operations market, where cold chain logistics and specialized infrastructure are paramount.

Efficient cargo handling efficiency and stevedoring of perishable goods are vital, using refrigerated containers to prevent spoilage and ensure supply chain visibility.

Terminal operators are investing in automated stacking cranes and advanced port management software to enhance vessel turnaround times, with some achieving a 15% reduction in cargo spoilage through improved resource allocation.

This focus on sustainable port operations and asset utilization is key for managing breakbulk cargo and ensuring food security. The intricate logistics synchronization required for these operations underscores the need for continuous maritime infrastructure development to support global trade.

Request Free Sample

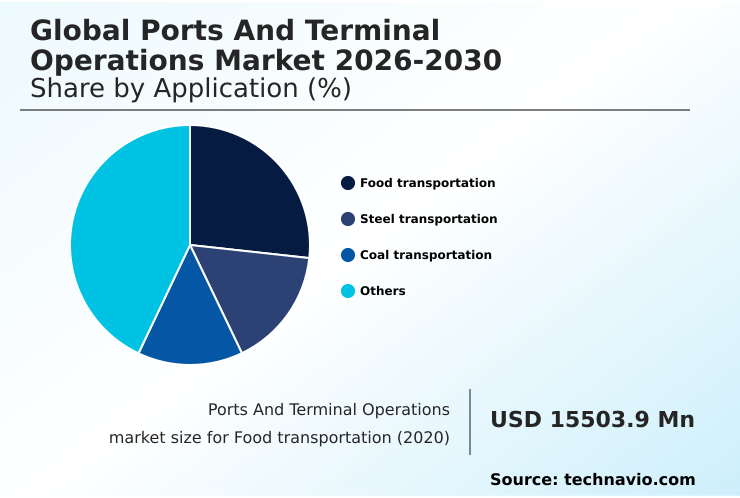
The Food transportation segment was valued at USD 22.97 billion in 2024 and showed a gradual increase during the forecast period.

Request Free Sample

Regional Analysis

APAC is estimated to contribute 66.4% to the growth of the global market during the forecast period.Technavio’s analysts have elaborately explained the regional trends and drivers that shape the market during the forecast period.

See How Ports And Terminal Operations Market Demand is Rising in APAC Request Free Sample

The geographic landscape is dominated by the APAC region, which accounts for over 66% of the market’s incremental growth, driven by manufacturing and trade volumes in countries like China. North America follows, contributing approximately 10% to the growth.

Ports in these regions are focused on enhancing intermodal connectivity and implementing shore power solutions to meet sustainability targets.

The expansion of facilities in emerging markets is crucial for strengthening global supply chains and facilitating the movement of Ro-Ro cargo services.

This requires continuous investment in dredging programs and the deployment of maritime single window systems to streamline operations and improve gate automation and predictive maintenance, ultimately supporting global economic stability.

Market Dynamics

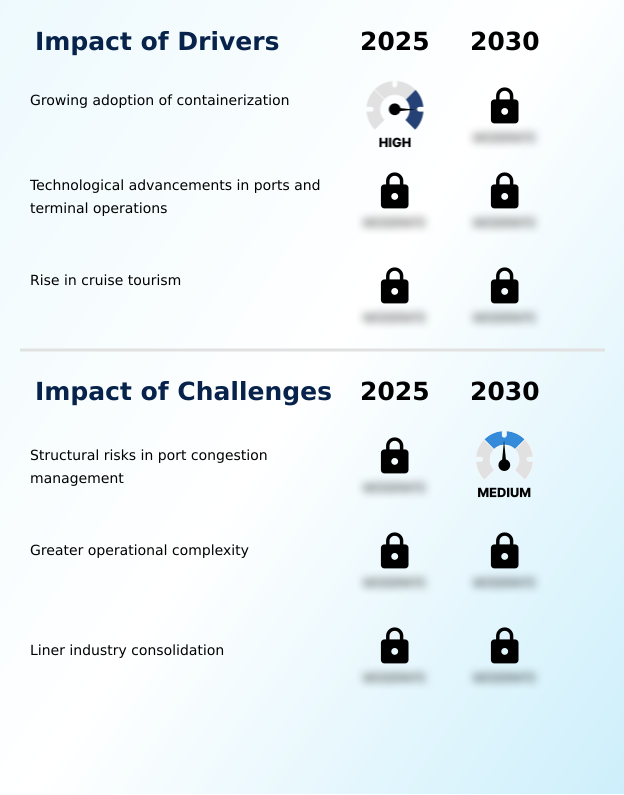
Our researchers analyzed the data with 2025 as the base year, along with the key drivers, trends, and challenges. A holistic analysis of drivers will help companies refine their marketing strategies to gain a competitive advantage.

  • Strategic decision-making in the global ports and terminal operations market is increasingly focused on the ROI of shore power infrastructure investment and the overall impact of automation on terminal throughput. Operators are closely evaluating the cost-benefit of automated stacking cranes and other technologies to enhance vessel turnaround times with technology.
  • A key area of analysis is the role of blockchain in cargo traceability, which promises to revolutionize how goods are tracked and documented. As terminals evolve, understanding the challenges in green hydrogen bunkering and developing effective decarbonization strategies for port operations become critical.
  • The implementation of a maritime single window offers significant benefits, but integrating terminal operating systems with port community systems remains a complex task. Terminals that successfully navigate these challenges, such as by leveraging a digital twin for port congestion simulation, are reporting efficiency gains nearly double those of competitors.
  • Other important considerations include improving hinterland connectivity for ports, weighing breakbulk vs. containerized cargo handling methods, and establishing robust security protocols for smart port ecosystems. The ongoing liner industry consolidation impact forces a re-evaluation of supply chain resilience through port diversification and highlights the need for advanced stevedoring efficiency.
  • Finally, optimizing yard management with AI and investing in RTLS for asset tracking in terminals are becoming standard practice for competitive advantage.

What are the key market drivers leading to the rise in the adoption of Ports And Terminal Operations Industry?

  • The growing adoption of containerization is a key driver for the global ports and terminal operations market, enhancing cargo handling efficiency and enabling economies of scale.

  • The growing adoption of containerization is a primary driver, enabling economies of scale with mega-vessels that increase cargo capacity by over 30%.
  • This trend necessitates significant port-led development and investment in advanced quay cranes and automated guided vehicles (AGVs) to maintain efficiency. Technological advancements are transforming terminals into smart logistics hubs, where automation and robotics improve safety and accuracy.
  • The use of terminal operating systems (TOS) with AI-driven planning software boosts inventory management and operational flow.
  • This synergy between physical infrastructure and digital tools supports green shipping corridors and enhances multimodal transport integration, ultimately strengthening the backbone of global trade.

What are the market trends shaping the Ports And Terminal Operations Industry?

  • The emergence of real-time location systems (RTLS) represents a significant upcoming trend. This technology is set to enhance operational visibility and efficiency across terminal operations.

  • The emergence of real-time location systems (RTLS) and smart contracts is redefining cargo traceability within the global ports and terminal operations market. These technologies enhance port congestion mitigation by providing precise data for berth optimization and yard planning.
  • The integration of blockchain technology into port community systems ensures secure and transparent data exchange, with pilot programs demonstrating a 40% reduction in documentation processing times. This shift toward digital twin technology allows operators to simulate and refine workflows, improving demurrage cost reduction efforts.
  • As terminals advance toward becoming fully connected ecosystems, these trends are foundational for achieving superior terminal throughput and operational resilience against supply chain disruptions, reinforcing the importance of cybersecurity in ports.

What challenges does the Ports And Terminal Operations Industry face during its growth?

  • Structural risks associated with port congestion management pose a key challenge to the growth of the ports and terminal operations industry, impacting supply chain reliability.

  • Managing structural risks in port congestion remains a formidable challenge, intensified by vessel bunching and strained hinterland connectivity. The operational complexity of coordinating drayage trucks, rail, and massive crane operations is increasing, with disruptions in one area causing cascading delays. Liner industry consolidation adds another layer of pressure, impacting long-term planning for transshipment hubs.
  • Integrating new zero-emission port equipment with legacy systems can delay projects by up to 20%, impacting decarbonization goals. The landlord port model and the need for a skilled workforce to manage sophisticated systems for dry bulk handling and liquid bulk handling present ongoing hurdles for operators aiming to maintain seamless service delivery.

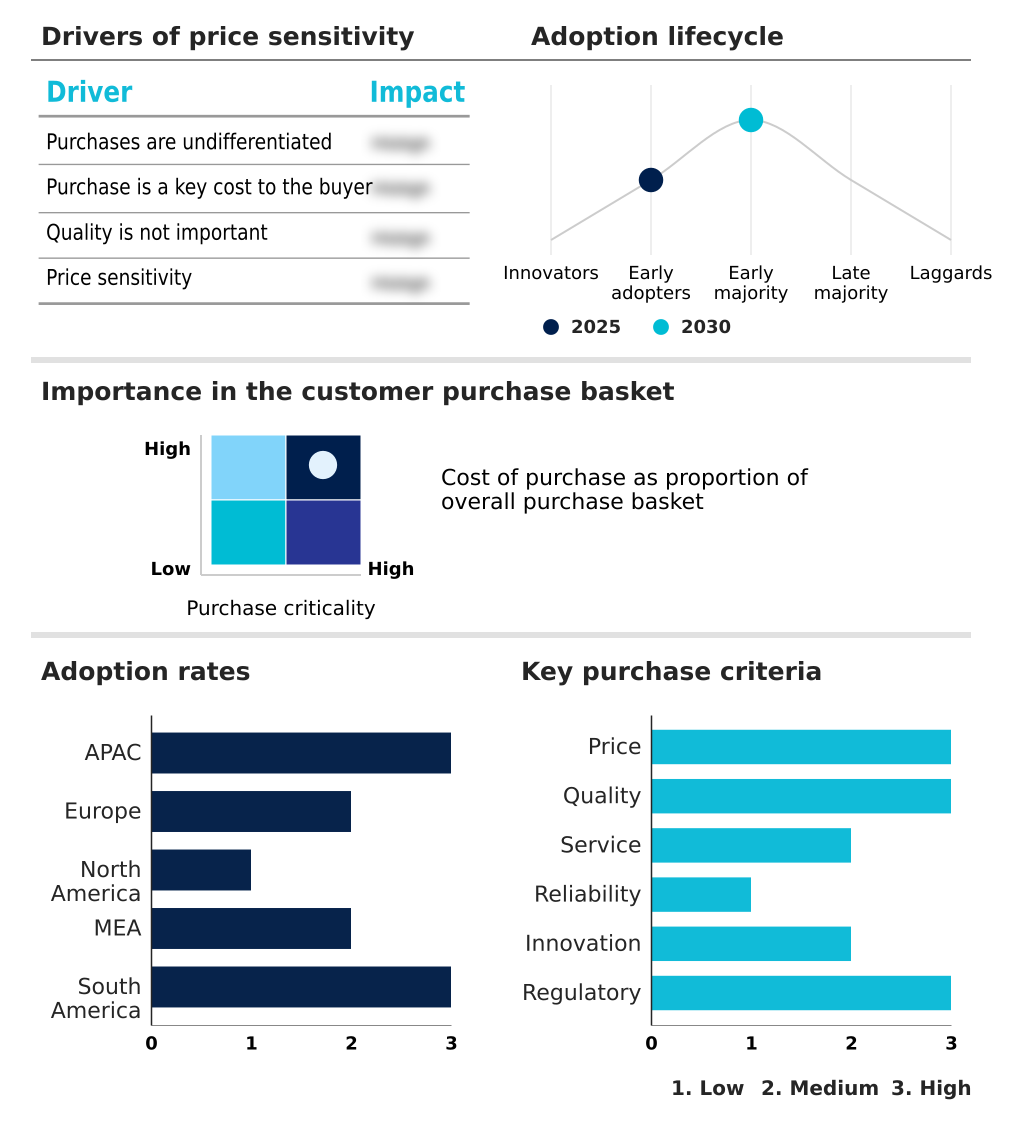
Exclusive Technavio Analysis on Customer Landscape

The ports and terminal operations market forecasting report includes the adoption lifecycle of the market, covering from the innovator’s stage to the laggard’s stage. It focuses on adoption rates in different regions based on penetration. Furthermore, the ports and terminal operations market report also includes key purchase criteria and drivers of price sensitivity to help companies evaluate and develop their market growth analysis strategies.

Customer Landscape of Ports And Terminal Operations Industry

Competitive Landscape

Companies are implementing various strategies, such as strategic alliances, ports and terminal operations market forecast, partnerships, mergers and acquisitions, geographical expansion, and product/service launches, to enhance their presence in the industry.

AP Moller Maersk AS - Offerings include integrated port services, container terminal management, and comprehensive end-to-end maritime logistics support designed to enhance operational efficiency across the supply chain.

The industry research and growth report includes detailed analyses of the competitive landscape of the market and information about key companies, including:

  • AP Moller Maersk AS
  • APM Terminals
  • Asian Terminals Inc.
  • Copenhagen Malmo Port
  • COSCO Shipping Ports Ltd.
  • DP World
  • EUROKAI GmbH and Co. KGaA
  • Gulftainer Co. Ltd.
  • Hutchison Ports
  • ICTS Inc.
  • Ports America
  • PSA International Pte Ltd.
  • PT Pelabuhan Indonesia
  • SAAM S.A.
  • Shanghai Port Co. Ltd.
  • Terminal Investment Ltd. Sarl
  • Yilport Holding Inc.
  • Yusen Terminals LLC

Qualitative and quantitative analysis of companies has been conducted to help clients understand the wider business environment as well as the strengths and weaknesses of key industry players. Data is qualitatively analyzed to categorize companies as pure play, category-focused, industry-focused, and diversified; it is quantitatively analyzed to categorize companies as dominant, leading, strong, tentative, and weak.

Recent Development and News in Ports and terminal operations market

  • In May, 2025, APM Terminals announced a project for hydrogen-based shore power at the Port of Rotterdam to reduce the carbon impact of vessels at berth.
  • In July, 2025, DP World inaugurated a fully automated wing at its Dubai facility that employs machine learning for optimized scheduling of container movements.
  • In October, 2025, COSCO Shipping Ports Ltd. integrated an autonomous terminal management system at the port of Chancay in Peru to enhance operational efficiency.
  • In November, 2025, PSA International Pte Ltd. deployed a fleet of zero-emission yard cranes in Singapore as part of its ongoing decarbonization strategy.

Dive into Technavio’s robust research methodology, blending expert interviews, extensive data synthesis, and validated models for unparalleled Ports And Terminal Operations Market insights. See full methodology.

Market Scope
Page number 298
Base year 2025
Historic period 2020-2024
Forecast period 2026-2030
Growth momentum & CAGR Accelerate at a CAGR of 7.7%
Market growth 2026-2030 USD 41254.5 million
Market structure Fragmented
YoY growth 2025-2026(%) 7.2%
Key countries China, Singapore, South Korea, Japan, India, Indonesia, The Netherlands, Germany, UK, Spain, France, Italy, US, Canada, Mexico, UAE, Saudi Arabia, South Africa, Egypt, Qatar, Brazil, Argentina and Chile
Competitive landscape Leading Companies, Market Positioning of Companies, Competitive Strategies, and Industry Risks

Request Free Sample

Research Analyst Overview

  • The ports and terminal operations market is advancing through a period of intense technological adoption and strategic modernization. At the core of this evolution is the integration of terminal operating systems (TOS) and port management software, which are fundamental to orchestrating complex logistics.
  • The deployment of automated guided vehicles (AGVs) and advancements in automation and robotics are redefining physical workflows, while digital twin technology offers powerful simulation capabilities for berth optimization and planning. For boardroom consideration, investments in these technologies directly influence long-term capital expenditure and competitive positioning; for example, the adoption of automated gate systems reduces truck processing times by over 40%.
  • This drive for efficiency is coupled with a strong focus on decarbonization, pushing the adoption of shore power and other green solutions. The emphasis on enhancing intermodal connectivity and leveraging port community systems is crucial for creating seamless supply chains.
  • Ultimately, success hinges on an operator’s ability to manage hinterland connectivity and innovate within an increasingly digital and interconnected global trade network.

What are the Key Data Covered in this Ports And Terminal Operations Market Research and Growth Report?

  • What is the expected growth of the Ports And Terminal Operations Market between 2026 and 2030?

    • USD 41.25 billion, at a CAGR of 7.7%

  • What segmentation does the market report cover?

    • The report is segmented by Application (Food transportation, Steel transportation, Coal transportation, and Others), Service Type (Stevedoring, Cargo handling and transportation, and Others), Technology (Automation and robotics, Port management software, and Smart ports) and Geography (APAC, Europe, North America, Middle East and Africa, South America)

  • Which regions are analyzed in the report?

    • APAC, Europe, North America, Middle East and Africa and South America

  • What are the key growth drivers and market challenges?

    • Growing adoption of containerization, Structural risks in port congestion management

  • Who are the major players in the Ports And Terminal Operations Market?

    • AP Moller Maersk AS, APM Terminals, Asian Terminals Inc., Copenhagen Malmo Port, COSCO Shipping Ports Ltd., DP World, EUROKAI GmbH and Co. KGaA, Gulftainer Co. Ltd., Hutchison Ports, ICTS Inc., Ports America, PSA International Pte Ltd., PT Pelabuhan Indonesia, SAAM S.A., Shanghai Port Co. Ltd., Terminal Investment Ltd. Sarl, Yilport Holding Inc. and Yusen Terminals LLC

Market Research Insights

  • The market is characterized by a dynamic shift toward data-driven efficiency and operational resilience. The integration of advanced analytics platforms for logistics synchronization is enabling terminals to achieve significant performance gains. For instance, the use of predictive maintenance schedules for key equipment has been shown to reduce unexpected downtime by up to 20%, directly improving asset utilization.
  • Furthermore, terminals that have implemented comprehensive gate automation systems report a 30% faster truck turnaround time, a critical factor in mitigating port congestion. These advancements underscore a strategic focus on optimizing cargo handling efficiency and strengthening supply chain visibility, which are becoming key differentiators in a competitive landscape.
  • The ability to leverage technology for tangible cost reductions and enhanced reliability is defining the future of port operations.

We can help! Our analysts can customize this ports and terminal operations market research report to meet your requirements.

Get in touch

1. Executive Summary

1.1 Market overview

Executive Summary - Chart on Market Overview
Executive Summary - Data Table on Market Overview
Executive Summary - Chart on Global Market Characteristics
Executive Summary - Chart on Market by Geography
Executive Summary - Chart on Market Segmentation by Application
Executive Summary - Chart on Market Segmentation by Service Type
Executive Summary - Chart on Market Segmentation by Technology
Executive Summary - Chart on Incremental Growth
Executive Summary - Data Table on Incremental Growth
Executive Summary - Chart on Company Market Positioning

2. Technavio Analysis

2.1 Analysis of price sensitivity, lifecycle, customer purchase basket, adoption rates, and purchase criteria

2.2 Criticality of inputs and Factors of differentiation

Chart on Overview on criticality of inputs and factors of differentiation

2.3 Factors of disruption

Chart on Overview on factors of disruption

2.4 Impact of drivers and challenges

Chart on Impact of drivers and challenges in 2025 and 2030

3. Market Landscape

3.1 Market ecosystem

Chart on Parent Market
Data Table on - Parent Market

3.2 Market characteristics

Chart on Market characteristics analysis

3.3 Value chain analysis

Chart on Value chain analysis

4. Market Sizing

4.1 Market definition

Data Table on Offerings of companies included in the market definition

4.2 Market segment analysis

Market segments

4.3 Market size 2025

4.4 Market outlook: Forecast for 2025-2030

Chart on Global - Market size and forecast 2025-2030 ($ million)
Data Table on Global - Market size and forecast 2025-2030 ($ million)
Chart on Global Market: Year-over-year growth 2025-2030 (%)
Data Table on Global Market: Year-over-year growth 2025-2030 (%)

5. Historic Market Size

5.1 Global Ports And Terminal Operations Market 2020 - 2024

Historic Market Size - Data Table on Global Ports And Terminal Operations Market 2020 - 2024 ($ million)

5.2 Application segment analysis 2020 - 2024

Historic Market Size - Application Segment 2020 - 2024 ($ million)

5.3 Service Type segment analysis 2020 - 2024

Historic Market Size - Service Type Segment 2020 - 2024 ($ million)

5.4 Technology segment analysis 2020 - 2024

Historic Market Size - Technology Segment 2020 - 2024 ($ million)

5.5 Geography segment analysis 2020 - 2024

Historic Market Size - Geography Segment 2020 - 2024 ($ million)

5.6 Country segment analysis 2020 - 2024

Historic Market Size - Country Segment 2020 - 2024 ($ million)

6. Qualitative Analysis

6.1 The Impact of AI on Global Ports and Terminal Operations Market

7. Five Forces Analysis

7.1 Five forces summary

Five forces analysis - Comparison between 2025 and 2030

7.2 Bargaining power of buyers

Bargaining power of buyers - Impact of key factors 2025 and 2030

7.3 Bargaining power of suppliers

Bargaining power of suppliers - Impact of key factors in 2025 and 2030

7.4 Threat of new entrants

Threat of new entrants - Impact of key factors in 2025 and 2030

7.5 Threat of substitutes

Threat of substitutes - Impact of key factors in 2025 and 2030

7.6 Threat of rivalry

Threat of rivalry - Impact of key factors in 2025 and 2030

7.7 Market condition

Chart on Market condition - Five forces 2025 and 2030

8. Market Segmentation by Application

8.1 Market segments

Chart on Application - Market share 2025-2030 (%)
Data Table on Application - Market share 2025-2030 (%)

8.2 Comparison by Application

Chart on Comparison by Application
Data Table on Comparison by Application

8.3 Food transportation - Market size and forecast 2025-2030

Chart on Food transportation - Market size and forecast 2025-2030 ($ million)
Data Table on Food transportation - Market size and forecast 2025-2030 ($ million)
Chart on Food transportation - Year-over-year growth 2025-2030 (%)
Data Table on Food transportation - Year-over-year growth 2025-2030 (%)

8.4 Steel transportation - Market size and forecast 2025-2030

Chart on Steel transportation - Market size and forecast 2025-2030 ($ million)
Data Table on Steel transportation - Market size and forecast 2025-2030 ($ million)
Chart on Steel transportation - Year-over-year growth 2025-2030 (%)
Data Table on Steel transportation - Year-over-year growth 2025-2030 (%)

8.5 Coal transportation - Market size and forecast 2025-2030

Chart on Coal transportation - Market size and forecast 2025-2030 ($ million)
Data Table on Coal transportation - Market size and forecast 2025-2030 ($ million)
Chart on Coal transportation - Year-over-year growth 2025-2030 (%)
Data Table on Coal transportation - Year-over-year growth 2025-2030 (%)

8.6 Others - Market size and forecast 2025-2030

Chart on Others - Market size and forecast 2025-2030 ($ million)
Data Table on Others - Market size and forecast 2025-2030 ($ million)
Chart on Others - Year-over-year growth 2025-2030 (%)
Data Table on Others - Year-over-year growth 2025-2030 (%)

8.7 Market opportunity by Application

Market opportunity by Application ($ million)
Data Table on Market opportunity by Application ($ million)

9. Market Segmentation by Service Type

9.1 Market segments

Chart on Service Type - Market share 2025-2030 (%)
Data Table on Service Type - Market share 2025-2030 (%)

9.2 Comparison by Service Type

Chart on Comparison by Service Type
Data Table on Comparison by Service Type

9.3 Stevedoring - Market size and forecast 2025-2030

Chart on Stevedoring - Market size and forecast 2025-2030 ($ million)
Data Table on Stevedoring - Market size and forecast 2025-2030 ($ million)
Chart on Stevedoring - Year-over-year growth 2025-2030 (%)
Data Table on Stevedoring - Year-over-year growth 2025-2030 (%)

9.4 Cargo handling and transportation - Market size and forecast 2025-2030

Chart on Cargo handling and transportation - Market size and forecast 2025-2030 ($ million)
Data Table on Cargo handling and transportation - Market size and forecast 2025-2030 ($ million)
Chart on Cargo handling and transportation - Year-over-year growth 2025-2030 (%)
Data Table on Cargo handling and transportation - Year-over-year growth 2025-2030 (%)

9.5 Others - Market size and forecast 2025-2030

Chart on Others - Market size and forecast 2025-2030 ($ million)
Data Table on Others - Market size and forecast 2025-2030 ($ million)
Chart on Others - Year-over-year growth 2025-2030 (%)
Data Table on Others - Year-over-year growth 2025-2030 (%)

9.6 Market opportunity by Service Type

Market opportunity by Service Type ($ million)
Data Table on Market opportunity by Service Type ($ million)

10. Market Segmentation by Technology

10.1 Market segments

Chart on Technology - Market share 2025-2030 (%)
Data Table on Technology - Market share 2025-2030 (%)

10.2 Comparison by Technology

Chart on Comparison by Technology
Data Table on Comparison by Technology

10.3 Automation and robotics - Market size and forecast 2025-2030

Chart on Automation and robotics - Market size and forecast 2025-2030 ($ million)
Data Table on Automation and robotics - Market size and forecast 2025-2030 ($ million)
Chart on Automation and robotics - Year-over-year growth 2025-2030 (%)
Data Table on Automation and robotics - Year-over-year growth 2025-2030 (%)

10.4 Port management software - Market size and forecast 2025-2030

Chart on Port management software - Market size and forecast 2025-2030 ($ million)
Data Table on Port management software - Market size and forecast 2025-2030 ($ million)
Chart on Port management software - Year-over-year growth 2025-2030 (%)
Data Table on Port management software - Year-over-year growth 2025-2030 (%)

10.5 Smart ports - Market size and forecast 2025-2030

Chart on Smart ports - Market size and forecast 2025-2030 ($ million)
Data Table on Smart ports - Market size and forecast 2025-2030 ($ million)
Chart on Smart ports - Year-over-year growth 2025-2030 (%)
Data Table on Smart ports - Year-over-year growth 2025-2030 (%)

10.6 Market opportunity by Technology

Market opportunity by Technology ($ million)
Data Table on Market opportunity by Technology ($ million)

11. Customer Landscape

11.1 Customer landscape overview

Analysis of price sensitivity, lifecycle, customer purchase basket, adoption rates, and purchase criteria

12. Geographic Landscape

12.1 Geographic segmentation

Chart on Market share by geography 2025-2030 (%)
Data Table on Market share by geography 2025-2030 (%)

12.2 Geographic comparison

Chart on Geographic comparison
Data Table on Geographic comparison

12.3 APAC - Market size and forecast 2025-2030

Chart on APAC - Market size and forecast 2025-2030 ($ million)
Data Table on APAC - Market size and forecast 2025-2030 ($ million)
Chart on APAC - Year-over-year growth 2025-2030 (%)
Data Table on APAC - Year-over-year growth 2025-2030 (%)
Chart on Regional Comparison - APAC
Data Table on Regional Comparison - APAC

12.3.1 China - Market size and forecast 2025-2030

Chart on China - Market size and forecast 2025-2030 ($ million)
Data Table on China - Market size and forecast 2025-2030 ($ million)
Chart on China - Year-over-year growth 2025-2030 (%)
Data Table on China - Year-over-year growth 2025-2030 (%)

12.3.2 Singapore - Market size and forecast 2025-2030

Chart on Singapore - Market size and forecast 2025-2030 ($ million)
Data Table on Singapore - Market size and forecast 2025-2030 ($ million)
Chart on Singapore - Year-over-year growth 2025-2030 (%)
Data Table on Singapore - Year-over-year growth 2025-2030 (%)

12.3.3 South Korea - Market size and forecast 2025-2030

Chart on South Korea - Market size and forecast 2025-2030 ($ million)
Data Table on South Korea - Market size and forecast 2025-2030 ($ million)
Chart on South Korea - Year-over-year growth 2025-2030 (%)
Data Table on South Korea - Year-over-year growth 2025-2030 (%)

12.3.4 Japan - Market size and forecast 2025-2030

Chart on Japan - Market size and forecast 2025-2030 ($ million)
Data Table on Japan - Market size and forecast 2025-2030 ($ million)
Chart on Japan - Year-over-year growth 2025-2030 (%)
Data Table on Japan - Year-over-year growth 2025-2030 (%)

12.3.5 India - Market size and forecast 2025-2030

Chart on India - Market size and forecast 2025-2030 ($ million)
Data Table on India - Market size and forecast 2025-2030 ($ million)
Chart on India - Year-over-year growth 2025-2030 (%)
Data Table on India - Year-over-year growth 2025-2030 (%)

12.3.6 Indonesia - Market size and forecast 2025-2030

Chart on Indonesia - Market size and forecast 2025-2030 ($ million)
Data Table on Indonesia - Market size and forecast 2025-2030 ($ million)
Chart on Indonesia - Year-over-year growth 2025-2030 (%)
Data Table on Indonesia - Year-over-year growth 2025-2030 (%)

12.4 Europe - Market size and forecast 2025-2030

Chart on Europe - Market size and forecast 2025-2030 ($ million)
Data Table on Europe - Market size and forecast 2025-2030 ($ million)
Chart on Europe - Year-over-year growth 2025-2030 (%)
Data Table on Europe - Year-over-year growth 2025-2030 (%)
Chart on Regional Comparison - Europe
Data Table on Regional Comparison - Europe

12.4.1 The Netherlands - Market size and forecast 2025-2030

Chart on The Netherlands - Market size and forecast 2025-2030 ($ million)
Data Table on The Netherlands - Market size and forecast 2025-2030 ($ million)
Chart on The Netherlands - Year-over-year growth 2025-2030 (%)
Data Table on The Netherlands - Year-over-year growth 2025-2030 (%)

12.4.2 Germany - Market size and forecast 2025-2030

Chart on Germany - Market size and forecast 2025-2030 ($ million)
Data Table on Germany - Market size and forecast 2025-2030 ($ million)
Chart on Germany - Year-over-year growth 2025-2030 (%)
Data Table on Germany - Year-over-year growth 2025-2030 (%)

12.4.3 UK - Market size and forecast 2025-2030

Chart on UK - Market size and forecast 2025-2030 ($ million)
Data Table on UK - Market size and forecast 2025-2030 ($ million)
Chart on UK - Year-over-year growth 2025-2030 (%)
Data Table on UK - Year-over-year growth 2025-2030 (%)

12.4.4 Spain - Market size and forecast 2025-2030

Chart on Spain - Market size and forecast 2025-2030 ($ million)
Data Table on Spain - Market size and forecast 2025-2030 ($ million)
Chart on Spain - Year-over-year growth 2025-2030 (%)
Data Table on Spain - Year-over-year growth 2025-2030 (%)

12.4.5 France - Market size and forecast 2025-2030

Chart on France - Market size and forecast 2025-2030 ($ million)
Data Table on France - Market size and forecast 2025-2030 ($ million)
Chart on France - Year-over-year growth 2025-2030 (%)
Data Table on France - Year-over-year growth 2025-2030 (%)

12.4.6 Italy - Market size and forecast 2025-2030

Chart on Italy - Market size and forecast 2025-2030 ($ million)
Data Table on Italy - Market size and forecast 2025-2030 ($ million)
Chart on Italy - Year-over-year growth 2025-2030 (%)
Data Table on Italy - Year-over-year growth 2025-2030 (%)

12.5 North America - Market size and forecast 2025-2030

Chart on North America - Market size and forecast 2025-2030 ($ million)
Data Table on North America - Market size and forecast 2025-2030 ($ million)
Chart on North America - Year-over-year growth 2025-2030 (%)
Data Table on North America - Year-over-year growth 2025-2030 (%)
Chart on Regional Comparison - North America
Data Table on Regional Comparison - North America

12.5.1 US - Market size and forecast 2025-2030

Chart on US - Market size and forecast 2025-2030 ($ million)
Data Table on US - Market size and forecast 2025-2030 ($ million)
Chart on US - Year-over-year growth 2025-2030 (%)
Data Table on US - Year-over-year growth 2025-2030 (%)

12.5.2 Canada - Market size and forecast 2025-2030

Chart on Canada - Market size and forecast 2025-2030 ($ million)
Data Table on Canada - Market size and forecast 2025-2030 ($ million)
Chart on Canada - Year-over-year growth 2025-2030 (%)
Data Table on Canada - Year-over-year growth 2025-2030 (%)

12.5.3 Mexico - Market size and forecast 2025-2030

Chart on Mexico - Market size and forecast 2025-2030 ($ million)
Data Table on Mexico - Market size and forecast 2025-2030 ($ million)
Chart on Mexico - Year-over-year growth 2025-2030 (%)
Data Table on Mexico - Year-over-year growth 2025-2030 (%)

12.6 Middle East and Africa - Market size and forecast 2025-2030

Chart on Middle East and Africa - Market size and forecast 2025-2030 ($ million)
Data Table on Middle East and Africa - Market size and forecast 2025-2030 ($ million)
Chart on Middle East and Africa - Year-over-year growth 2025-2030 (%)
Data Table on Middle East and Africa - Year-over-year growth 2025-2030 (%)
Chart on Regional Comparison - Middle East and Africa
Data Table on Regional Comparison - Middle East and Africa

12.6.1 UAE - Market size and forecast 2025-2030

Chart on UAE - Market size and forecast 2025-2030 ($ million)
Data Table on UAE - Market size and forecast 2025-2030 ($ million)
Chart on UAE - Year-over-year growth 2025-2030 (%)
Data Table on UAE - Year-over-year growth 2025-2030 (%)

12.6.2 Saudi Arabia - Market size and forecast 2025-2030

Chart on Saudi Arabia - Market size and forecast 2025-2030 ($ million)
Data Table on Saudi Arabia - Market size and forecast 2025-2030 ($ million)
Chart on Saudi Arabia - Year-over-year growth 2025-2030 (%)
Data Table on Saudi Arabia - Year-over-year growth 2025-2030 (%)

12.6.3 South Africa - Market size and forecast 2025-2030

Chart on South Africa - Market size and forecast 2025-2030 ($ million)
Data Table on South Africa - Market size and forecast 2025-2030 ($ million)
Chart on South Africa - Year-over-year growth 2025-2030 (%)
Data Table on South Africa - Year-over-year growth 2025-2030 (%)

12.6.4 Egypt - Market size and forecast 2025-2030

Chart on Egypt - Market size and forecast 2025-2030 ($ million)
Data Table on Egypt - Market size and forecast 2025-2030 ($ million)
Chart on Egypt - Year-over-year growth 2025-2030 (%)
Data Table on Egypt - Year-over-year growth 2025-2030 (%)

12.6.5 Qatar - Market size and forecast 2025-2030

Chart on Qatar - Market size and forecast 2025-2030 ($ million)
Data Table on Qatar - Market size and forecast 2025-2030 ($ million)
Chart on Qatar - Year-over-year growth 2025-2030 (%)
Data Table on Qatar - Year-over-year growth 2025-2030 (%)

12.7 South America - Market size and forecast 2025-2030

Chart on South America - Market size and forecast 2025-2030 ($ million)
Data Table on South America - Market size and forecast 2025-2030 ($ million)
Chart on South America - Year-over-year growth 2025-2030 (%)
Data Table on South America - Year-over-year growth 2025-2030 (%)
Chart on Regional Comparison - South America
Data Table on Regional Comparison - South America

12.7.1 Brazil - Market size and forecast 2025-2030

Chart on Brazil - Market size and forecast 2025-2030 ($ million)
Data Table on Brazil - Market size and forecast 2025-2030 ($ million)
Chart on Brazil - Year-over-year growth 2025-2030 (%)
Data Table on Brazil - Year-over-year growth 2025-2030 (%)

12.7.2 Argentina - Market size and forecast 2025-2030

Chart on Argentina - Market size and forecast 2025-2030 ($ million)
Data Table on Argentina - Market size and forecast 2025-2030 ($ million)
Chart on Argentina - Year-over-year growth 2025-2030 (%)
Data Table on Argentina - Year-over-year growth 2025-2030 (%)

12.7.3 Chile - Market size and forecast 2025-2030

Chart on Chile - Market size and forecast 2025-2030 ($ million)
Data Table on Chile - Market size and forecast 2025-2030 ($ million)
Chart on Chile - Year-over-year growth 2025-2030 (%)
Data Table on Chile - Year-over-year growth 2025-2030 (%)

12.8 Market opportunity by geography

Market opportunity by geography ($ million)
Data Tables on Market opportunity by geography ($ million)

13. Drivers, Challenges, and Opportunity

13.1 Market drivers

Growing adoption of containerization
Technological advancements in ports and terminal operations
Rise in cruise tourism

13.2 Market challenges

Structural risks in port congestion management
Greater operational complexity
Liner industry consolidation

13.3 Impact of drivers and challenges

Impact of drivers and challenges in 2025 and 2030

13.4 Market opportunities

Emergence of real-time location systems
Increase in investment in port infrastructure
Integration of blockchain technology in ports and terminal operations

14. Competitive Landscape

14.1 Overview

14.2

Overview on criticality of inputs and factors of differentiation

14.3 Landscape disruption

Overview on factors of disruption

14.4 Industry risks

Impact of key risks on business

15. Competitive Analysis

15.1 Companies profiled

Companies covered

15.2 Company ranking index

15.3 Market positioning of companies

Matrix on companies position and classification

15.4 AP Moller Maersk AS

AP Moller Maersk AS - Overview
AP Moller Maersk AS - Business segments
AP Moller Maersk AS - Key news
AP Moller Maersk AS - Key offerings
AP Moller Maersk AS - Segment focus
SWOT

15.5 APM Terminals

APM Terminals - Overview
APM Terminals - Product / Service
APM Terminals - Key offerings
SWOT

15.6 Asian Terminals Inc.

Asian Terminals Inc. - Overview
Asian Terminals Inc. - Product / Service
Asian Terminals Inc. - Key offerings
SWOT

15.7 COSCO Shipping Ports Ltd.

COSCO Shipping Ports Ltd. - Overview
COSCO Shipping Ports Ltd. - Business segments
COSCO Shipping Ports Ltd. - Key offerings
COSCO Shipping Ports Ltd. - Segment focus
SWOT

15.8 DP World

DP World - Overview
DP World - Product / Service
DP World - Key offerings
SWOT

15.9 EUROKAI GmbH and Co. KGaA

EUROKAI GmbH and Co. KGaA - Overview
EUROKAI GmbH and Co. KGaA - Business segments
EUROKAI GmbH and Co. KGaA - Key offerings
EUROKAI GmbH and Co. KGaA - Segment focus
SWOT

15.10 Gulftainer Co. Ltd.

Gulftainer Co. Ltd. - Overview
Gulftainer Co. Ltd. - Product / Service
Gulftainer Co. Ltd. - Key offerings
SWOT

15.11 Hutchison Ports

Hutchison Ports - Overview
Hutchison Ports - Product / Service
Hutchison Ports - Key offerings
SWOT

15.12 ICTS Inc.

ICTS Inc. - Overview
ICTS Inc. - Product / Service
ICTS Inc. - Key offerings
SWOT

15.13 Ports America

Ports America - Overview
Ports America - Product / Service
Ports America - Key offerings
SWOT

15.14 PSA International Pte Ltd.

PSA International Pte Ltd. - Overview
PSA International Pte Ltd. - Product / Service
PSA International Pte Ltd. - Key offerings
SWOT

15.15 SAAM S.A.

SAAM S.A. - Overview
SAAM S.A. - Business segments
SAAM S.A. - Key offerings
SAAM S.A. - Segment focus
SWOT

15.16 Shanghai Port Co. Ltd.

Shanghai Port Co. Ltd. - Overview
Shanghai Port Co. Ltd. - Business segments
Shanghai Port Co. Ltd. - Key offerings
Shanghai Port Co. Ltd. - Segment focus
SWOT

15.17 Terminal Investment Ltd. Sarl

Terminal Investment Ltd. Sarl - Overview
Terminal Investment Ltd. Sarl - Product / Service
Terminal Investment Ltd. Sarl - Key offerings
SWOT

15.18 Yilport Holding Inc.

Yilport Holding Inc. - Overview
Yilport Holding Inc. - Product / Service
Yilport Holding Inc. - Key offerings
SWOT

16. Appendix

16.1 Scope of the report

Market definition
Objectives
Notes and caveats

16.2 Inclusions and exclusions checklist

Inclusions checklist
Exclusions checklist

16.3 Currency conversion rates for US$

16.4 Research methodology

16.5 Data procurement

Information sources

16.6 Data validation

16.7 Validation techniques employed for market sizing

16.8 Data synthesis

16.9 360 degree market analysis

16.10 List of abbreviations

Research Methodology

Technavio presents a detailed picture of the market by way of study, synthesis, and summation of data from multiple sources. The analysts have presented the various facets of the market with a particular focus on identifying the key industry influencers. The data thus presented is comprehensive, reliable, and the result of extensive research, both primary and secondary.

INFORMATION SOURCES

Primary sources

  • Manufacturers and suppliers
  • Channel partners
  • Industry experts
  • Strategic decision makers

Secondary sources

  • Industry journals and periodicals
  • Government data
  • Financial reports of key industry players
  • Historical data
  • Press releases

DATA ANALYSIS

Data Synthesis

  • Collation of data
  • Estimation of key figures
  • Analysis of derived insights

Data Validation

  • Triangulation with data models
  • Reference against proprietary databases
  • Corroboration with industry experts

REPORT WRITING

Qualitative

  • Market drivers
  • Market challenges
  • Market trends
  • Five forces analysis

Quantitative

  • Market size and forecast
  • Market segmentation
  • Geographical insights
  • Competitive landscape

Interested in this report?

Get your sample now to see our research methodology and insights!

Download Now

Frequently Asked Questions

Ports And Terminal Operations market growth will increase by USD 41254.5 million during 2026-2030.

The Ports And Terminal Operations market is expected to grow at a CAGR of 7.7% during 2026-2030.

Ports And Terminal Operations market is segmented by Application (Food transportation, Steel transportation, Coal transportation, Others) Service type (Stevedoring, Cargo handling and transportation, Others) Technology (Automation and robotics, Port management software, Smart ports)

AP Moller Maersk AS, APM Terminals, Asian Terminals Inc., Copenhagen Malmo Port, COSCO Shipping Ports Ltd., DP World, EUROKAI GmbH and Co. KGaA, Gulftainer Co. Ltd., Hutchison Ports, ICTS Inc., Ports America, PSA International Pte Ltd., PT Pelabuhan Indonesia, SAAM S.A., Shanghai Port Co. Ltd., Terminal Investment Ltd. Sarl, Yilport Holding Inc., Yusen Terminals LLC are a few of the key vendors in the Ports And Terminal Operations market.

APAC will register the highest growth rate of 66.4% among the other regions. Therefore, the Ports And Terminal Operations market in APAC is expected to garner significant business opportunities for the vendors during the forecast period.

China, Singapore, South Korea, Japan, India, Indonesia, The Netherlands, Germany, UK, Spain, France, Italy, US, Canada, Mexico, UAE, Saudi Arabia, South Africa, Egypt, Qatar, Brazil, Argentina, Chile

  • Growing adoption of containerization is the driving factor this market.

The Ports And Terminal Operations market vendors should focus on grabbing business opportunities from the Application segment as it accounted for the largest market share in the base year.