Primary Ciliary Dyskinesia Market Size 2024-2028
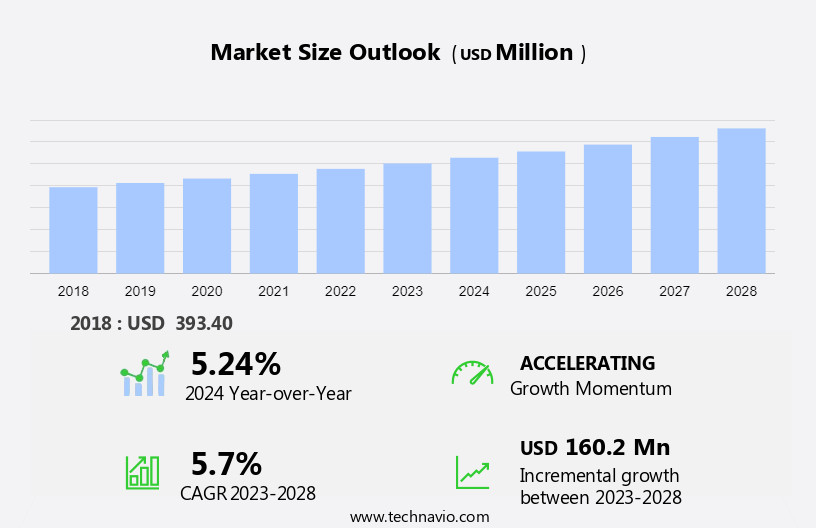
The primary ciliary dyskinesia market size is forecast to increase by USD 160.2 million at a CAGR of 5.7% between 2023 and 2028.
- The market is experiencing significant growth due to several key factors. One of the primary drivers is the increasing awareness of PCD conditions, leading to a rise in diagnoses and subsequent demand for effective treatments in healthcare. Another growth factor is the increasing pipeline of projects focused on developing new therapies for PCD, which is further supported by advancements in medical diagnostics. However, the high development costs of PCD treatments pose a significant challenge to market growth. Despite these challenges, the market is expected to witness steady progress, driven by unmet medical needs and the potential of novel treatments in the pipeline.
What will be the Size of the Primary Ciliary Dyskinesia Market During the Forecast Period?
- Primary Ciliary Dyskinesia (PCD) is a rare, genetic disorder affecting the function of cilia and flagella In the respiratory tract and reproductive organs. Characterized by a family history of chronic respiratory issues, lung infections, and ear and sinus problems, PCD is caused by mutations In the genes responsible for the structure and function of these microscopic structures. General practitioners, pediatricians, and pulmonary specialists are often the first point of contact for diagnosis, utilizing various diagnostic techniques such as electron microscopy and genetic testing.
- FDA-approved treatments include drug therapy, radiotherapy, and chemotherapy, with ongoing research exploring breakthrough therapies. Healthcare systems continue to adapt, integrating telemedicine and hospital services to improve accessibility and patient care for those affected by this complex condition. The World Health Organization emphasizes the importance of early diagnosis and appropriate management to mitigate the long-term impact on individuals' health and wellbeing.
How is this Primary Ciliary Dyskinesia Industry segmented and which is the largest segment?
The primary ciliary dyskinesia industry research report provides comprehensive data (region-wise segment analysis), with forecasts and estimates in "USD million" for the period 2024-2028, as well as historical data from 2018-2022 for the following segments.
- Type
- Genetic testing
- Electron microscopy
- Nasal nitric Oxide (NNO) testing
- Application
- Hospitals
- Speciality clinics
- Research centers
- Geography
- Europe
- Germany
- UK
- North America
- Canada
- US
- Asia
- Japan
- Rest of World (ROW)
- Europe
By Type Insights
- The genetic testing segment is estimated to witness significant growth during the forecast period.
Primary Ciliary Dyskinesia (PCD) is a genetic disorder affecting the function of cilia and flagella In the respiratory and reproductive systems. Family history and diagnostic techniques, such as electron microscopy and ciliary ultrastructure analysis, play a crucial role in identifying this condition. General practitioners, pediatricians, and pulmonary specialists often diagnose PCD, which is associated with chronic respiratory issues, lung infections, and ear and sinus problems. The FDA has approved treatments including antibiotics, bronchodilators, anti-inflammatory medications, chest physical therapy, and exercise. Therapeutic options also include mucolytic agents, ENaC inhibitors, and LNP-formulated mRNA. Breakthrough therapies and disease-modifying treatments are under investigation, including gene therapies and precision medicine.
Kartagener syndrome, situs inversus, and heterotaxy are related conditions. Genetic testing, such as multi-gene panels and targeted mutation analysis, is essential for accurate diagnosis. Subject Matter Experts In the field of genetics, pulmonology, and cilia biology contribute to the advancement of research and treatment options. The World Health Organization and various research centers worldwide are dedicated to understanding and addressing the challenges of PCD.
Get a glance at the Primary Ciliary Dyskinesia Industry report of share of various segments Request Free Sample
The genetic testing segment was valued at USD 203.80 million in 2018 and showed a gradual increase during the forecast period.
Regional Analysis
- Europe is estimated to contribute 37% to the growth of the global market during the forecast period.
Technavio’s analysts have elaborately explained the regional trends and drivers that shape the market during the forecast period.
For more insights on the market share of various regions, Request Free Sample
Primary Ciliary Dyskinesia (PCD), a rare genetic disorder affecting the function of cilia and flagella In the respiratory and reproductive systems, is gaining significant attention in Europe due to advanced healthcare infrastructure and increasing government support. Major European countries boast well-established hospitals and clinics, enabling specialized care for PCD patients. Government initiatives prioritizing public health and rare disease awareness contribute to market growth. Pharmaceutical companies, including Boehringer Ingelheim, Novartis, and Teva, are actively engaged in the research and development of novel therapies. Diagnostic techniques for PCD include electron microscopy, genetic testing, and diagnostic methods. General practitioners, pediatricians, and pulmonary specialists play crucial roles in identifying and managing PCD.
FDA-approved treatments include antibiotics, bronchodilators, anti-inflammatory medications, chest physical therapy, and exercise. Breakthrough therapies, such as mucolytics, ENaC inhibitors, and LNP-formulated mRNA, offer disease-modifying potential. Subject Matter Experts In the field of genetics, cilia, and flagella continue to advance our understanding of PCD. The World Health Organization and various research centers collaborate to expand knowledge and develop new treatments. Healthcare systems, including hospitals, clinics, and telemedicine, facilitate access to care for PCD patients.
Market Dynamics
Our researchers analyzed the data with 2023 as the base year, along with the key drivers, trends, and challenges. A holistic analysis of drivers will help companies refine their marketing strategies to gain a competitive advantage.
What are the key market drivers leading to the rise In the adoption of Primary Ciliary Dyskinesia Industry?
Increasing awareness of PCD conditions is the key driver of the market.
- The increasing awareness of primary ciliary dyskinesia (PCD) among healthcare professionals and patients is significantly contributing to improved diagnosis rates, which in turn is fueling the growth of the global PCD market. A rising number of research studies and publications focusing on PCD symptoms, conditions, and treatments are playing a crucial role in boosting this awareness. Additionally, PCD-related journals and articles, which are easily accessible, highlight the prevalence, diagnosis, and treatment options for the condition, educating both the medical community and the public. The growing trend of targeted awareness campaigns aimed at healthcare professionals and the general public further helps spread information about PCD.
- Furthermore, community engagement programs, health fairs, school initiatives, and local events are providing additional opportunities to educate the public, demystifying the condition and promoting understanding. Collectively, these efforts are driving greater awareness of PCD, leading to earlier diagnosis and improved management for affected individuals, ultimately supporting the growth of the market. As a result, the increasing awareness of PCD is expected to be a key factor driving the market’s growth during the forecast period.
What are the market trends shaping the Primary Ciliary Dyskinesia Industry?
Increasing pipeline projects on PCD is the upcoming market trend.
- The market is experiencing notable advancements in its pipeline, with a focus on innovative treatment options and groundbreaking research. For example, Translate Bio, a subsidiary of Sanofi, is investigating MRT5005, an mRNA therapy designed to deliver functional DNAH5 mRNA to restore ciliary function in PCD patients. This therapy is currently undergoing phase 1/2 clinical trials. Similarly, AstraZeneca is developing AZD8601, an investigational drug aimed at enhancing mucociliary clearance in PCD patients, which is still in the early stages of clinical trials. The successful approval of these pipeline projects has the potential to greatly improve clinical outcomes for PCD patients. Therapies that can slow disease progression, reduce exacerbations, and enhance quality of life are expected to be highly valued by patients, caregivers, and healthcare providers.
- Additionally, the increasing number of pipeline projects brings a more competitive edge to the PCD market, motivating companies to innovate and differentiate their products. These developments not only improve patient access to effective treatments but also encourage the creation of more convenient and impactful therapies. Therefore, the growing pipeline of PCD treatments and the potential for improved clinical outcomes are expected to drive the adoption and expansion of the global primary ciliary dyskinesia market.
What challenges does the Primary Ciliary Dyskinesia Industry face during its growth?
High development costs of PCD treatments is a key challenge affecting the industry growth.
- Developing new therapies for diseases like primary ciliary dyskinesia (PCD) often incurs high costs due to research, clinical trials, and regulatory approvals. These expenses increase investment requirements and can slow the growth of the global market. The primary ciliary dyskinesia market demands significant investments across various sectors. For example, conducting clinical trials to assess the safety and efficacy of PCD therapies requires substantial financial resources. Similarly, establishing and maintaining manufacturing facilities for PCD treatments involves considerable capital investment, including the costs for equipment, quality control systems, and adherence to Good Manufacturing Practices (GMP).
- Additionally, creating a strong distribution network for the global PCD market presents challenges, as it requires investments in logistics and supply chain management. Furthermore, the market relies on advanced diagnostic tools, such as testing and imaging techniques, to diagnose PCD accurately and early. Investment in the development of sophisticated diagnostic technologies is, therefore, essential. As a result, the high costs associated with the global primary ciliary dyskinesia market collectively hinder its growth prospects during the forecast period.
Exclusive Customer Landscape
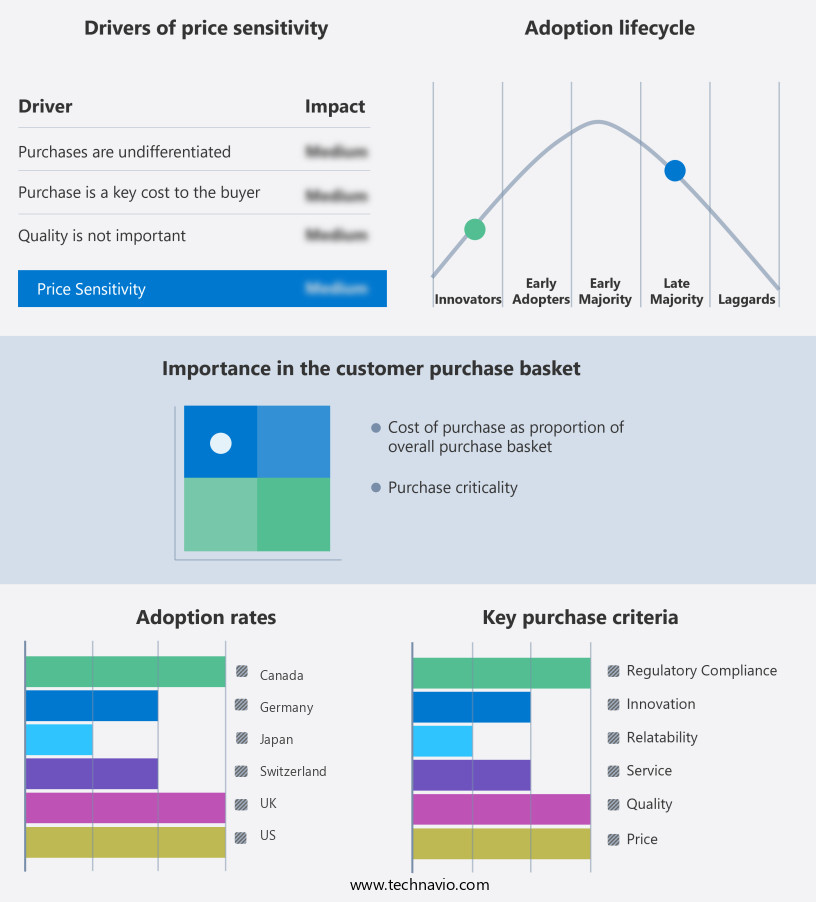
The primary ciliary dyskinesia market forecasting report includes the adoption lifecycle of the market, covering from the innovator’s stage to the laggard’s stage. It focuses on adoption rates in different regions based on penetration. Furthermore, the primary ciliary dyskinesia market report also includes key purchase criteria and drivers of price sensitivity to help companies evaluate and develop their market growth analysis strategies.
Customer Landscape
Key Companies & Market Insights
Companies are implementing various strategies, such as strategic alliances, primary ciliary dyskinesia market forecast, partnerships, mergers and acquisitions, geographical expansion, and product/service launches, to enhance their presence In the industry.
The industry research and growth report includes detailed analyses of the competitive landscape of the market and information about key companies, including:
- Acare Technology Co. Ltd.
- Amgen Inc.
- AstraZeneca Plc
- Bayer AG
- Becton Dickinson and Co.
- Boehringer Ingelheim International GmbH
- Bristol Myers Squibb Co.
- CHIESI Farmaceutici SpA
- F. Hoffmann La Roche Ltd.
- Fitwel Pharmaceuticals Pvt. Ltd.
- Gilead Sciences Inc.
- GlaxoSmithKline Plc
- Medigene AG
- Novartis AG
- Pfizer Inc.
- ReCode Therapeutics
- Regeneron Pharmaceuticals Inc.
- Rotech Healthcare Inc.
- Sanofi SA
- Teva UK Ltd.
Qualitative and quantitative analysis of companies has been conducted to help clients understand the wider business environment as well as the strengths and weaknesses of key industry players. Data is qualitatively analyzed to categorize companies as pure play, category-focused, industry-focused, and diversified; it is quantitatively analyzed to categorize companies as dominant, leading, strong, tentative, and weak.
Research Analyst Overview
Primary Ciliary Dyskinesia (PCD) is a rare, genetically inherited disorder that affects the function of the cilia and flagella in various organs, primarily In the respiratory and reproductive systems. This condition results from mutations In the genes responsible for the structure and function of these structures. The diagnosis of PCD involves a comprehensive evaluation by healthcare professionals, including general practitioners, pediatricians, and pulmonary specialists. Diagnostic techniques include imaging studies, such as chest X-rays and high-resolution computed tomography (HRCT), as well as laboratory tests, including electron microscopy and genetic testing. The management of PCD focuses on symptomatic relief and preventing complications.
In addition, treatment options include antibiotics to address recurrent lung infections, bronchodilators to improve breathing, anti-inflammatory medications to reduce inflammation, chest physical therapy to clear mucus from the lungs, and mucolytic agents to thin mucus. Recent advancements in the field have led to the development of breakthrough therapies, such as enac inhibitors and lnp-formulated mRNA, which aim to address the underlying genetic cause of the disorder. These therapies hold great promise in providing disease-modifying treatments for individuals with PCD. Object matter experts In the field of PCD continue to explore new diagnostic methods and therapeutic options. Collaborative efforts between research centers, academic institutions, and healthcare systems have led to the development of telemedicine programs and specialty clinics, making diagnosis and treatment more accessible to individuals with this rare condition.
Further, PCD is a complex disorder that affects multiple systems in the body. It can lead to chronic respiratory issues, including bronchiectasis, and can also impact the ears and sinuses. The World Health Organization recognizes PCD as a rare disease and emphasizes the importance of early diagnosis and appropriate management to improve outcomes for affected individuals. Healthcare systems play a crucial role In the diagnosis and treatment of PCD. They must ensure that specialized care is available to individuals with this condition and that diagnostic and therapeutic services are accessible and affordable. The development of drug delivery systems and gene therapies holds great promise for the future treatment of PCD.
|
Market Scope |
|
|
Report Coverage |
Details |
|
Page number |
193 |
|
Base year |
2023 |
|
Historic period |
2018-2022 |
|
Forecast period |
2024-2028 |
|
Growth momentum & CAGR |
Accelerate at a CAGR of 5.7% |
|
Market Growth 2024-2028 |
USD 160.2 million |
|
Market structure |
Fragmented |
|
YoY growth 2023-2024(%) |
5.24 |
|
Key countries |
US, UK, Canada, Germany, Japan, and Switzerland |
|
Competitive landscape |
Leading Companies, Market Positioning of Companies, Competitive Strategies, and Industry Risks |
What are the Key Data Covered in this Primary Ciliary Dyskinesia Market Research and Growth Report?
- CAGR of the Primary Ciliary Dyskinesia industry during the forecast period
- Detailed information on factors that will drive the market growth and forecasting between 2024 and 2028
- Precise estimation of the size of the market and its contribution of the industry in focus to the parent market
- Accurate predictions about upcoming growth and trends and changes in consumer behaviour
- Growth of the market across Europe, North America, Asia, and Rest of World (ROW)
- Thorough analysis of the market’s competitive landscape and detailed information about companies
- Comprehensive analysis of factors that will challenge the primary ciliary dyskinesia market growth of industry companies
We can help! Our analysts can customize this primary ciliary dyskinesia market research report to meet your requirements.


