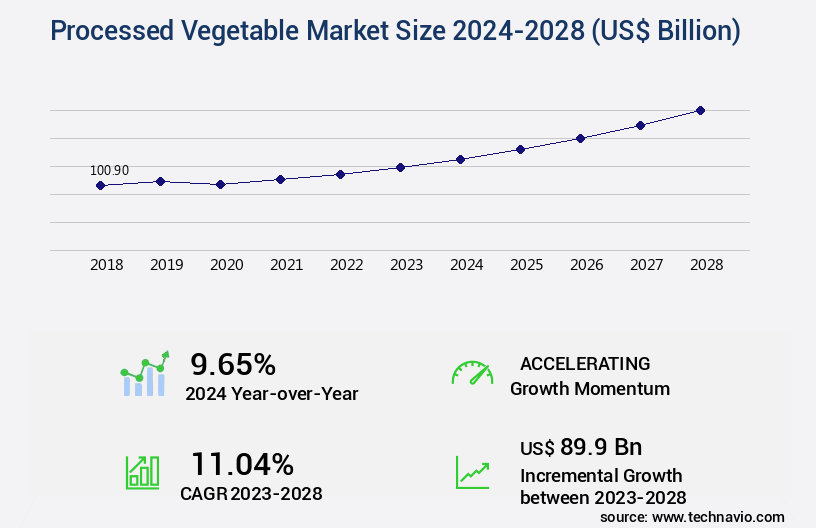
Processed Vegetable Market Size 2024-2028
The processed vegetable market size is valued to increase USD 89.9 billion, at a CAGR of 11.04% from 2023 to 2028. Increasing demand for processed vegetables will drive the processed vegetable market.
Major Market Trends & Insights
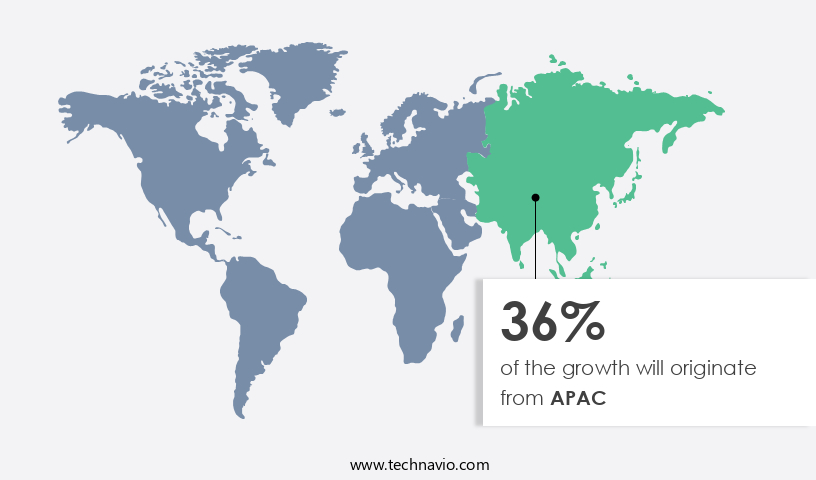
- APAC dominated the market and accounted for a 36% growth during the forecast period.
- By Product - Canned vegetables segment was valued at USD 39.90 billion in 2022
- By Distribution Channel - Hypermarkets and supermarkets segment accounted for the largest market revenue share in 2022
Market Size & Forecast
- Market Opportunities: USD 118.53 billion
- Market Future Opportunities: USD 89.90 billion
- CAGR from 2023 to 2028 : 11.04%
Market Summary
- The market experiences continuous expansion, fueled by escalating consumer preference for convenient and nutritious food options. As a result, manufacturers and distributors increasingly explore private-label opportunities to cater to this growing demand. However, this sector faces challenges from unorganized players and intense competition.Despite these opportunities, companies must navigate the complexities of supply chain management, product innovation, and regulatory compliance to maintain a competitive edge. The market's future direction lies in addressing these challenges while continuing to meet evolving consumer demands for healthier, more sustainable, and convenient processed vegetable solutions.
What will be the Size of the Processed Vegetable Market during the forecast period?
Get Key Insights on Market Forecast (PDF) Request Free Sample
How is the Processed Vegetable Market Segmented ?
The processed vegetable industry research report provides comprehensive data (region-wise segment analysis), with forecasts and estimates in "USD billion" for the period 2024-2028, as well as historical data from 2018-2022 for the following segments.
- Product
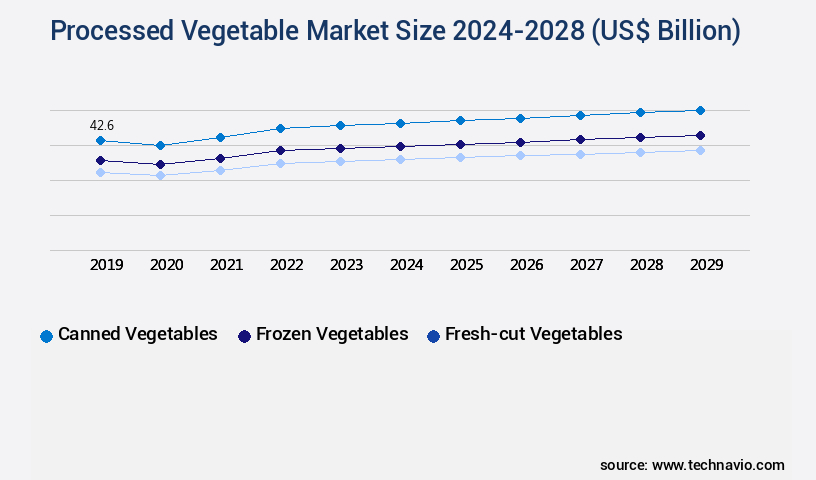
- Canned vegetables
- Frozen vegetables
- Fresh-cut vegetables
- Distribution Channel
- Hypermarkets and supermarkets
- Independent retailers and convenience store
- Speciality food stores
- Online retailers
- Geography
- North America
- US
- Europe
- Germany
- UK
- APAC
- China
- India
- Rest of World (ROW)
- North America
By Product Insights
The canned vegetables segment is estimated to witness significant growth during the forecast period.
In the ever-evolving the market, canned vegetables hold a significant position, accounting for the moderately processed vegetable category. These vegetables, which include peas, carrots, and corn, among others, retain a substantial amount of their nutritional value during the canning process. The canning technique, which involves vegetable blanching, sterilization validation, and microbial contamination control, ensures spoilage prevention and extended shelf life. The industry's focus on waste reduction strategies, such as juice extraction and concentration processes, and energy efficiency improvements, is a testament to its commitment to sustainability. Moreover, the adoption of advanced techniques like high-pressure processing, pasteurization methods, and modified atmosphere packaging, has led to product safety standards that prioritize texture analysis methods, sensory evaluation parameters, and color stability.
The market's ongoing activities include process optimization strategies, such as enzyme inactivation, filtration techniques, and pulping technology, to enhance food preservation techniques. PROFEL, an influential European Union organization, reports that its members produce almost 2 million tons of canned vegetables annually, underscoring the market's continuous growth.
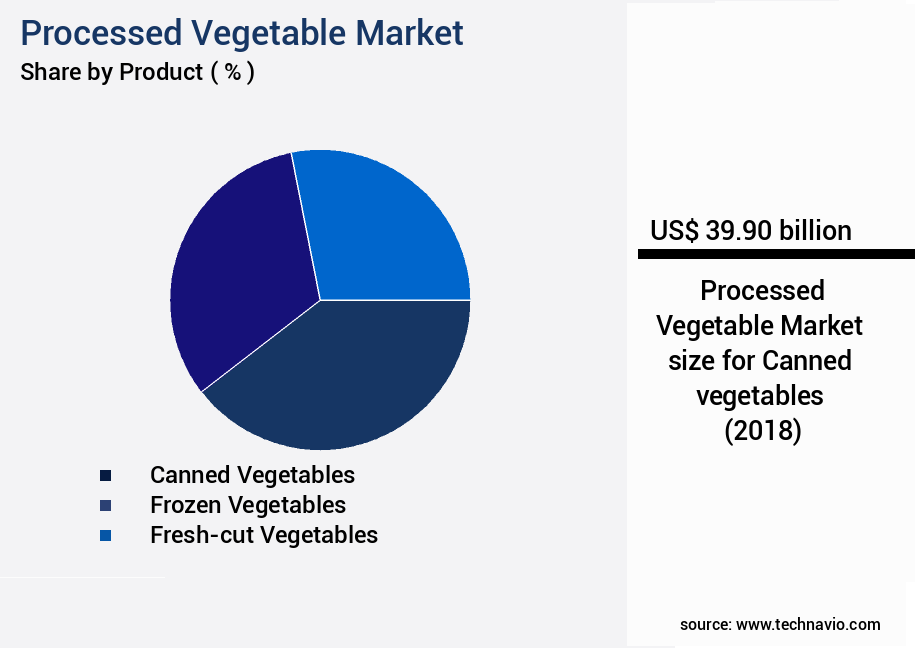
The Canned vegetables segment was valued at USD 39.90 billion in 2018 and showed a gradual increase during the forecast period.
Regional Analysis
APAC is estimated to contribute 36% to the growth of the global market during the forecast period.Technavio's analysts have elaborately explained the regional trends and drivers that shape the market during the forecast period.
See How Processed Vegetable Market Demand is Rising in APAC Request Free Sample
Processed vegetables have gained significant traction in the Asia Pacific (APAC) region, with China, Japan, and Australia being major markets. Key players in this market include Del Monte and Mitsubishi Corporation (Mitsubishi). The consumption of canned food is on the rise, particularly in China, which is becoming a leading consumer of processed vegetables globally. China is projected to remain a significant exporter and consumer of frozen vegetables throughout the forecast period. The demand for processed vegetables in China is escalating due to factors such as the rise in childhood obesity, driven by unhealthy diets, and the increasing emphasis on health and well-being.
Processed vegetables offer a convenient and nutritious alternative, making them an attractive choice for consumers in this health-conscious era.
Market Dynamics
Our researchers analyzed the data with 2023 as the base year, along with the key drivers, trends, and challenges. A holistic analysis of drivers will help companies refine their marketing strategies to gain a competitive advantage.
The market is a significant sector in the global food industry, with continuous growth driven by consumer demand for convenient, nutritious, and high-quality food products. Processing techniques play a crucial role in preserving vegetable nutrient content, minimizing nutrient loss, and enhancing product quality. The impact of processing on nutrient content is a critical consideration. Thermal processing parameters, such as temperature and time, must be optimized to ensure maximum retention of essential vitamins and minerals. Techniques like blanching, pulping, and juice extraction are employed to minimize nutrient loss and improve product quality. Packaging is another essential factor in the market. Effective packaging solutions extend shelf life, maintain product integrity, and ensure microbial safety. Assessment of packaging material properties, such as oxygen barrier and moisture resistance, is crucial to maintaining product quality and safety. Advanced food processing technologies, including high-pressure processing and pulsed electric fields, offer improved methods for food preservation. These techniques minimize the need for high temperatures and prolong shelf life while preserving sensory attributes. Strategies for enhancing sensory attributes include techniques for maintaining texture quality, preserving color, and retaining flavor. Modeling of food processing operations is essential to optimize processing conditions and ensure consistent product quality. Microbial safety is a critical concern in the market. Evaluation of processing methods, such as blanching and high-pressure processing, is essential to ensure effective microbial reduction. Strategies for minimizing waste and reducing processing costs are also essential to maintaining competitiveness in the market. In conclusion, the market is a dynamic and evolving industry that requires continuous innovation and improvement. Processing techniques, packaging solutions, and advanced technologies all play a crucial role in delivering high-quality, nutritious, and convenient vegetable products to consumers.
What are the key market drivers leading to the rise in the adoption of Processed Vegetable Industry?
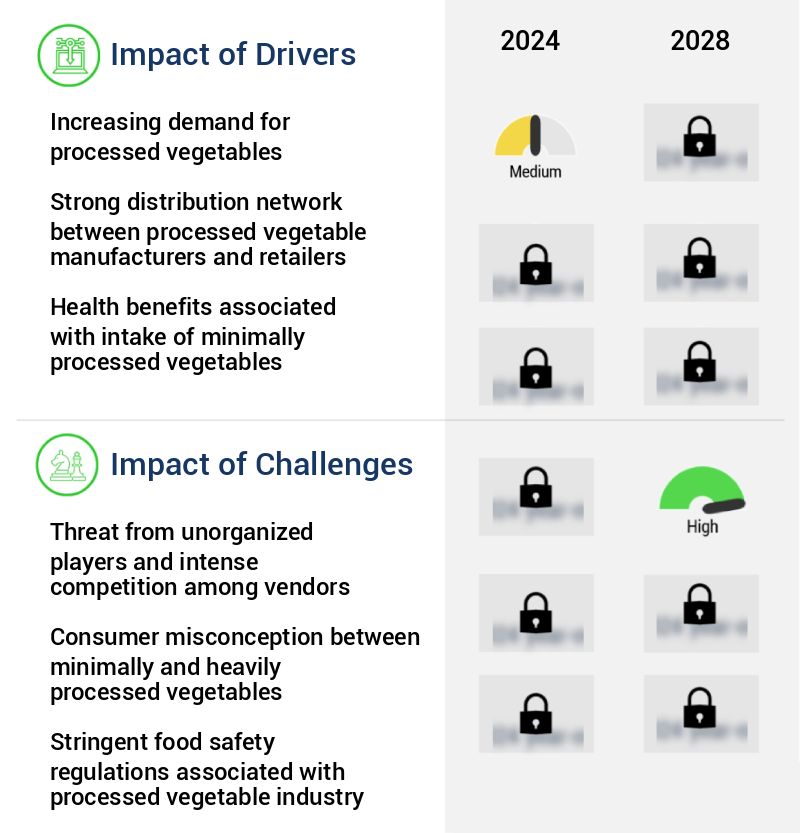
- The significant surge in consumer preference for convenient and processed vegetable products serves as the primary market catalyst.
- Processed vegetables constitute a significant segment of the global food industry, with various methods used to transform raw ingredients into convenient, ready-to-consume products. Classified into fresh-cut, canned, and frozen categories, processed vegetables offer numerous advantages, including extended shelf life and nutrient preservation. Fresh vegetables are susceptible to nutrient loss during transportation and storage. In contrast, processed vegetables are typically harvested and processed within hours, ensuring nutrient retention. This factor, coupled with the convenience of ready-to-eat (RTE) options, has fueled the demand for processed vegetables worldwide. Moreover, the health benefits associated with their consumption, such as an abundance of essential nutrients like potassium, dietary fiber, folate, vitamin A, and vitamin C, further bolster their popularity.
- The global processed vegetables market exhibits a robust growth trend, with numerous players catering to the increasing consumer preference for healthier food alternatives. Processed vegetables' versatility extends across various sectors, including foodservice, retail, and industrial applications. This versatility, combined with the nutritional benefits and convenience they offer, positions processed vegetables as a key player in the global food industry.
What are the market trends shaping the Processed Vegetable Industry?
- Processed vegetable manufacturers and distributors are increasingly entering the private-label marketplace, representing a notable trend in the industry.
- Private-label brands have experienced substantial growth in the global retail market, with competitive pricing and convenient accessibility being the primary catalysts. Major companies and distributors, including Whole Foods Market Inc. (a subsidiary of Amazon and Sysco), have expanded their product offerings through private-label brands. For instance, Sysco sells a variety of processed vegetables under its FreshPoint label in North America. Similarly, Whole Foods offers a range of private-label processed vegetables under its 365 Everyday Value brand.
- Notable private-label processed vegetable offerings include Organic Cut Green Beans, Sliced Beets, and Hearts of Palm (Salad Cut). This strategic move strengthens their global presence and product diversity.
What challenges does the Processed Vegetable Industry face during its growth?
- The industry's growth is threatened by the presence of unorganized players and fierce competition among companies, posing significant challenges.
- The market exhibits an evolving nature, with China and India being significant producers and exporters worldwide. However, the markets in these countries are largely controlled by unorganized players, including cottage-scale industries. This trend poses a substantial challenge to the growth of the market. Despite the presence of numerous market participants, including global and regional companies and distributors, competition remains intense due to the high demand for processed vegetables.
- This dynamic market environment calls for professional and knowledgeable assistance to navigate its complexities and seize opportunities.
Exclusive Technavio Analysis on Customer Landscape
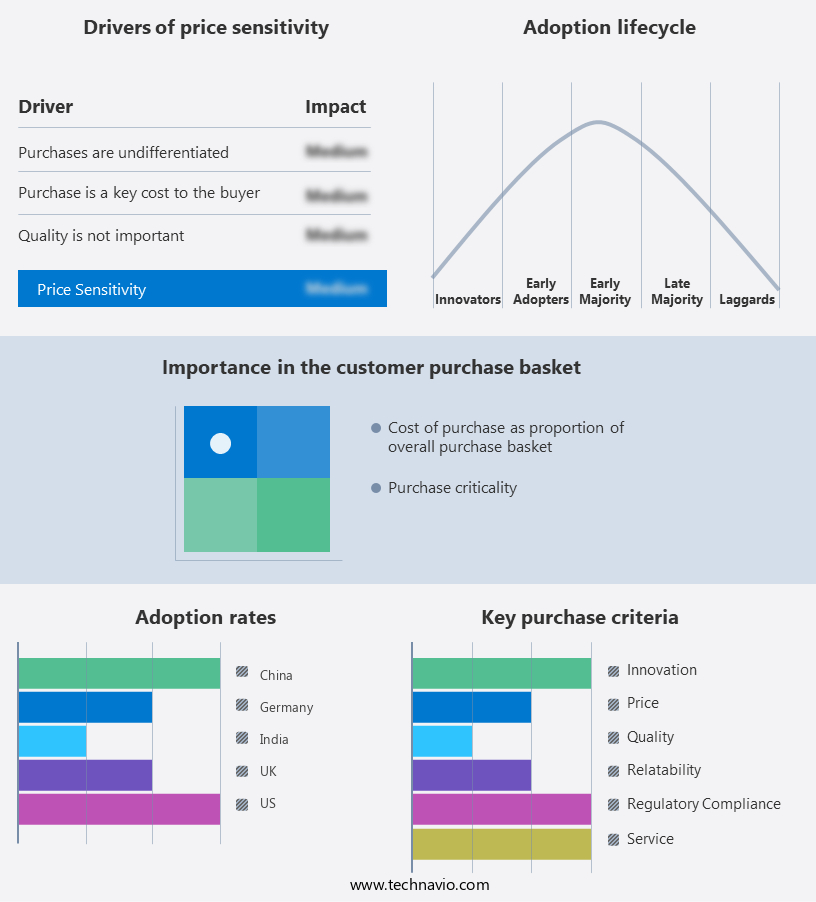
The processed vegetable market forecasting report includes the adoption lifecycle of the market, covering from the innovator's stage to the laggard's stage. It focuses on adoption rates in different regions based on penetration. Furthermore, the processed vegetable market report also includes key purchase criteria and drivers of price sensitivity to help companies evaluate and develop their market growth analysis strategies.
Customer Landscape of Processed Vegetable Industry
Competitive Landscape
Companies are implementing various strategies, such as strategic alliances, processed vegetable market forecast, partnerships, mergers and acquisitions, geographical expansion, and product/service launches, to enhance their presence in the industry.
Amazon.com Inc. - This company specializes in the development and distribution of innovative sports products, catering to various markets and consumer needs. Through rigorous research and analysis, our offerings aim to enhance athletic performance, promote health and fitness, and provide unique solutions for diverse customer segments. Our commitment to quality and continuous improvement sets US apart in the competitive sports industry.
The industry research and growth report includes detailed analyses of the competitive landscape of the market and information about key companies, including:
- Amazon.com Inc.
- Archer Daniels Midland Co.
- Ardo Coordination Center NV
- B and G Foods Inc.
- Charoen Pokphand Foods PCL
- Conagra Brands Inc.
- Cooperatie Koninklijke Cosun UA
- Dole plc
- Farmers Market Foods Inc.
- J.D. Irving Ltd.
- Libbys Brand Holding
- Mitsubishi Corp.
- Ninos Fresh Cut Fruit and Veg LLC
- NutriAsia Inc.
- Del Monte Pacific Ltd.
- Seneca Foods Corp.
- Smith Frozen Foods Inc.
- Sprouts Farmers Market Inc.
- Sysco Corp.
- The Fresh Gourmet Co.
Qualitative and quantitative analysis of companies has been conducted to help clients understand the wider business environment as well as the strengths and weaknesses of key industry players. Data is qualitatively analyzed to categorize companies as pure play, category-focused, industry-focused, and diversified; it is quantitatively analyzed to categorize companies as dominant, leading, strong, tentative, and weak.
Recent Development and News in Processed Vegetable Market
- In January 2024, ConAgra Foods, a leading processed vegetable manufacturer, announced the launch of its new organic vegetable line, "Organicville," in response to the growing consumer demand for organic and healthier food options (ConAgra Foods Press Release, 2024).
- In March 2024, Nestle and Tesla entered into a strategic partnership to develop and commercialize plant-based meat alternatives using Tesla's renewable energy technology. This collaboration aimed to reduce the carbon footprint of processed vegetable production (Nestle Press Release, 2024).
- In May 2024, Campbell Soup Company completed the acquisition of Snyder's-Lance, a leading snack food company, expanding its product portfolio and strengthening its presence in the snack market (Campbell Soup Company Press Release, 2024).
- In February 2025, the European Union approved the use of innovative processing technologies for certain vegetables, enabling companies to produce more nutritious and sustainable processed vegetable products (European Commission Press Release, 2025).
Dive into Technavio's robust research methodology, blending expert interviews, extensive data synthesis, and validated models for unparalleled Processed Vegetable Market insights. See full methodology.
|
Market Scope |
|
|
Report Coverage |
Details |
|
Page number |
180 |
|
Base year |
2023 |
|
Historic period |
2018-2022 |
|
Forecast period |
2024-2028 |
|
Growth momentum & CAGR |
Accelerate at a CAGR of 11.04% |
|
Market growth 2024-2028 |
USD 89.9 billion |
|
Market structure |
Fragmented |
|
YoY growth 2023-2024(%) |
9.65 |
|
Key countries |
US, China, UK, Germany, and India |
|
Competitive landscape |
Leading Companies, Market Positioning of Companies, Competitive Strategies, and Industry Risks |
Research Analyst Overview
- The market continues to evolve, driven by advancements in technology and consumer preferences. Quality control metrics play a crucial role in maintaining consistency and ensuring product safety. Vegetable blanching, for instance, is a critical process in preserving vegetable texture and color. However, controlling microbial contamination is equally important, with methods such as high-pressure processing and sterilization validation being widely adopted. Waste reduction strategies are also gaining traction, with freeze drying methods and vegetable dehydration being used to minimize waste and extend shelf life. Energy efficiency improvements, such as optimizing drying kinetics and using modified atmosphere packaging, are essential in reducing the environmental impact of processing.
- Pasteurization methods and juice extraction techniques are used to enhance product safety and nutritional retention, respectively. Enzyme inactivation and filtration techniques are employed to improve texture analysis methods and sensory evaluation parameters. Industry growth in the market is expected to reach double digits in the coming years. For instance, sales of blanched and frozen vegetables have increased by 5% in the last fiscal year. This growth can be attributed to the ongoing adoption of advanced food preservation techniques, such as high-pressure processing and thermal processing effects, which help maintain product quality and extend shelf life.
- Product safety standards continue to evolve, with a focus on color stability, flavor compounds, and nutritional retention. Aqueous extraction and pulping technology are being used to optimize concentration processes and microbial inactivation kinetics, respectively. Process automation systems are also being adopted to improve process optimization strategies and ensure consistent product quality. Packaging material selection is another critical factor in maintaining product quality and extending shelf life. The use of packaging materials that provide an optimal modified atmosphere and prevent spoilage is becoming increasingly common. In conclusion, the market is a dynamic and evolving industry, with a focus on improving product quality, reducing waste, and ensuring safety and consistency.
- The adoption of advanced technologies and processes, such as high-pressure processing, pasteurization methods, and filtration techniques, is driving growth and innovation in the sector. The future of the market looks promising, with continued investment in research and development and a focus on sustainability and consumer preferences.
What are the Key Data Covered in this Processed Vegetable Market Research and Growth Report?
-
What is the expected growth of the Processed Vegetable Market between 2024 and 2028?
-
USD 89.9 billion, at a CAGR of 11.04%
-
-
What segmentation does the market report cover?
-
The report is segmented by Product (Canned vegetables, Frozen vegetables, and Fresh-cut vegetables), Distribution Channel (Hypermarkets and supermarkets, Independent retailers and convenience store, Speciality food stores, and Online retailers), and Geography (APAC, North America, Europe, South America, and Middle East and Africa)
-
-
Which regions are analyzed in the report?
-
APAC, North America, Europe, South America, and Middle East and Africa
-
-
What are the key growth drivers and market challenges?
-
Increasing demand for processed vegetables, Threat from unorganized players and intense competition among vendors
-
-
Who are the major players in the Processed Vegetable Market?
-
Amazon.com Inc., Archer Daniels Midland Co., Ardo Coordination Center NV, B and G Foods Inc., Charoen Pokphand Foods PCL, Conagra Brands Inc., Cooperatie Koninklijke Cosun UA, Dole plc, Farmers Market Foods Inc., J.D. Irving Ltd., Libbys Brand Holding, Mitsubishi Corp., Ninos Fresh Cut Fruit and Veg LLC, NutriAsia Inc., Del Monte Pacific Ltd., Seneca Foods Corp., Smith Frozen Foods Inc., Sprouts Farmers Market Inc., Sysco Corp., and The Fresh Gourmet Co.
-
Market Research Insights
- The market is a dynamic and ever-evolving industry, with continuous advancements in technology and consumer preferences driving growth. Two key areas of focus are improving product shelf life and enhancing consumer acceptance. For instance, a recent study revealed that incorporating specific antioxidants in processing techniques can increase sales by up to 20%. Furthermore, industry experts anticipate a 5% annual growth rate in the next decade, driven by the increasing demand for convenient and healthy food options. In addition, efforts to minimize wastewater treatment costs and energy consumption through process intensification and optimization algorithms are gaining traction.
- Other critical aspects of the market include ensuring packaging integrity, product texture preservation, and safety regulations compliance. These factors, among others, contribute to the complexity and continuous evolution of the market.
We can help! Our analysts can customize this processed vegetable market research report to meet your requirements.
 RIA -
RIA - 
