
Project Logistics Market Size 2025-2029
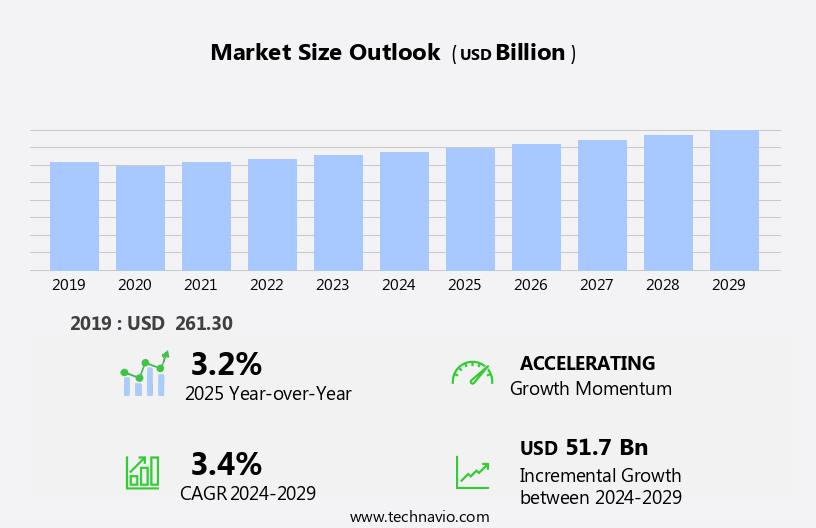
The project logistics market size is forecast to increase by USD 51.7 billion at a CAGR of 3.4% between 2024 and 2029.
- The market is experiencing significant growth due to several key trends. The increase in the number of construction activities worldwide is driving market demand, as these projects require the transportation and installation of large and heavy equipment. Another trend is the digitization of logistics, which is improving efficiency and reducing costs through the use of technologies such as real-time tracking and automation. Additionally, trends such as driverless vehicles, e-commerce, blockchains, and investment pockets in emerging economies are shaping the logistics ecosystem. However, high investments and operational costs remain challenges for market participants. To mitigate these challenges, companies are exploring innovative solutions such as collaborative logistics and outsourcing to third-party providers. Overall, the market is expected to continue growing, driven by these trends and the need for efficient and cost-effective transportation and installation solutions.
What will be the Size of the Project Logistics Market During the Forecast Period?
- The market encompasses the planning, organization, managing, processing, and controlling of the flow of goods, materials, information, and cargo in the context of large-scale projects, particularly those involving international trade and renewable energy production. Key trends include the adoption of modularization and offsite construction methods, the increasing use of ISO containers for transporting and storing goods, and the integration of technology such as driverless cars and blockchains into logistics ecosystems. Service offerings in this market cater to various industries, including construction companies and production facilities, by managing domestic and overseas logistics costs, ensuring efficient supply chain operations, and providing specialized expertise in handling raw materials and intermediate suppliers.
- The market's size and direction reflect the growing demand for complex project logistics solutions in the context of globalization and the shift toward sustainable energy sources.
How is this Project Logistics Industry segmented and which is the largest segment?
The project logistics industry research report provides comprehensive data (region-wise segment analysis), with forecasts and estimates in "USD billion" for the period 2025-2029, as well as historical data from 2019-2023 for the following segments.
- Service
- Transportation
- Warehousing
- Others
- End-user
- Oil and gas/mining/quarrying
- Construction
- Energy and power
- Others
- Mode Of Transportation
- Road
- Rail
- Sea
- Air
- Geography
- APAC
- China
- India
- Japan
- South Korea
- North America
- Canada
- US
- Europe
- Germany
- UK
- Italy
- Middle East and Africa
- South America
- APAC
By Service Insights
- The transportation segment is estimated to witness significant growth during the forecast period.
The transportation segment holds the largest share in the market, as it is a crucial service offering. Major players in this industry provide customized and specialized transportation solutions tailored to each project or customer's unique requirements. These comprehensive transportation packages ensure timely delivery of shipments, regardless of size. DHL International, a subsidiary of Deutsche Post AG, is an exemplary market participant offering industrial project transportation services, capable of transporting massive shipments weighing up to 1,000 tons across borders or to inaccessible locations. The market caters to various industries, including construction, production, and renewable energy, by managing the flow of goods, materials, information, cargo, and personnel.
Market solutions encompass infrastructure development, organization, planning, scheduling, controlling, and processing. Upgraded fleets, industry-specific services, and competitiveness are key drivers for growth in this sector. Despite domestic and overseas logistics costs, project logistics plays a vital role in job creation and impact analysis, requiring significant initial capital investment.
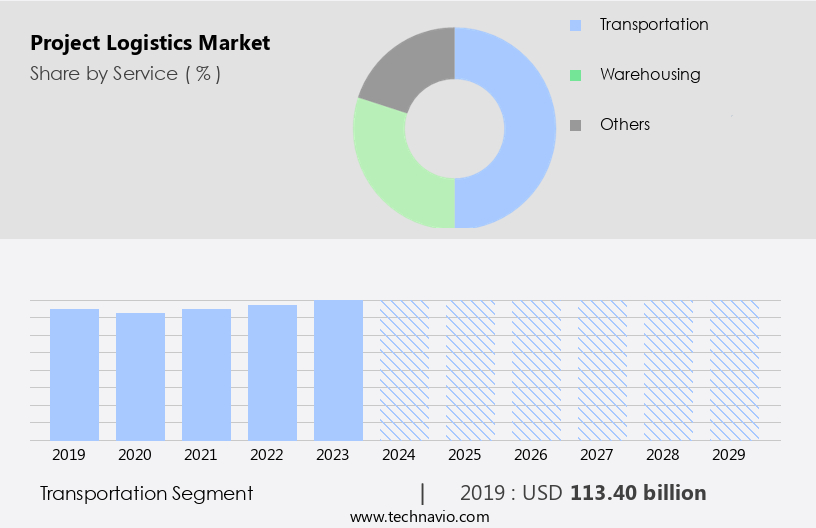
Get a glance at the market report of share of various segments Request Free Sample
The Transportation segment was valued at USD 113.40 billion in 2019 and showed a gradual increase during the forecast period.
Regional Analysis
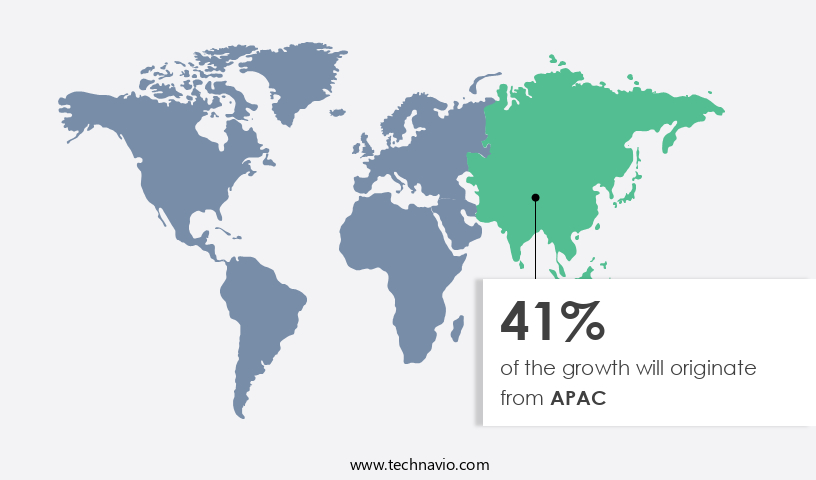
- APAC is estimated to contribute 41% to the growth of the global market during the forecast period.
Technavio's analysts have elaborately explained the regional trends and drivers that shape the market during the forecast period.
For more insights on the market size of various regions, Request Free Sample
The market in APAC is projected to lead the global market due to the region's significant economic growth and the increasing number of construction projects. Countries like India, China, Indonesia, and Malaysia are witnessing a wave in construction activities, driven by the establishment of manufacturing units by global organizations. China, being the world's largest automobile manufacturer, is attracting numerous automobile and auto parts production units to the region, resulting in increased demand for project logistics services. The easy availability of low-cost labor and resources further encourages businesses to set up production facilities in APAC. The market in this region caters to various industries, including construction, production facilities, and raw material suppliers, among others.
Service offerings range from managing and controlling the flow of goods, materials, information, cargo, and personnel, to providing infrastructure, upgraded fleets, and industry solutions. The market's competitiveness is driven by factors such as scheduled time planning, organization, and managing, processing, and controlling. The implementation of advanced technologies like driverless vehicles, blockchains, and e-commerce platforms is also expected to impact the market positively, leading to increased job creation and investment pockets.
Market Dynamics
Our researchers analyzed the data with 2024 as the base year, along with the key drivers, trends, and challenges. A holistic analysis of drivers will help companies refine their marketing strategies to gain a competitive advantage.
What are the key market drivers leading to the rise in the adoption of Project Logistics Industry?
Increase in number of construction activities is the key driver of the market.
- Project logistics plays a crucial role in the construction industry, enabling the efficient movement and storage of materials and equipment from suppliers to construction sites. The International Energy Agency reports that modularization and offsite construction have significantly increased the demand for project logistics services, as these methods require the transportation of modular packages and ISO containers via international trade. Effective logistics management in construction reduces domestic and overseas logistics costs, ensuring competitiveness for construction companies and production facilities. Project logistics service offerings cater to various industries, including renewable energy, construction, and manufacturing. Upgraded fleets and industry solutions facilitate scheduled time planning, organization, and managing of the flow of goods, materials, information, cargo, and personnel.
- Service providers offer solutions for cargo transporters, border restrictions, human mobility, and raw materials from intermediate suppliers. The implementation of advanced technologies, such as driverless vehicles, e-commerce, blockchains, and logistics ecosystems, further enhances the efficiency and competitiveness of project logistics. These advancements contribute to job creation and impact analysis, requiring initial capital investment but offering future estimations and investment pockets for growth. Project logistics is a vital component of construction projects, ensuring the smooth flow of goods and materials from the point of origin to the construction site. By reducing logistics costs and optimizing the supply chain, construction companies can improve their overall project profitability and remain competitive in the industry.
What are the market trends shaping the Project Logistics Industry?
Digitization of logistics is the upcoming market trend.
- Project logistics is a critical component of supply chain management. The integration of digital practices into logistics operations can significantly enhance their efficiency and competitiveness in today's fast-paced, omnichannel business environment. Digitization in project logistics refers to the adoption of advanced technological solutions and assets to transform traditional logistics processes. This includes the use of modularization and offsite construction techniques, ISO containers, and automation in international trade and domestic logistics. Digitization enables project logistics companies to streamline their operations, improve planning and organization, and manage the flow of goods, materials, information, and cargo more effectively. Service offerings have expanded to include industry solutions for industries such as renewable energy, construction, and production facilities.
- Upgraded fleets and infrastructure, along with the integration of driverless vehicles, blockchains, and e-commerce, are also becoming increasingly common. The implementation of digitization in project logistics can lead to increased revenues, value, and market capitalization for market players. To take full advantage of these benefits, companies are redesigning their logistics strategies to accommodate the latest trends and technologies. This includes managing and controlling the movement, storage, and processing of parts, modular packages, and materials, as well as managing personnel, shippers, and service providers. Despite the advantages, there are challenges to consider, such as initial capital investment, border restrictions, human mobility, and the impact of driverless cars on the logistics ecosystem.
- Future estimations indicate that investment pockets will continue to emerge in areas such as staff training, cybersecurity, and the integration of emerging technologies like blockchains and AI. The logistics industry is expected to continue evolving, with a focus on improving competitiveness, job creation, and sustainability.
What challenges does the Project Logistics Industry face during its growth?
High investments and operational costs is a key challenge affecting the industry growth.
- Project logistics is an essential sector that entails substantial initial capital investment for acquiring a fleet suitable for diverse modes of transportation, including land, rail, air, and sea. The industry caters to various industries such as construction, production, and renewable energy, requiring customized logistics solutions. The market players invest heavily in upgrading their fleets and infrastructure to meet the specific needs of these industries. Moreover, project logistics involves managing the flow of goods, materials, information, and cargo across international borders, adding to the costs. Domestic logistics costs and overseas logistics costs differ significantly due to various factors such as infrastructure, personnel, and border restrictions.
- To provide comprehensive industry solutions, logistics service providers offer planning, organization, managing, processing, controlling, and storage services. They use ISO containers, modularization, and offsite construction to optimize the movement and storage of materials and parts. The logistics ecosystem is evolving with the integration of technology, including driverless vehicles, blockchains, and e-commerce. These advancements are expected to impact the competitiveness of the market players and create job opportunities. The future estimations suggest investment pockets in areas such as staff training, digitalization, and sustainability initiatives.
Exclusive Customer Landscape
The project logistics market forecasting report includes the adoption lifecycle of the market, covering from the innovator's stage to the laggard's stage. It focuses on adoption rates in different regions based on penetration. Furthermore, the project logistics market report also includes key purchase criteria and drivers of price sensitivity to help companies evaluate and develop their market growth analysis strategies.
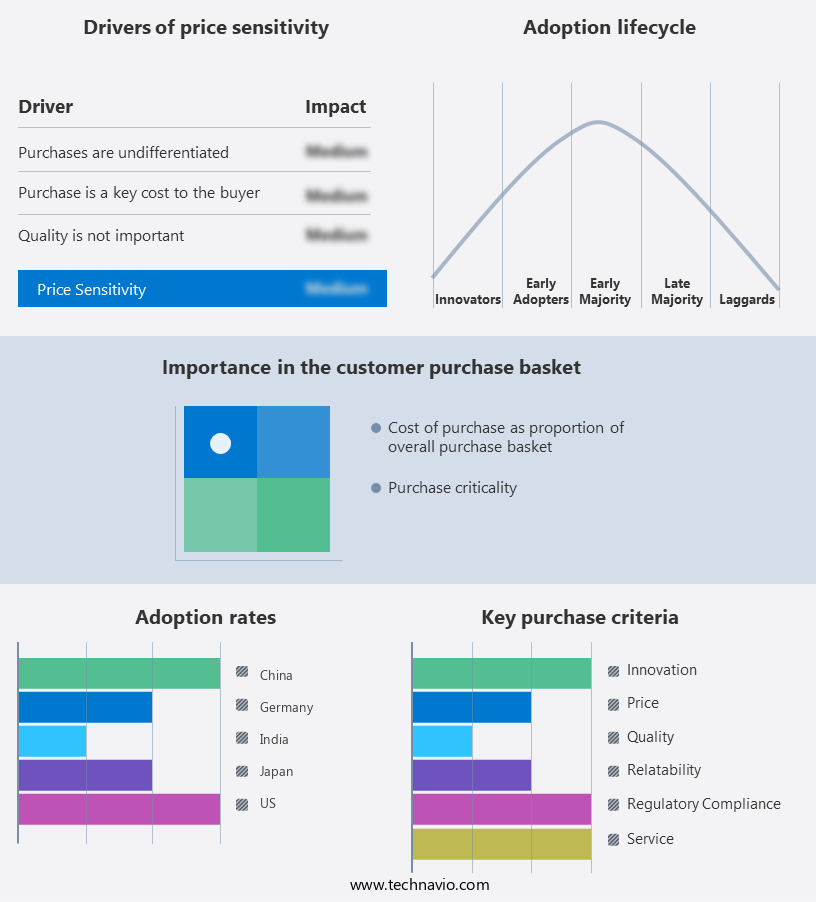
Customer Landscape
Key Companies & Market Insights
Companies are implementing various strategies, such as strategic alliances, project logistics market forecast, partnerships, mergers and acquisitions, geographical expansion, and product/service launches, to enhance their presence in the industry.
Balmer Lawrie and Co. Ltd. - The company offers project logistics solutions with feasibility, planning, scheduling, execution and final reconciliation and forwarding through multimodal transportation via sea, air, truck, rail and inland waterways.
The industry research and growth report includes detailed analyses of the competitive landscape of the market and information about key companies, including:
- Balmer Lawrie and Co. Ltd.
- C H Robinson Worldwide Inc.
- CEVA Logistics SA
- CJ Darcl Logistics Ltd.
- CJ Logistics Corp.
- Crowley Maritime Corp.
- Deutsche Bahn AG
- Deutsche Post AG
- DSV AS
- EMO Trans Inc.
- FedEx Corp.
- Fracht AG
- Hellmann Worldwide Logistics SE and Co KG
- Kerry Logistics Network Ltd.
- Kintetsu World Express Inc.
- Kuehne Nagel Management AG
- Mainfreight Ltd.
- Nippon Express Holdings Inc.
- United Parcel Service Inc.
- XPO Inc.
Qualitative and quantitative analysis of companies has been conducted to help clients understand the wider business environment as well as the strengths and weaknesses of key industry players. Data is qualitatively analyzed to categorize companies as pure play, category-focused, industry-focused, and diversified; it is quantitatively analyzed to categorize companies as dominant, leading, strong, tentative, and weak.
Research Analyst Overview
The market encompasses the planning, organization, managing, processing, controlling, and flow of goods, materials, information, and cargo in the context of large-scale construction projects and production facilities. This market is characterized by its international scope, with a significant portion of projects involving the transportation of modular packages and other materials across borders. Modularization and offsite construction have emerged as key trends in the project logistics industry, as they offer cost savings, increased efficiency, and improved quality compared to traditional on-site construction methods. ISO containers have become a popular solution for transporting modular packages due to their standardized size and ease of movement.
International trade plays a significant role in the market, with domestic logistics costs and overseas logistics costs being key considerations for shippers and service providers. The competitiveness of the industry hinges on the ability to effectively manage these costs while ensuring timely delivery and high-quality service. Service offerings in the market cater to various industries, including renewable energy, construction, and manufacturing. Upgraded fleets and industry solutions have become essential for service providers to meet the demands of these industries and stay competitive. Scheduled time is a critical factor in project logistics, with planning and organization being crucial for ensuring that materials and personnel are in place when needed.
The flow of goods and materials must be carefully managed to minimize delays and maximize efficiency. The market is influenced by various factors, including infrastructure development, personnel availability, and border restrictions. Human mobility, particularly in the context of international projects, can also impact the market. Investment in technology, such as driverless vehicles, blockchains, and AI (artificial intelligence), is transforming the project logistics ecosystem by optimizing supply chain management, enhancing decision-making, and improving predictive maintenance. E-commerce and renewable energy are also creating new opportunities and challenges for the industry. Initial capital investment is a significant consideration for companies entering the market. Future estimations suggest that investment pockets in this market will continue to grow, driven by the increasing demand for large-scale construction projects and production facilities, as well as the integration of AI to streamline operations and boost efficiency.
Staffing and training are essential for ensuring that project logistics companies have the skilled personnel needed to effectively manage the complexities of large-scale projects. The use of driverless cars and other advanced technologies is also changing the nature of the workforce in this industry. The market is a dynamic and complex industry that requires effective planning, organization, and management to ensure the timely and efficient delivery of goods, materials, and personnel for large-scale construction projects and production facilities. The market is influenced by various factors, including international trade, technology, and industry trends, and requires a skilled workforce to meet the demands of its clients.
|
Market Scope |
|
|
Report Coverage |
Details |
|
Page number |
231 |
|
Base year |
2024 |
|
Historic period |
2019-2023 |
|
Forecast period |
2025-2029 |
|
Growth momentum & CAGR |
Accelerate at a CAGR of 3.4% |
|
Market growth 2025-2029 |
USD 51.7 billion |
|
Market structure |
Fragmented |
|
YoY growth 2024-2025(%) |
3.2 |
|
Key countries |
US, China, Japan, India, South Korea, Canada, UK, Australia, Germany, and Italy |
|
Competitive landscape |
Leading Companies, Market Positioning of Companies, Competitive Strategies, and Industry Risks |
What are the Key Data Covered in this Project Logistics Market Research and Growth Report?
- CAGR of the Project Logistics industry during the forecast period
- Detailed information on factors that will drive the growth and forecasting between 2025 and 2029
- Precise estimation of the size of the market and its contribution of the industry in focus to the parent market
- Accurate predictions about upcoming growth and trends and changes in consumer behaviour
- Growth of the market across APAC, North America, Europe, Middle East and Africa, and South America
- Thorough analysis of the market's competitive landscape and detailed information about companies
- Comprehensive analysis of factors that will challenge the project logistics market growth of industry companies
We can help! Our analysts can customize this project logistics market research report to meet your requirements.
 RIA -
RIA - 
