Proportional Valve Market Size 2024-2028
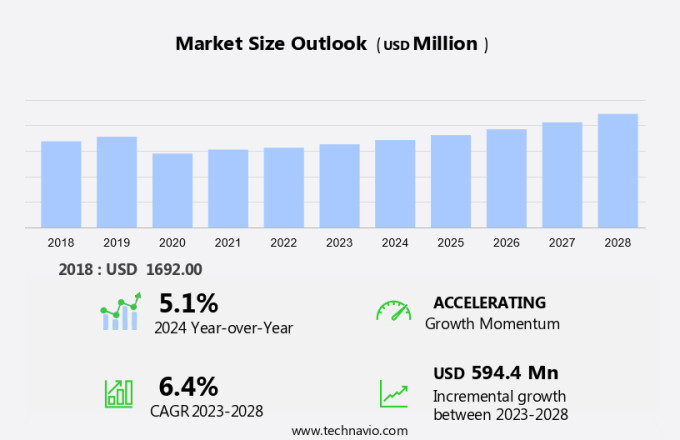
The proportional valve market size is forecast to increase by USD 594.4 million, at a CAGR of 6.4% between 2023 and 2028.
- The market is witnessing significant growth, driven by the increasing number of product launches and inorganic growth strategies adopted by key players. Companies are expanding their offerings to cater to the diverse requirements of industries such as oil and gas, power, and water and wastewater treatment. This market trend is expected to continue as industries seek more efficient and precise control solutions. However, the market faces challenges in the form of higher initial costs associated with proportional valves. These costs can be a barrier for smaller businesses and those with limited budgets. Additionally, the complexity of these valves can pose installation and maintenance challenges, requiring specialized expertise.
- To capitalize on the market opportunities and navigate these challenges effectively, companies must focus on offering competitive pricing and providing comprehensive support services to their customers. By addressing these challenges, they can establish a strong market presence and capture a significant share in the growing the market.
What will be the Size of the Proportional Valve Market during the forecast period?
Explore in-depth regional segment analysis with market size data - historical 2018-2022 and forecasts 2024-2028 - in the full report.
Request Free Sample
The market continues to evolve, driven by the dynamic interplay of various factors. Pneumatic systems, for instance, have long been a mainstay in the industry, with ongoing advancements in valve operating temperature and NFPA standards shaping their application. Valve testing, a crucial aspect of ensuring reliability and safety, is increasingly being automated through electro-hydraulic valves and Solenoid Valves, integrating industrial automation. CE marking and ISO standards dictate compliance, while servo valves and Pressure Relief Valves cater to safety systems and process control. Valve repair and maintenance are essential for valve durability and longevity, with remote monitoring and hydraulic actuators streamlining the process.
Valve material, valve response time, and valve flow rate are critical considerations in various sectors, from construction equipment and aerospace to packaging machinery and medical devices. Valve design, valve cartridge, and valve spool are continually refined to optimize valve efficiency and performance. Valve calibration and valve installation are meticulously executed to ensure valve reliability and accuracy. The valve industry's ongoing evolution reflects the continuous integration of technology, from machine vision and artificial intelligence to directional control valves and hydraulic systems. Ultimately, the market remains a vibrant, ever-changing landscape, with each component and application interconnected and interdependent.
How is this Proportional Valve Industry segmented?
The proportional valve industry research report provides comprehensive data (region-wise segment analysis), with forecasts and estimates in "USD million" for the period 2024-2028, as well as historical data from 2018-2022 for the following segments.
- Type
- Hydraulic proportional valves
- Electric proportional valves
- Pneumatic proportional valves
- Product
- Pressure control
- Flow control
- Directional control
- Geography
- North America
- US
- Europe
- Germany
- APAC
- China
- India
- Japan
- Rest of World (ROW)
- North America
.
By Type Insights
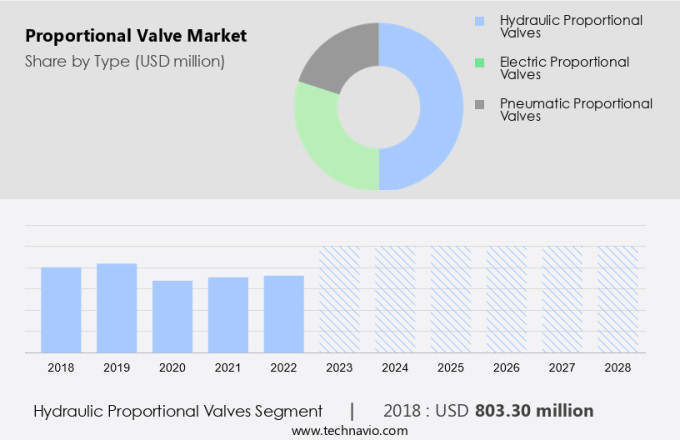
The hydraulic proportional valves segment is estimated to witness significant growth during the forecast period.
The market is witnessing notable developments in the hydraulic proportional valves segment. Innovative products are being introduced to enhance safety and control in various industries. For instance, HydraForce launched a patent-pending electro-proportional boom lock valve (EHBL) in February 2023. This valve is a testament to the ongoing technological advancements in hydraulic proportional valves. The EHBL valve comes with an integral check mechanism, ensuring critical protection for hydraulic systems. This feature safeguards the system against potential damage from hose ruptures or bursts, preventing uncontrolled fluid flow. Additionally, the integration of artificial intelligence and machine vision in valve design and manufacturing is streamlining production processes and improving valve performance.
In the aerospace industry, lightweight valve materials and remote monitoring systems are gaining popularity to reduce weight and enhance safety. Valve manufacturers are also focusing on valve durability and reliability through rigorous testing and calibration. Industrial automation applications are driving the demand for valve cartridges, servo valves, and electro-pneumatic valves. Valve maintenance and repair services are also an essential part of the market, ensuring optimal valve performance and longevity. The market is governed by various standards, including NFPA, ISO, and CE marking, ensuring safety and quality. Overall, the market is evolving to meet the demands of various industries, offering precise control, enhanced safety, and improved efficiency.
The Hydraulic proportional valves segment was valued at USD 803.30 million in 2018 and showed a gradual increase during the forecast period.
Regional Analysis
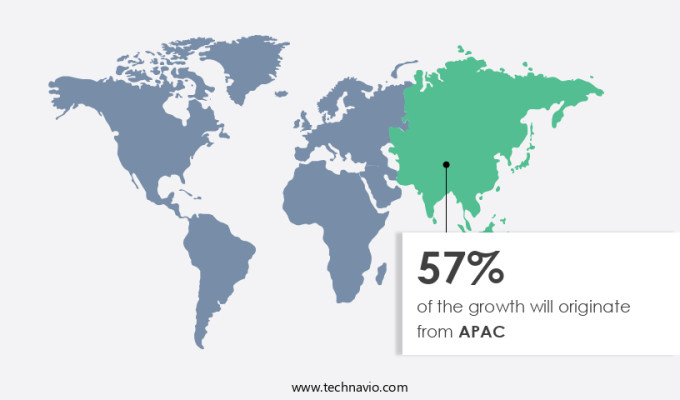
APAC is estimated to contribute 57% to the growth of the global market during the forecast period. Technavio's analysts have elaborately explained the regional trends and drivers that shape the market during the forecast period.
The market in the APAC region is witnessing significant growth due to increasing industrialization and strategic acquisitions. One notable transaction occurred in July 2023, when BDK Valves and Gurukrupa Group acquired Theis Precision Steel India Pvt. Ltd from Tata Steel Ltd. This acquisition underscores the importance of expanding industrial capabilities in the region and strengthens BDK Valves' market position. Known for delivering flow control solutions to international clients, BDK Valves aims to leverage this acquisition to broaden its product offerings and solidify its industry presence. In the market, various components play essential roles. Valve pistons and seals ensure efficient operation, while valve controllers and machine vision enable precise control.
Valve design and manufacturing equipment are crucial for producing high-quality valves, and artificial intelligence optimizes their performance. Pressure relief valves, cartridges, and servo valves are integral to safety systems and process control. Hydraulic and pneumatic systems rely on valves for fluid power, and valve maintenance and calibration ensure their longevity. The aerospace industry and construction equipment sectors heavily utilize directional control valves and hydraulic actuators. Valve response time, operating temperature, and material are critical factors in their selection. NFPA standards and ISO certifications ensure safety and compliance, while remote monitoring and valve repair services enhance operational efficiency. Valve installation, replacement, and maintenance are essential aspects of the valve industry.
Valve durability and performance are crucial for various applications, including packaging machinery, medical devices, and fluid power systems. Valve flow rate and operating pressure are significant considerations in their design and application. Valve actuators, such as pneumatic and electro-pneumatic, facilitate automation and process control. In conclusion, the market is a dynamic and evolving sector, driven by industrial growth and technological advancements. Strategic acquisitions, like the one involving Theis Precision Steel India Pvt. Ltd, highlight the importance of expanding capabilities and enhancing product offerings. The integration of various components, such as valve pistons, seals, controllers, and manufacturing equipment, contributes to the development of efficient and reliable valve solutions.
Market Dynamics
Our researchers analyzed the data with 2023 as the base year, along with the key drivers, trends, and challenges. A holistic analysis of drivers will help companies refine their marketing strategies to gain a competitive advantage.
What are the key market drivers leading to the rise in the adoption of Proportional Valve Industry?
- The market's growth is primarily attributed to the frequent introduction of new products. With a focus on innovation and continuous product development, companies are able to capture consumer interest and maintain a competitive edge.
- The market is witnessing substantial growth due to the continuous launch of innovative products. These new introductions are instrumental in improving machine performance and reducing costs for manufacturers. For instance, Moog Inc. unveiled two new direct-operated valve series in April 2024: the D93x Servo-proportional Valve Series and the D92x Proportional Valve Series. The D93x Series, consisting of the D936 (ISO 4401 size 03) and D937 (ISO 4401 size 05), is designed for 4/4-way operation. These valves offer unique features and capabilities that cater to the industry's evolving needs. The D93x Series' engineering enables enhanced reliability and flexibility for various applications.
- This trend of product innovation underscores the market's dynamic nature and the industry's commitment to delivering advanced solutions.
What are the market trends shaping the Proportional Valve Industry?
- Inorganic growth strategies, such as mergers and acquisitions or strategic partnerships, are increasingly popular among companies in the market. This trend signifies a shift towards more aggressive business expansion tactics.
- The market is experiencing substantial growth due to strategic mergers and acquisitions. For instance, Valmet's acquisition of Neles in April 2022 expanded Valmet's share in the valve market by approximately 1%. Valmet, a leading global provider of process technologies, automation, and services for pulp, paper, and energy sectors, recorded net sales of around USD 4.6 billion in 2020. Neles, a major supplier of mission-critical flow control solutions and services for process industries, reported sales of approximately USD621 million in the same year. Post-merger, Valmet has integrated Neles' expertise to enhance its product portfolio, focusing on valve piston, valve controller, valve seal, valve design, manufacturing equipment, and valve response time.
- Additionally, the integration of machine vision and artificial intelligence technologies is expected to boost valve efficiency and improve valve cartridge and directional control valve performance. The aerospace industry and construction equipment sectors are significant end-users, emphasizing the importance of valve design and valve mounting for pressure relief and precise control.
What challenges does the Proportional Valve Industry face during its growth?
- The higher initial costs represent a significant challenge impeding the growth of the industry.
- The market encounters a notable challenge due to the higher initial investment required for these advanced components. In contrast to solenoid valves, proportional valves feature intricate architectures, integrating advanced materials and intricate electronic components. These elements are crucial for delivering precise flow and pressure modulation, a significant advantage of proportional valves. However, this complexity leads to a higher upfront expense for buyers. This initial cost hurdle may deter various industries, particularly those with stringent budgets. The advanced design and materials used in proportional valves not only inflate manufacturing costs but also necessitate specialized expertise for installation and maintenance.
- In industrial automation applications, such as pneumatic systems and process control, safety systems, and valve flow rate regulation, precise control is essential. Proportional valves, including servo valves and electro-hydraulic valves, excel in providing accurate flow and pressure modulation. Regulations, such as NFPA standards and ISO standards, mandate safety and performance requirements for valves in various industries. Valve testing and repair are also crucial aspects of maintaining optimal system performance. To meet these demands, proportional valves offer superior control and reliability, making them a worthwhile investment despite their higher initial cost. In summary, the market presents a significant investment for end-users due to the advanced materials and electronic components required for their design.
- However, their ability to deliver precise flow and pressure modulation, as well as their compliance with industry regulations, makes them an indispensable component in various industrial applications.
Exclusive Customer Landscape
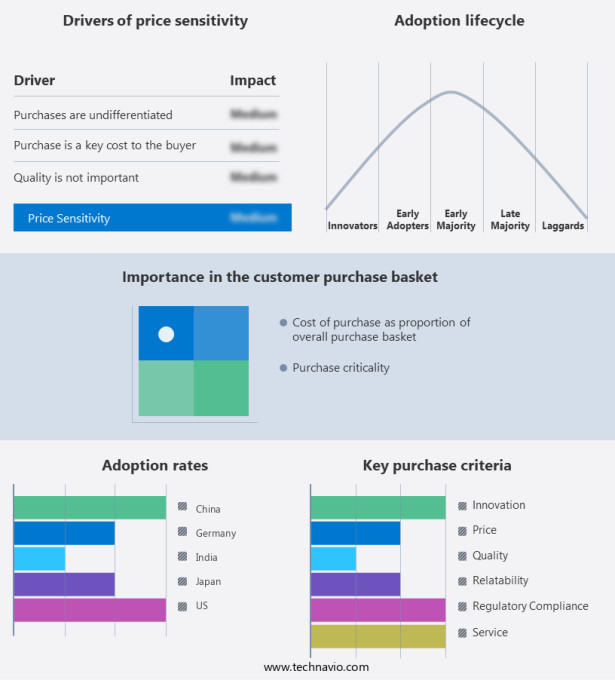
The proportional valve market forecasting report includes the adoption lifecycle of the market, covering from the innovator's stage to the laggard's stage. It focuses on adoption rates in different regions based on penetration. Furthermore, the proportional valve market report also includes key purchase criteria and drivers of price sensitivity to help companies evaluate and develop their market growth analysis strategies.
Customer Landscape
Key Companies & Market Insights
Companies are implementing various strategies, such as strategic alliances, proportional valve market forecast, partnerships, mergers and acquisitions, geographical expansion, and product/service launches, to enhance their presence in the industry.
AAK Industry Co Ltd - This company specializes in the production and distribution of Cartridge Directional Valves, Flow Control Valves, Pressure Control Valves, and Solenoid Valves. Our product portfolio caters to various industries, providing optimal solutions for fluid control and pressure management. Each valve type undergoes rigorous testing to ensure superior performance and durability. By incorporating advanced technologies and adhering to industry standards, we deliver reliable and efficient valve systems. Our commitment to innovation and quality sets US apart in the competitive marketplace.
The industry research and growth report includes detailed analyses of the competitive landscape of the market and information about key companies, including:
- AAK Industry Co Ltd
- Adiffer
- Continental Hydraulics Inc.
- Eaton Corp plc
- Emerson Electric Co.
- Excellent Hydraulics
- HAWE Hydraulik SE
- Hydraulics And Pneumatics
- Jiangsu Jiayite Hydraulics Co Ltd.
- Jinan Longli Hydraulic Device Co. Ltd.
- Magnet-Schultz GmbH & Co. KG
- Moog Inc.
- PARKER HANNIFIN CORP.
- PECULIAR PLASTIC MACHINERY
- Shini USA
- THM Huade Hydraulics Pvt Ltd
- Uflow Automation
- UNITED HYDRAULIC CONTROL
- Yuken
Qualitative and quantitative analysis of companies has been conducted to help clients understand the wider business environment as well as the strengths and weaknesses of key industry players. Data is qualitatively analyzed to categorize companies as pure play, category-focused, industry-focused, and diversified; it is quantitatively analyzed to categorize companies as dominant, leading, strong, tentative, and weak.
Recent Development and News in Proportional Valve Market
- In February 2024, Emerson Electric Company, a leading provider of technology and engineering solutions, introduced the Fisher PROportional 2000 Series valve, which offers enhanced accuracy and reliability for process control applications (Emerson Electric Company Press Release). In July 2024, Honeywell International Inc. And Flowserve Corporation announced a strategic partnership to expand their combined offerings in the market, aiming to provide customers with comprehensive flow control solutions (Honeywell International Inc. Press Release).
- In March 2025, Danfoss, a leading manufacturer of proportional valves, completed the acquisition of Eaton's hydraulics business, significantly expanding its presence in the industrial hydraulics market and strengthening its position as a global provider of flow control solutions (Danfoss Press Release). In May 2025, the European Union passed the new Ecodesign Regulation for industrial valves, which includes energy efficiency requirements for proportional valves, driving the market towards more energy-efficient solutions (European Commission Press Release).
Research Analyst Overview
- In the intricate world of industrial process control, proportional valves play a pivotal role in maintaining pressure control and ensuring optimal system performance. The valve life cycle is a critical factor in maximizing their effectiveness and minimizing downtime. To achieve this, closed-loop control systems are employed, which provide real-time feedback and adjustments based on valve dynamics and process variables. Valve design software and digital control technologies enable precise torque control, valve actuation, and position control, ensuring accurate open-loop and feedback control. Valve reliability analysis and calibration techniques are essential for maintaining valve performance and preventing valve failure.
- Valve maintenance schedules and certification are crucial for ensuring regulatory compliance and prolonging valve life. Valve diagnostics and troubleshooting tools help identify and address issues before they escalate, while valve training equips operators with the necessary skills to optimize valve performance and minimize spare parts usage. Valve simulation and modeling enable predictive maintenance and process optimization, while valve testing equipment ensures valve functionality and adherence to industry standards. Force control and speed control are additional features that enhance valve functionality and flexibility. The market for proportional valves continues to evolve, with a focus on integration with other control systems and advanced analytics for valve optimization and failure analysis.
- Valve regulations and certification requirements remain a significant consideration for manufacturers and end-users alike.
Dive into Technavio's robust research methodology, blending expert interviews, extensive data synthesis, and validated models for unparalleled Proportional Valve Market insights. See full methodology.
|
Market Scope |
|
|
Report Coverage |
Details |
|
Page number |
204 |
|
Base year |
2023 |
|
Historic period |
2018-2022 |
|
Forecast period |
2024-2028 |
|
Growth momentum & CAGR |
Accelerate at a CAGR of 6.4% |
|
Market growth 2024-2028 |
USD 594.4 million |
|
Market structure |
Fragmented |
|
YoY growth 2023-2024(%) |
5.1 |
|
Key countries |
US, China, Japan, Germany, and India |
|
Competitive landscape |
Leading Companies, Market Positioning of Companies, Competitive Strategies, and Industry Risks |
What are the Key Data Covered in this Proportional Valve Market Research and Growth Report?
- CAGR of the Proportional Valve industry during the forecast period
- Detailed information on factors that will drive the growth and forecasting between 2024 and 2028
- Precise estimation of the size of the market and its contribution of the industry in focus to the parent market
- Accurate predictions about upcoming growth and trends and changes in consumer behaviour
- Growth of the market across APAC, North America, Europe, South America, and Middle East and Africa
- Thorough analysis of the market's competitive landscape and detailed information about companies
- Comprehensive analysis of factors that will challenge the proportional valve market growth of industry companies
We can help! Our analysts can customize this proportional valve market research report to meet your requirements.


