Europe Railcar Leasing Market Size 2026-2030
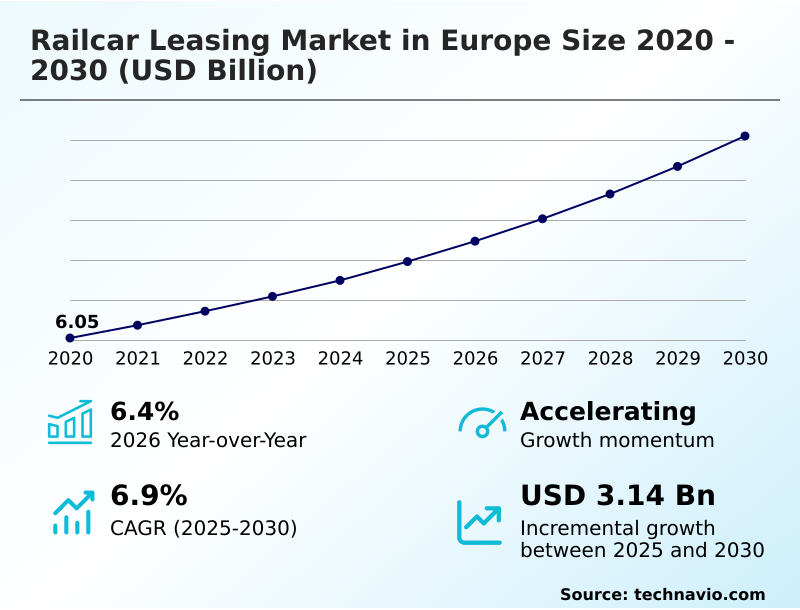
The europe railcar leasing market size is valued to increase by USD 3.14 billion, at a CAGR of 6.9% from 2025 to 2030. Increased funding by European Commission will drive the europe railcar leasing market.
Major Market Trends & Insights
- By Type - Freight cars segment was valued at USD 3.29 billion in 2024
- By End-user - Petroleum and chemical segment accounted for the largest market revenue share in 2024
Market Size & Forecast
- Market Opportunities: USD 5.05 billion
- Market Future Opportunities: USD 3.14 billion
- CAGR from 2025 to 2030 : 6.9%
Market Summary
- The railcar leasing market in Europe is undergoing a significant transformation, driven by the dual imperatives of sustainability and digitalization. A strong push toward decarbonization of freight is accelerating the modal shift from road to rail, increasing demand for efficient and modern rolling stock.
- Key industry verticals, including chemicals, agriculture, and manufacturing, rely on specialized leasing solutions to ensure supply chain resilience and cost-effectiveness. The integration of smart rail systems, encompassing telematics and real-time cargo tracking, is revolutionizing asset management.
- For example, a logistics provider handling bulk commodity transport can leverage predictive maintenance for railcars to schedule repairs proactively, minimizing downtime and ensuring compliance with European rail safety regulations. This shift toward data-driven operations improves rail freight efficiency and asset utilization optimization.
- However, the industry grapples with challenges such as the need for continuous rail infrastructure investment and the complexities of cross-border rail logistics. As companies navigate these dynamics, the ability to offer flexible, technologically advanced leasing packages, such as a full-service railcar lease, becomes a critical competitive differentiator, ensuring that rail transport remains a reliable and sustainable backbone for European commerce.
What will be the Size of the Europe Railcar Leasing Market during the forecast period?
Get Key Insights on Market Forecast (PDF) Get Free Sample
How is the Europe Railcar Leasing Market Segmented?
The europe railcar leasing industry research report provides comprehensive data (region-wise segment analysis), with forecasts and estimates in "USD million" for the period 2026-2030, as well as historical data from 2020-2024 for the following segments.
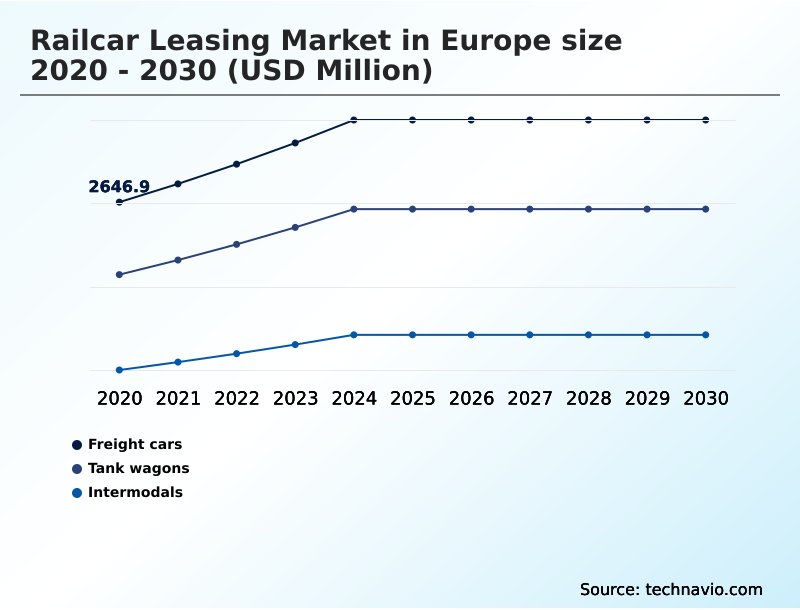
- Type
- Freight cars
- Tank wagons
- Intermodals
- End-user
- Petroleum and chemical
- Coal
- Agricultural products
- Others
- Service type
- Operating leases
- Full-service leases
- Long-term capital leases
- Geography
- Europe
- Germany
- France
- UK
- Europe
By Type Insights
The freight cars segment is estimated to witness significant growth during the forecast period.
Freight cars are foundational to industrial and commercial supply chains, primarily serving sectors that require cost-effective, long-distance transportation for dry bulk goods, packaged products, and general cargo.
The segment’s vitality is closely tied to industrial output and the ongoing modal shift toward sustainable freight transport. Modernization, driven by rail infrastructure investment and the integration of digital fleet management, enhances rail freight efficiency.
Leasing providers are benefiting from sustained demand as companies seek to avoid the high capital costs associated with ownership.
For instance, the adoption of advanced composite materials has led to a 10% reduction in tare weight on new freight car models, improving asset utilization optimization.
This trend, coupled with the need for specialized freight wagons and sophisticated rail supply chain management, reinforces the segment's importance.
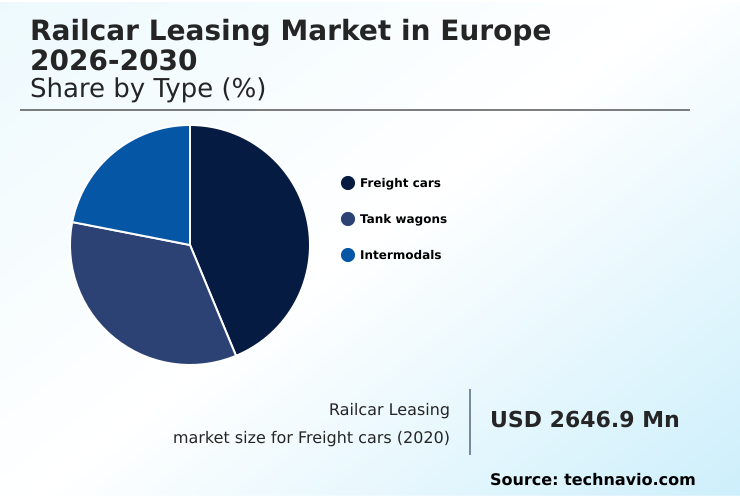
The Freight cars segment was valued at USD 3.29 billion in 2024 and showed a gradual increase during the forecast period.
Market Dynamics
Our researchers analyzed the data with 2025 as the base year, along with the key drivers, trends, and challenges. A holistic analysis of drivers will help companies refine their marketing strategies to gain a competitive advantage.
- Strategic decision-making in the industry increasingly revolves around the impact of digitalization on railcar leasing and finding the right balance in leasing structures. A thorough cost-benefit analysis of full-service lease versus operating lease options is crucial for logistics operators aiming to enhance fleet efficiency.
- The role of telematics in modern railcar maintenance is undisputed, offering insights that support predictive maintenance strategies for tank wagons and other specialized assets. This technology is vital for managing regulatory compliance in cross-border rail, a complex but essential aspect of European commerce. Key considerations include optimizing railcar fleets for cross-border trade and improving freight efficiency with smart railcar systems.
- As shippers face challenges in European intermodal freight transport, leasing providers are offering more sophisticated data analytics for rail freight route optimization. Furthermore, advancements in railcar design for hazardous materials are addressing critical safety concerns. Companies are also exploring innovative financing models for modern rolling stock acquisition to overcome high capital costs.
- Effective leasing strategies for handling seasonal freight demand, particularly in the agricultural sector, can improve asset utilization by over 20% compared to fixed-capacity models. Ultimately, technology integration is key to reducing rail transport operational costs and offering competitive logistics solutions.
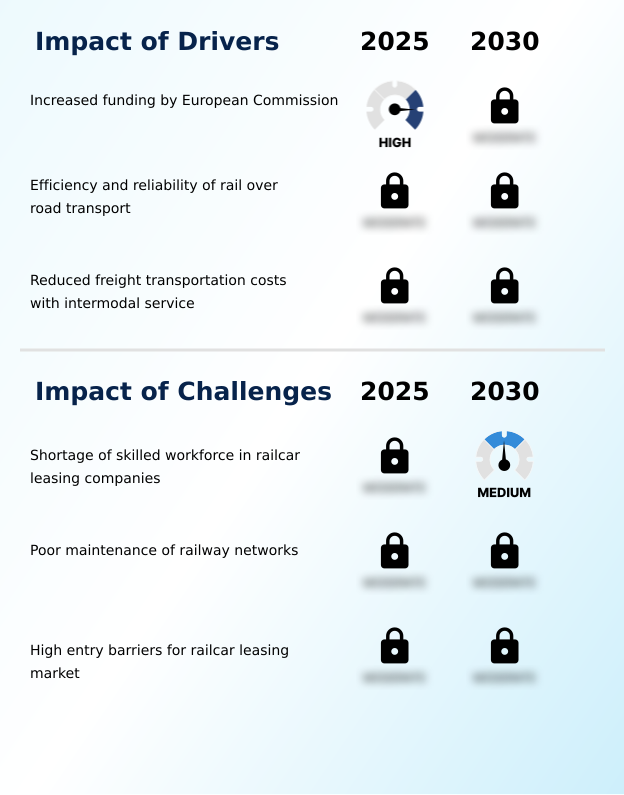
What are the key market drivers leading to the rise in the adoption of Europe Railcar Leasing Industry?
- Increased funding from the European Commission is a key driver for the market, bolstering rail infrastructure development and promoting a shift toward sustainable freight transport.
- Market growth is propelled by structural drivers that enhance the economic and environmental value proposition of rail. Increased rail infrastructure investment across the continent is expanding rail network capacity and reducing bottlenecks, which is fundamental for improving cross-border rail logistics.
- The efficiency of rail over road is a compelling factor; rail transport offers up to 75% lower emissions per ton-kilometer, aligning with European Green Deal objectives and corporate sustainability goals.
- This advantage is amplified in intermodal transport hubs, where seamless connectivity can reduce total logistics costs by over 15% on long-haul routes.
- The reliability of rail transport cost analysis and planning, supported by stable pricing in railcar leasing agreements, makes it an attractive alternative to the volatility of road freight, particularly for agricultural product logistics and industrial goods transport.
What are the market trends shaping the Europe Railcar Leasing Industry?
- An emerging trend in the market is the application of advanced coatings on railcars, a development aimed at enhancing durability and reducing lifecycle maintenance costs while improving overall asset performance.
- Key trends are reshaping asset value and operational models, with a strong focus on digitalization and sustainability. The integration of intelligent systems is paramount, with freight car telematics integration enabling real-time performance monitoring. This digital transformation in rail freight allows for predictive rail maintenance, which has been shown to reduce equipment failures by up to 30%.
- Concurrently, the application of advanced anti-corrosion coatings and smart coating technology is extending railcar lifecycle management, with some treatments adding years to asset operational life and cutting corrosion-related repair costs by half. This focus on durability enhances railcar residual value, a key metric for lessors.
- Furthermore, the use of rail freight data analytics for fleet optimization models is enabling leasing companies to improve asset allocation and respond to market shifts with greater agility, improving overall railway asset performance.
What challenges does the Europe Railcar Leasing Industry face during its growth?
- A shortage of skilled workforce within railcar leasing companies presents a significant challenge, affecting operational efficiency and the adoption of new technologies across the industry.
- Despite strong drivers, the market contends with significant operational and structural challenges that can impede growth. A primary constraint is railway network maintenance, where underinvestment in certain corridors leads to speed restrictions and service unreliability, increasing operational costs for freight operators by an estimated 10-15%. This issue directly impacts rail transport reliability.
- Another challenge is the high entry barriers, with the necessary rolling stock financing for a competitive fleet being prohibitively expensive for new entrants. The complexity of cross-border freight operations, including varied regulations and technical standards, further complicates rail supply chain management.
- Addressing these challenges requires a coordinated approach involving both public investment in infrastructure and private sector innovation in areas like sustainable logistics planning and rail asset investment strategies to modernize fleets and improve overall efficiency.
Exclusive Technavio Analysis on Customer Landscape
The europe railcar leasing market forecasting report includes the adoption lifecycle of the market, covering from the innovator’s stage to the laggard’s stage. It focuses on adoption rates in different regions based on penetration. Furthermore, the europe railcar leasing market report also includes key purchase criteria and drivers of price sensitivity to help companies evaluate and develop their market growth analysis strategies.
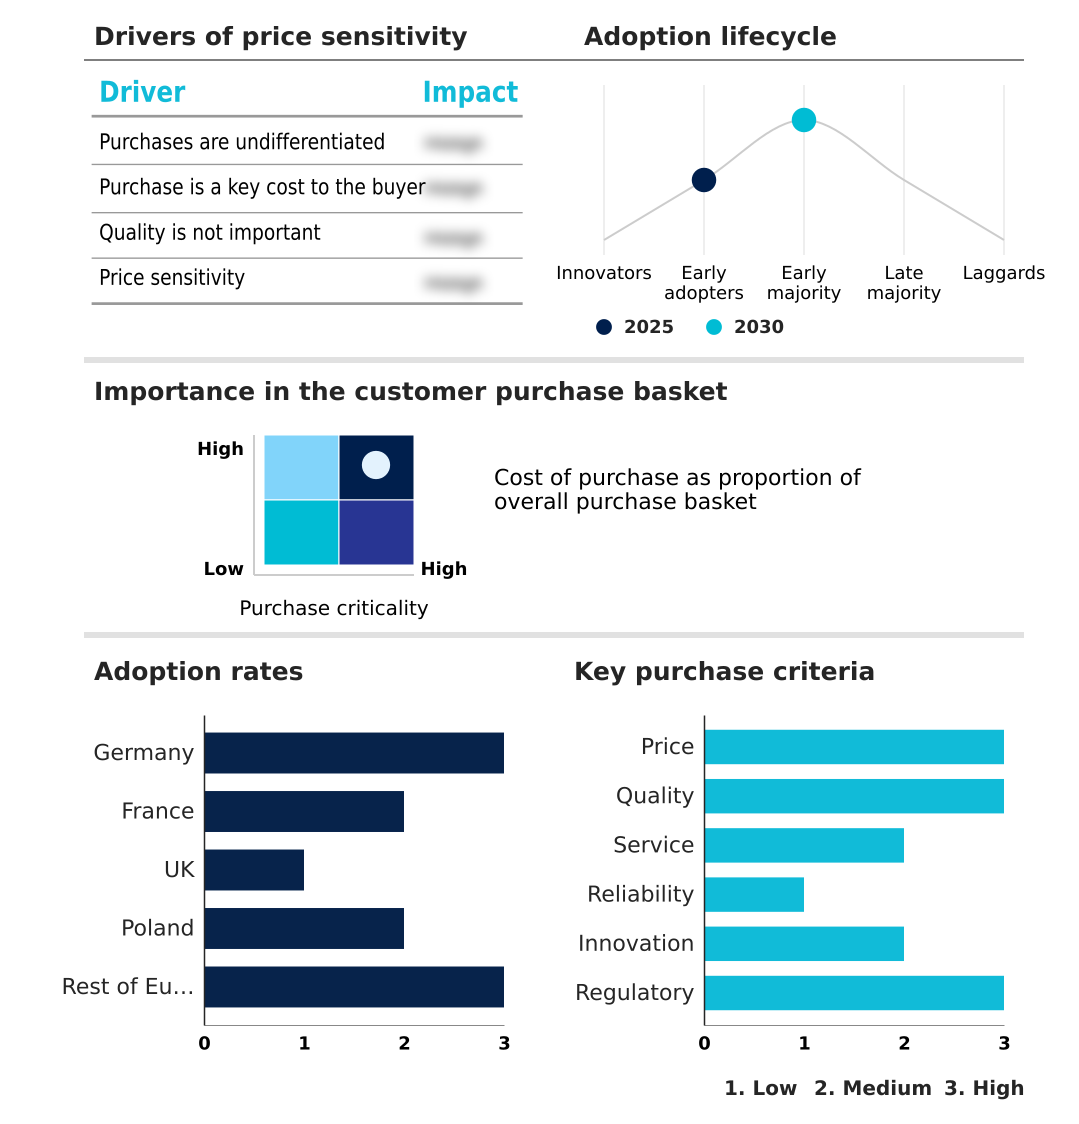
Customer Landscape of Europe Railcar Leasing Industry
Competitive Landscape
Companies are implementing various strategies, such as strategic alliances, europe railcar leasing market forecast, partnerships, mergers and acquisitions, geographical expansion, and product/service launches, to enhance their presence in the industry.
Akiem Group SAS - The company offers a wide range of rolling stock, value added leasing solutions, and industrial and maintenance solutions.
The industry research and growth report includes detailed analyses of the competitive landscape of the market and information about key companies, including:
- Akiem Group SAS
- Angel Trains Ltd.
- Beacon Rail Leasing Ltd.
- CargoUnit Sp z oo
- Ermewa Group
- ERR European Rail Rent GmbH
- European Loc Pool AG
- Eurowagon Sp z oo
- Eversholt Rail Group
- GATX Corp.
- Greenbrier Europe
- Macquarie Group Ltd.
- MFD Rail AG
- Nexrail
- Porterbrook Leasing Co. Ltd.
- Rail Innovators Group B.V.
- RAILPOOL GmbH
- Rock Rail Ltd
- Touax SCA
- Transwaggon GmbH
Qualitative and quantitative analysis of companies has been conducted to help clients understand the wider business environment as well as the strengths and weaknesses of key industry players. Data is qualitatively analyzed to categorize companies as pure play, category-focused, industry-focused, and diversified; it is quantitatively analyzed to categorize companies as dominant, leading, strong, tentative, and weak.
Recent Development and News in Europe railcar leasing market
- In September 2024, Akiem Group SAS announced a strategic partnership with a leading technology firm to integrate advanced digital fleet management and predictive maintenance solutions across its locomotive portfolio, aiming to enhance operational efficiency and asset availability.
- In November 2024, GATX Corp. completed the acquisition of a regional railcar leasing company, expanding its fleet of specialized tank wagons and strengthening its market presence for chemical and petroleum transport in Eastern Europe.
- In February 2025, Ermewa Group launched a new line of eco-friendly intermodal wagons constructed from advanced composite materials, designed to reduce weight and lower energy consumption by up to 15% per journey, supporting sustainability goals.
- In April 2025, Beacon Rail Leasing Ltd. announced a significant investment to expand its operations in the Nordic region, including the financing of new electric locomotives to support the decarbonization of freight and meet growing cross-border trade demand.
Dive into Technavio’s robust research methodology, blending expert interviews, extensive data synthesis, and validated models for unparalleled Europe Railcar Leasing Market insights. See full methodology.
| Market Scope | |
|---|---|
| Page number | 211 |
| Base year | 2025 |
| Historic period | 2020-2024 |
| Forecast period | 2026-2030 |
| Growth momentum & CAGR | Accelerate at a CAGR of 6.9% |
| Market growth 2026-2030 | USD 3142.2 million |
| Market structure | Fragmented |
| YoY growth 2025-2026(%) | 6.4% |
| Key countries | Germany, France, UK, Poland and Rest of Europe |
| Competitive landscape | Leading Companies, Market Positioning of Companies, Competitive Strategies, and Industry Risks |
Research Analyst Overview
- The market is advancing through the strategic integration of technology and a focus on specialized service offerings. The adoption of digital fleet management is no longer a niche capability but a central element of rolling stock asset management. Stakeholders are leveraging telematics in freight cars to achieve unprecedented supply chain transparency and asset utilization optimization.
- For boardroom consideration, the investment in smart rail systems and real-time cargo tracking is critical; platforms incorporating these features have demonstrated an ability to improve on-time delivery rates by up to 20%, directly impacting customer retention and profitability.
- The evolution of service models, from basic operating lease for railcars to comprehensive full-service railcar lease agreements, reflects a deeper partnership between lessors and clients. This trend is driven by the need for robust railcar maintenance services and expertise in navigating complex European rail safety regulations, especially for hazardous material rail transport and bulk commodity transport.
- The emphasis is on enhancing rail freight efficiency and ensuring the decarbonization of freight through modern, well-maintained assets.
What are the Key Data Covered in this Europe Railcar Leasing Market Research and Growth Report?
-
What is the expected growth of the Europe Railcar Leasing Market between 2026 and 2030?
-
USD 3.14 billion, at a CAGR of 6.9%
-
-
What segmentation does the market report cover?
-
The report is segmented by Type (Freight cars, Tank wagons, and Intermodals), End-user (Petroleum and chemical, Coal, Agricultural products, and Others), Service Type (Operating leases, Full-service leases, and Long-term capital leases) and Geography (Europe)
-
-
Which regions are analyzed in the report?
-
Europe
-
-
What are the key growth drivers and market challenges?
-
Increased funding by European Commission, Shortage of skilled workforce in railcar leasing companies
-
-
Who are the major players in the Europe Railcar Leasing Market?
-
Akiem Group SAS, Angel Trains Ltd., Beacon Rail Leasing Ltd., CargoUnit Sp z oo, Ermewa Group, ERR European Rail Rent GmbH, European Loc Pool AG, Eurowagon Sp z oo, Eversholt Rail Group, GATX Corp., Greenbrier Europe, Macquarie Group Ltd., MFD Rail AG, Nexrail, Porterbrook Leasing Co. Ltd., Rail Innovators Group B.V., RAILPOOL GmbH, Rock Rail Ltd, Touax SCA and Transwaggon GmbH
-
Market Research Insights
- Market dynamics are increasingly shaped by digital transformation in rail freight and a focus on operational excellence. The adoption of smart freight technology has a measurable impact; for instance, predictive rail maintenance systems have been shown to reduce unscheduled downtime by over 25%, directly improving railway asset performance.
- Furthermore, sophisticated rail freight data analytics enables more precise demand forecasting, with some operators achieving a 15% reduction in idle assets. This data-driven approach to rail supply chain management enhances rail transport reliability and supports complex cross-border freight operations.
- The financial structures are also evolving, with rolling stock financing and rail asset investment strategies adapting to provide more flexible railcar leasing agreements that align with the European Green Deal objectives and the demand for energy-efficient freight movement and sustainable logistics planning.
We can help! Our analysts can customize this europe railcar leasing market research report to meet your requirements.
 RIA -
RIA - 
