North America Railcar Leasing Market Size 2026-2030
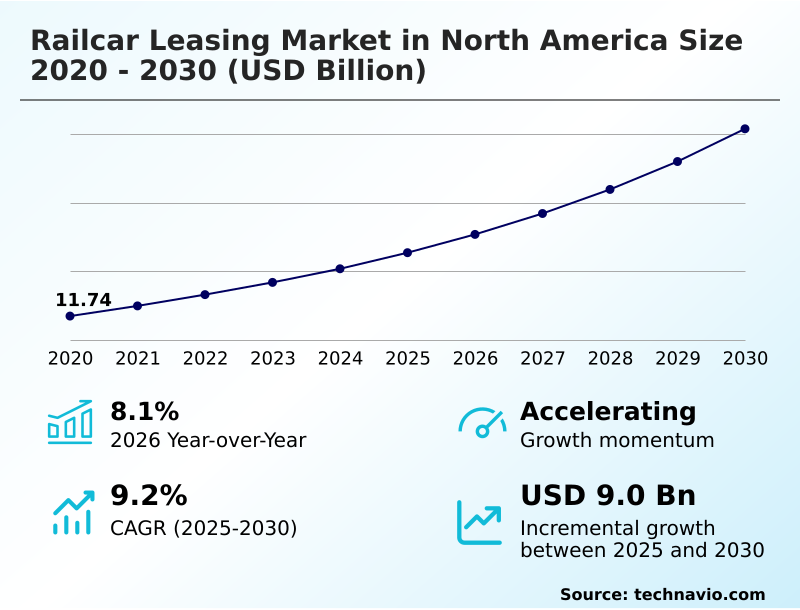
The north america railcar leasing market size is valued to increase by USD 9.00 billion, at a CAGR of 9.2% from 2025 to 2030. Sustained high fleet utilization and positive renewal dynamics will drive the north america railcar leasing market.
Major Market Trends & Insights
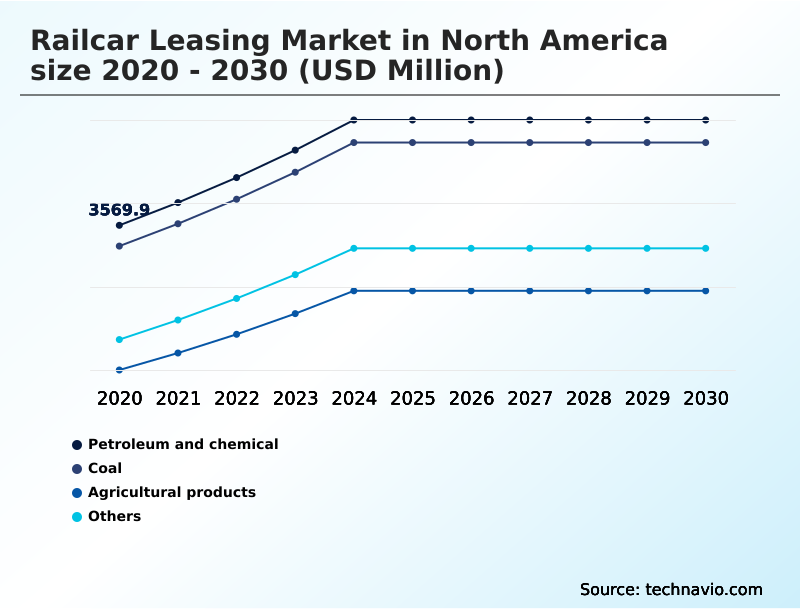
- By End-user - Petroleum and chemical segment was valued at USD 4.52 billion in 2024
- By Product - Freight cars segment accounted for the largest market revenue share in 2024
Market Size & Forecast
- Market Opportunities: USD 13.61 billion
- Market Future Opportunities: USD 9.00 billion
- CAGR from 2025 to 2030 : 9.2%
Market Summary
- The railcar leasing market in North America is defined by its resilience and strategic importance to the continent's supply chain. Growth is propelled by high fleet utilization rates and favorable lease renewal dynamics, which provide lessors with pricing power and predictable revenue streams.
- A key trend is the move toward modernization and sustainability, with investments in eco-friendly designs and smart technologies like predictive maintenance to improve efficiency. For instance, a shipper of agricultural products might leverage a leased fleet equipped with GPS and cargo sensors to optimize routes and ensure product integrity, reducing spoilage and transportation costs.
- However, the market faces challenges from macroeconomic volatility, which can dampen commodity demand, and the increasing complexity of regulatory compliance. To navigate this, lessors focus on strategic portfolio diversification and offering flexible leasing models, ensuring they can support essential industries while managing cyclical risks through robust asset lifecycle management and secondary market activity.
- This balance sustains the market's vital role in freight transportation.
What will be the Size of the North America Railcar Leasing Market during the forecast period?
Get Key Insights on Market Forecast (PDF) Get Free Sample
How is the North America Railcar Leasing Market Segmented?
The north america railcar leasing industry research report provides comprehensive data (region-wise segment analysis), with forecasts and estimates in "USD million" for the period 2026-2030, as well as historical data from 2020-2024 for the following segments.
- End-user
- Petroleum and chemical
- Coal
- Agricultural products
- Others
- Product
- Freight cars
- Tank cars
- Locomotives
- Type
- Full service leases
- Net leases
- Geography
- North America
- US
- Canada
- Mexico
- North America
By End-user Insights
The petroleum and chemical segment is estimated to witness significant growth during the forecast period.
The petroleum and chemical segment is a critical component, using specialized tank cars for hazardous materials transport. Demand for full-service operating lease agreements is driven by regulations requiring constant tank car qualification and adherence to complex recertification cycles.
Adopting telematics for real-time monitoring has enhanced cargo security by over 15%. The market provides vital asset management solutions, including railcar repair services and fleet management services for petroleum and chemical transport.
These railcar leasing programs are a core part of railway infrastructure maintenance, ensuring equipment remains compliant and efficient as lessors manage asset appreciation.
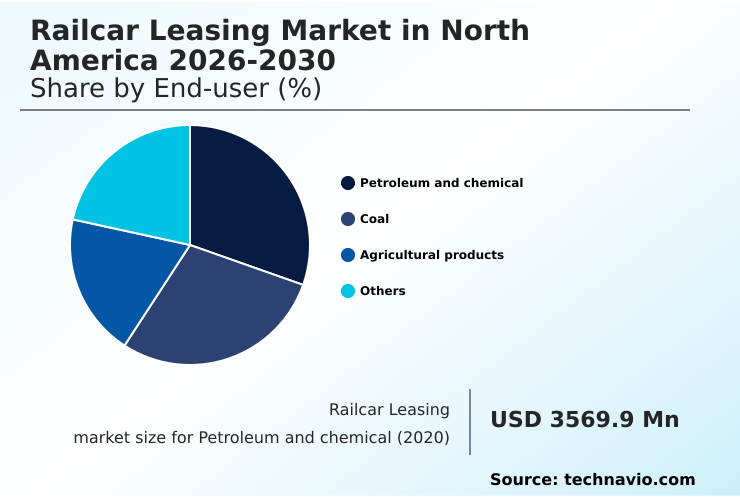
The Petroleum and chemical segment was valued at USD 4.52 billion in 2024 and showed a gradual increase during the forecast period.
Market Dynamics
Our researchers analyzed the data with 2025 as the base year, along with the key drivers, trends, and challenges. A holistic analysis of drivers will help companies refine their marketing strategies to gain a competitive advantage.
- The railcar leasing market in North America presents a complex decision matrix for shippers, often beginning with a choice between a full-service lease versus net lease railcar. The selection depends heavily on the commodity, with tank car leasing for chemical transport requiring rigorous oversight that favors full-service models.
- In contrast, shippers of bulk goods often utilize covered hopper cars for grain transport under more flexible terms. The rise of intermodal railcar leasing solutions reflects a broader shift in logistics. However, the impact of steel tariffs on railcar manufacturing continues to constrain new supply, making existing fleet management crucial.
- Financing railcar leasing through asset-backed securities has become a key strategy for fleet growth. Operationally, the adoption of predictive maintenance for leased railcar fleets is a major trend. This is especially vital for ensuring regulatory compliance for hazardous material railcars. The railcar fleet utilization rate impact on pricing is direct and significant.
- Specialized needs are met through locomotive leasing for short line railroads and the use of gondola car leasing for scrap metal recycling. Strategic decisions involve managing railcar investment partnerships effectively and applying disciplined asset lifecycle management for freight cars. Specific applications like railcar leasing for crude by rail transport and railcar leasing for agricultural products export highlight market diversity.
- The system supports intricate cross-border rail logistics for automotive parts using multi-level autorack car leasing specifications. For colder climates, cold-weather modifications for Canadian railcars are standard. The backbone of modern operations is telematics for real-time railcar condition monitoring, which feeds into effective railcar re-marketing strategies in secondary markets.
What are the key market drivers leading to the rise in the adoption of North America Railcar Leasing Industry?
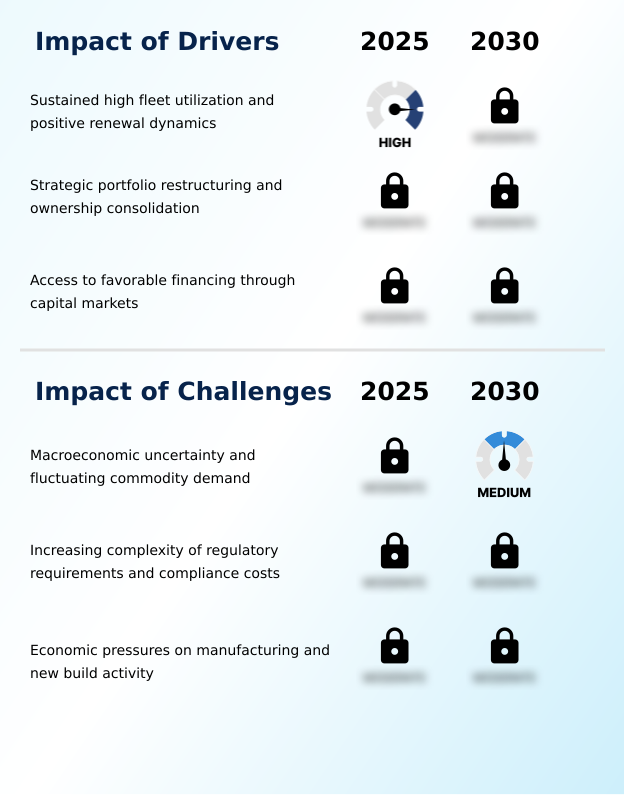
- Sustained high fleet utilization and positive renewal dynamics are key drivers propelling market growth.
- Key market drivers include sustained high equipment demand and strategic financial maneuvers. Persistently high fleet utilization, often exceeding 98%, ensures a high renewal success rate and underpins strong lease price index performance for various freight railcar types.
- Shippers prefer leasing, reinforcing the value of both full-service and net operating lease models. A critical driver is consolidation through railcar investment partnerships, which allows lessors to acquire fleets with favorable below-market debt.
- Access to capital via railcar asset-backed securities provides liquidity for fleet expansion, supporting short line railroad operations, heavy civil construction, and rail transit operations. Regular railcar inspection services and railcar cleaning services are integral to these operations.
What are the market trends shaping the North America Railcar Leasing Industry?
- The market is witnessing a notable trend toward the increasing adoption of technologically advanced railcar solutions. This shift is reshaping fleet management and operational efficiency.
- A prominent trend is the integration of digital technologies and a focus on operational resilience. Adopting telematics for real-time monitoring and predictive maintenance has reduced unscheduled downtime by 30%. This shift supports high fleet utilization rates as supply constraints for new freight cars and gondolas persist.
- Lessors achieve significant renewal lease rate changes by modernizing fleets for renewable fuels transport and finished vehicle logistics. This strategic management enhances railcar re-marketing opportunities and improves fleet deployment accuracy by over 20% through better railcar maintenance management. These upgrades are vital for sectors like scrap metal brokerage and require precise railcar accounting services.
What challenges does the North America Railcar Leasing Industry face during its growth?
- Macroeconomic uncertainty and fluctuating commodity demand represent a key challenge affecting industry growth.
- The market faces challenges from economic pressures and complex regulatory burdens. Uncertainty constrains new build activity, leading to anemic orders for covered hopper cars. This scarcity, while supporting rates, elevates risk. A significant challenge is the cost of recertification cycles, with tank car qualification work increasing maintenance expenses by over 15% for hazardous materials transport.
- To mitigate this, lessors use disciplined asset lifecycle management, strategic freight car pooling, and focus on sectors like coal transport logistics. They offer flexible sale leaseback transactions and per diem railcar leases, complemented by railcar storage solutions, railcar refurbishment, and railcar modification services to extend asset life.
Exclusive Technavio Analysis on Customer Landscape
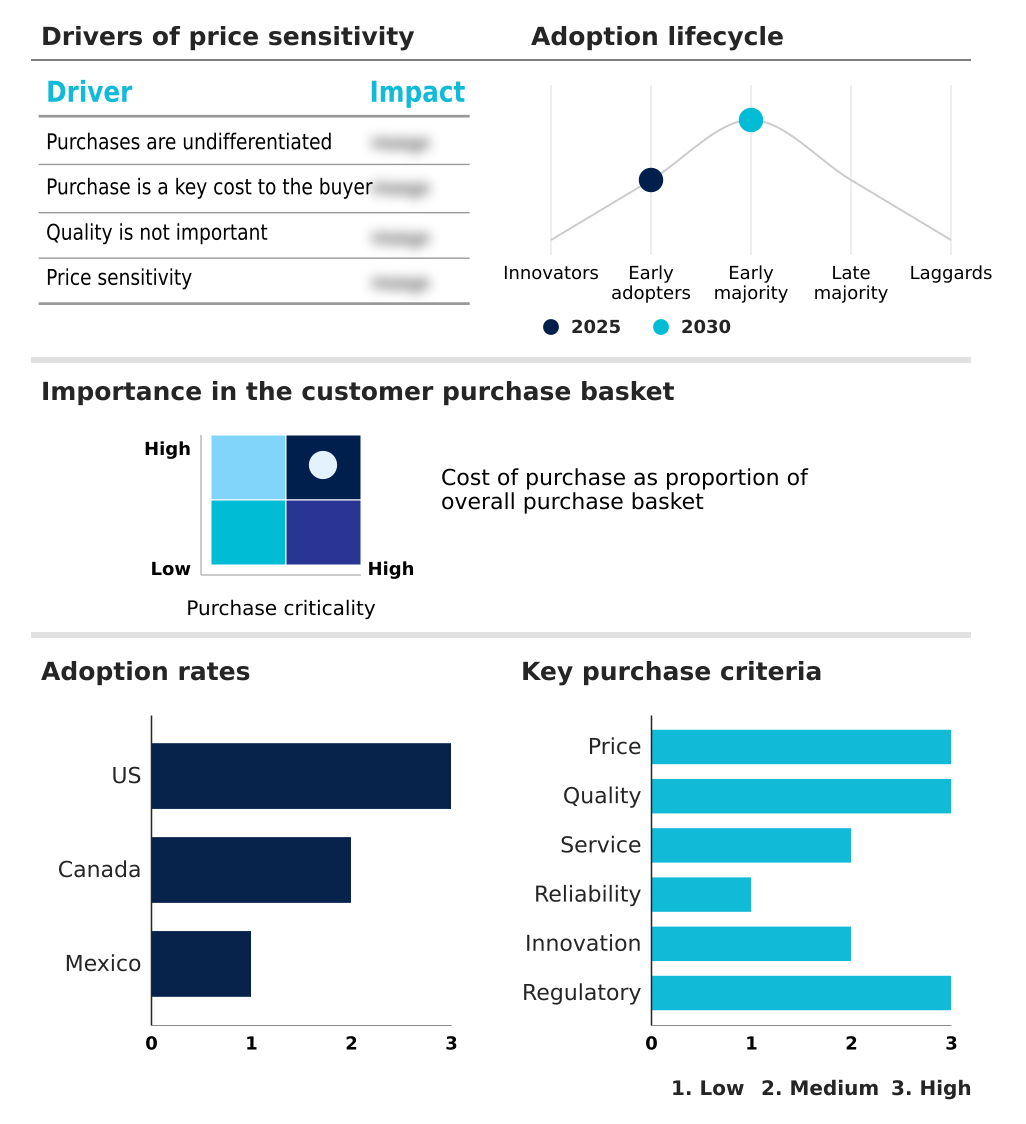
The north america railcar leasing market forecasting report includes the adoption lifecycle of the market, covering from the innovator’s stage to the laggard’s stage. It focuses on adoption rates in different regions based on penetration. Furthermore, the north america railcar leasing market report also includes key purchase criteria and drivers of price sensitivity to help companies evaluate and develop their market growth analysis strategies.
Customer Landscape of North America Railcar Leasing Industry
Competitive Landscape
Companies are implementing various strategies, such as strategic alliances, north america railcar leasing market forecast, partnerships, mergers and acquisitions, geographical expansion, and product/service launches, to enhance their presence in the industry.
American Industrial Transport - Offers specialized railcar leasing solutions, including covered hoppers, tank cars, and gondolas, for diverse industrial freight requirements.
The industry research and growth report includes detailed analyses of the competitive landscape of the market and information about key companies, including:
- American Industrial Transport
- ANCAF 23 S.A. de C.V
- Everest Railcar Services Inc.
- First Citizens Bancshares Inc.
- GATX Corp.
- GLNX Corp.
- Herzog Contracting Corp.
- Infinity Transport LLC
- Mitsui Rail Capital LLC
- PFL Petroleum Services Ltd.
- PNW Railcars Inc.
- RESIDCO
- RTEX Rail
- Sasser Family Co.
- The David J. Joseph Co.
- The Greenbrier Companies Inc.
- Trinity Industries Inc.
- TTX Co
- Union Tank Car Co.
- VTG Aktiengesellschaft
Qualitative and quantitative analysis of companies has been conducted to help clients understand the wider business environment as well as the strengths and weaknesses of key industry players. Data is qualitatively analyzed to categorize companies as pure play, category-focused, industry-focused, and diversified; it is quantitatively analyzed to categorize companies as dominant, leading, strong, tentative, and weak.
Recent Development and News in North america railcar leasing market
- In January 2025, GATX Corp. and Brookfield Infrastructure finalized the acquisition of a major rail operating lease portfolio, adding approximately 101,000 railcars to their joint venture.
- In February 2025, The Greenbrier Companies Inc. completed a $300 million railcar asset-backed securities issuance, securing long-term non-recourse financing to support leasing growth.
- In December 2024, Trinity Industries Inc. completed a strategic restructuring of its railcar investment partnerships, consolidating sole ownership of significant, diversified railcar fleets.
- In March 2025, industry reports highlighted the growing implementation of IoT-enabled sensors and AI-powered predictive maintenance in leased fleets, revolutionizing railcar asset management.
Dive into Technavio’s robust research methodology, blending expert interviews, extensive data synthesis, and validated models for unparalleled North America Railcar Leasing Market insights. See full methodology.
| Market Scope | |
|---|---|
| Page number | 197 |
| Base year | 2025 |
| Historic period | 2020-2024 |
| Forecast period | 2026-2030 |
| Growth momentum & CAGR | Accelerate at a CAGR of 9.2% |
| Market growth 2026-2030 | USD 9003.5 million |
| Market structure | Fragmented |
| YoY growth 2025-2026(%) | 8.1% |
| Key countries | US, Canada and Mexico |
| Competitive landscape | Leading Companies, Market Positioning of Companies, Competitive Strategies, and Industry Risks |
Research Analyst Overview
- The railcar leasing market functions as a critical enabler of North American commerce, characterized by disciplined capital allocation and operational excellence. Core activities revolve around managing extensive portfolios of covered hopper cars, gondolas, and other freight cars to maintain high fleet utilization rates.
- The industry leverages financial instruments like railcar asset-backed securities and manages complex railcar investment partnerships to fund growth and optimize returns. A key boardroom focus is navigating stringent tank car qualification mandates and recertification cycles through advanced asset lifecycle management.
- The implementation of predictive maintenance and telematics for real-time monitoring has proven effective, reducing unscheduled downtime by over 25% compared to traditional methods.
- This allows lessors to maximize the value of both full-service operating lease and net operating lease agreements, ensuring sustained performance despite economic pressures on new build activity and the complexities of hazardous materials transport and cross-border supply chains.
What are the Key Data Covered in this North America Railcar Leasing Market Research and Growth Report?
-
What is the expected growth of the North America Railcar Leasing Market between 2026 and 2030?
-
USD 9.00 billion, at a CAGR of 9.2%
-
-
What segmentation does the market report cover?
-
The report is segmented by End-user (Petroleum and chemical, Coal, Agricultural products, and Others), Product (Freight cars, Tank cars, and Locomotives), Type (Full service leases, and Net leases) and Geography (North America)
-
-
Which regions are analyzed in the report?
-
North America
-
-
What are the key growth drivers and market challenges?
-
Sustained high fleet utilization and positive renewal dynamics, Macroeconomic uncertainty and fluctuating commodity demand
-
-
Who are the major players in the North America Railcar Leasing Market?
-
American Industrial Transport, ANCAF 23 S.A. de C.V, Everest Railcar Services Inc., First Citizens Bancshares Inc., GATX Corp., GLNX Corp., Herzog Contracting Corp., Infinity Transport LLC, Mitsui Rail Capital LLC, PFL Petroleum Services Ltd., PNW Railcars Inc., RESIDCO, RTEX Rail, Sasser Family Co., The David J. Joseph Co., The Greenbrier Companies Inc., Trinity Industries Inc., TTX Co, Union Tank Car Co. and VTG Aktiengesellschaft
-
Market Research Insights
- The railcar leasing market is characterized by robust operational dynamics and disciplined financial strategies. Lessors consistently achieve high fleet management services efficiency, with some operators reporting fleet utilization rates nearing 99%, far surpassing typical industrial asset benchmarks.
- This tight capacity, coupled with strong railcar re-marketing in active secondary markets, allows for significant pricing power during contract renewals, where lease rate changes have been observed to increase by over 20%. Such performance is reinforced by strong demand for various freight railcar types, supporting both short line railroad operations and larger Class I carriers.
- Asset management solutions focus on maximizing returns through a mix of full-service and net leasing options, providing shippers with the flexibility needed to navigate fluctuating commodity cycles and maintain efficient cross-border supply chains.
We can help! Our analysts can customize this north america railcar leasing market research report to meet your requirements.
 RIA -
RIA - 
