
Recreational Vehicle (RV) Market Size 2026-2030
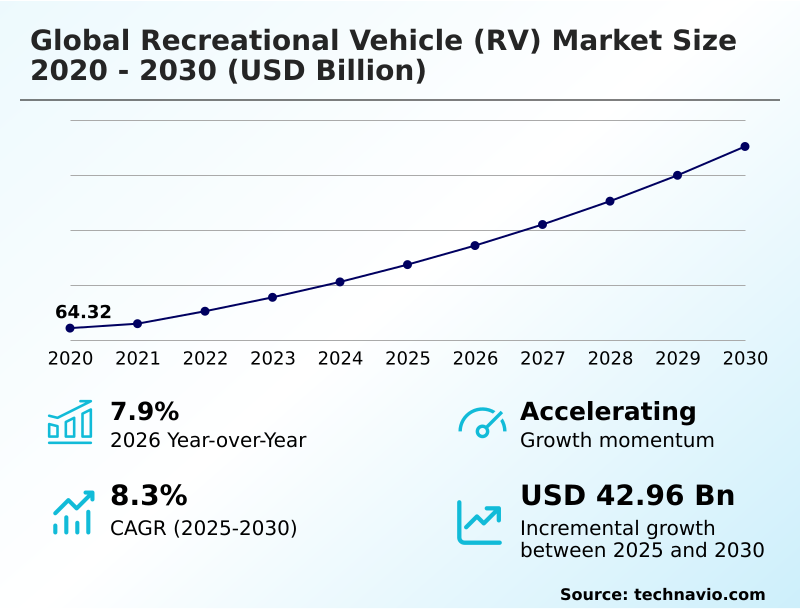
The recreational vehicle (rv) market size is valued to increase by USD 42.96 billion, at a CAGR of 8.3% from 2025 to 2030. Increasing adoption of RVs by different generations of consumers will drive the recreational vehicle (rv) market.
Major Market Trends & Insights
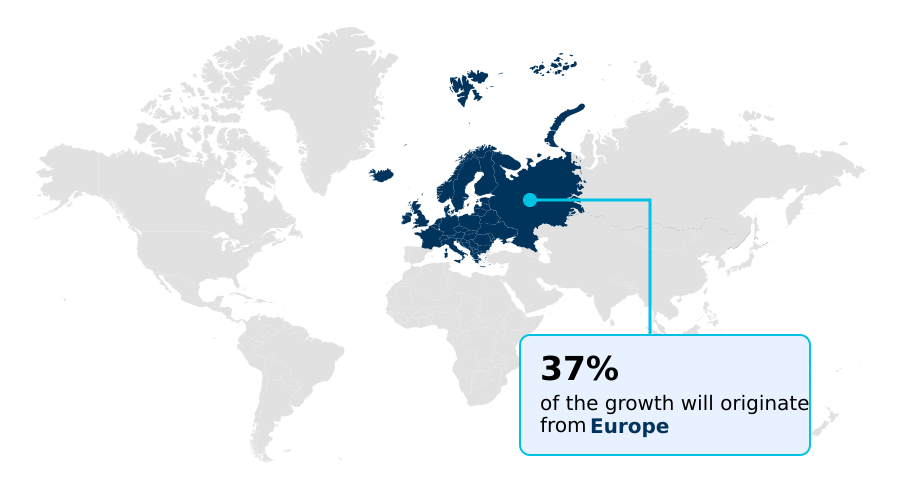
- Europe dominated the market and accounted for a 37.3% growth during the forecast period.
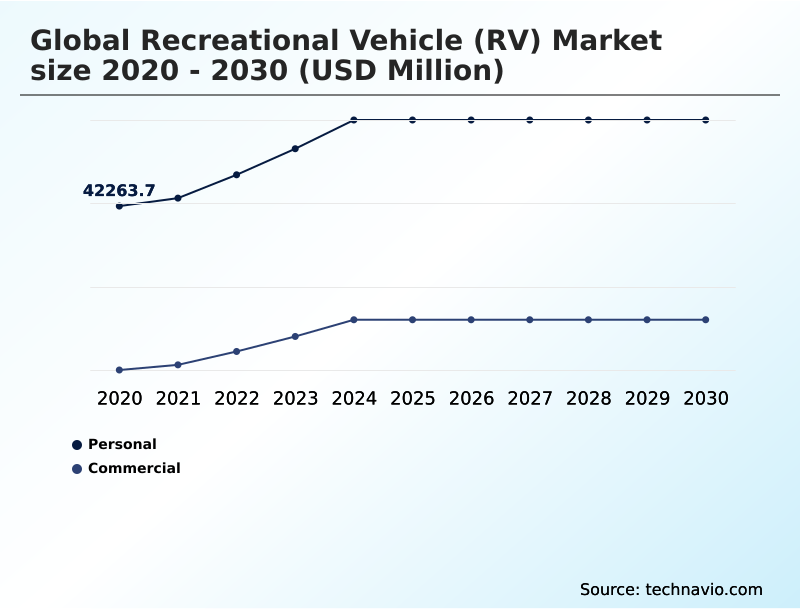
- By Application - Personal segment was valued at USD 52.88 billion in 2024
- By Product - Towable RVs segment accounted for the largest market revenue share in 2024
Market Size & Forecast
- Market Opportunities: USD 66.05 billion
- Market Future Opportunities: USD 42.96 billion
- CAGR from 2025 to 2030 : 8.3%
Market Summary
- The recreational vehicle (RV) market is undergoing a significant transformation, driven by evolving consumer lifestyles and technological advancements. Demand is no longer confined to a single demographic; instead, a diverse range of users is embracing the flexibility of mobile living for leisure, remote work, and long-term travel.
- This shift is compelling manufacturers to innovate beyond basic amenities, focusing on integrating smart RV systems, advanced safety technologies, and sustainable energy solutions like solar power integration. A key business scenario involves optimizing supply chains to manage the complexity of sourcing both automotive systems and residential components, where a disruption in one can halt production.
- While the appeal of the open road is a powerful driver, the market must navigate challenges such as the high maintenance costs of complex electrical networks and plumbing systems and a persistent shortage of skilled technicians. Success hinges on balancing luxury and customization with affordability and reliability, ensuring a positive user experience for a new generation of travelers.
What will be the Size of the Recreational Vehicle (RV) Market during the forecast period?
Get Key Insights on Market Forecast (PDF) Get Free Sample
How is the Recreational Vehicle (RV) Market Segmented?
The recreational vehicle (rv) industry research report provides comprehensive data (region-wise segment analysis), with forecasts and estimates in "USD million" for the period 2026-2030, as well as historical data from 2020-2024 for the following segments.
- Application
- Personal
- Commercial
- Product
- Towable RVs
- Motorized RVs
- Fuel type
- Gasoline
- Diesel
- Others
- Geography
- North America
- US
- Canada
- Mexico
- Europe
- Germany
- France
- UK
- APAC
- China
- Japan
- Australia
- South America
- Brazil
- Argentina
- Middle East and Africa
- Saudi Arabia
- UAE
- South Africa
- Rest of World (ROW)
- North America
By Application Insights
The personal segment is estimated to witness significant growth during the forecast period.
The personal use segment is driven by a strong consumer shift toward experiential travel and outdoor recreation.
Demand for a self-directed mobile living environment has spurred growth in both towable RVs, like travel trailers and fifth wheel trailers, and motorized RVs, including the class a motorhome and smaller campervans.
Consumers prioritize mobile accommodations that facilitate recreational road travel and domestic tourism. This trend is fueling broad market expansion, with wholesale shipments in certain months showing increases of nearly 14% year-over-year.
As preferences evolve, the distinction between various vehicle types, such as the versatile class b motorhome, continues to blur, reflecting a diverse user base seeking flexible travel solutions.
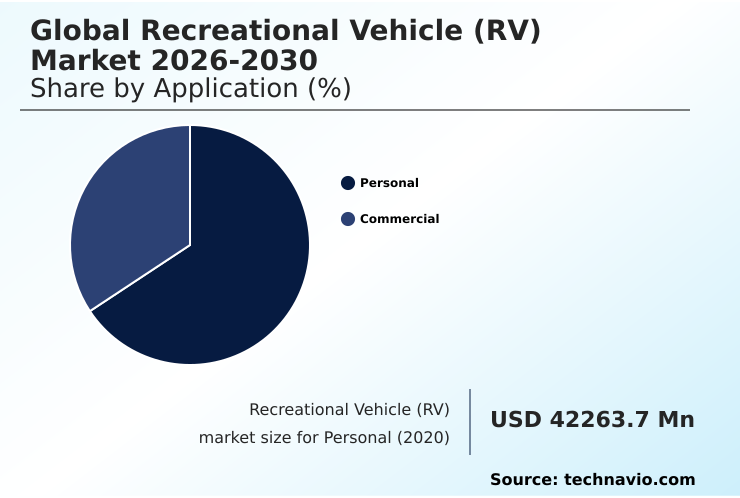
The Personal segment was valued at USD 52.88 billion in 2024 and showed a gradual increase during the forecast period.
Regional Analysis
Europe is estimated to contribute 37.3% to the growth of the global market during the forecast period.Technavio’s analysts have elaborately explained the regional trends and drivers that shape the market during the forecast period.
See How Recreational Vehicle (RV) Market Demand is Rising in Europe Get Free Sample
The geographic landscape is characterized by distinct regional preferences and growth trajectories. Europe is a significant contributor, accounting for over 37% of the market's incremental growth, driven by demand for compact, efficient vehicles.
In North America, the market is over five times larger than in Germany, reflecting a culture of long-distance travel and larger vehicle adoption.
Here, the focus is on off-grid capabilities for overlanding, necessitating advanced energy management and solar power integration in vehicles like the class c motorhome.
Strategic alliances are crucial for supply chain optimization, especially for integrating complex automotive systems and residential components.
The rise of peer-to-peer rental platforms is expanding market access globally, while vertical integration helps manufacturers control the quality of lightweight construction materials and propane-based energy systems, catering to a diverse global consumer base.
Market Dynamics
Our researchers analyzed the data with 2025 as the base year, along with the key drivers, trends, and challenges. A holistic analysis of drivers will help companies refine their marketing strategies to gain a competitive advantage.
- The global recreational vehicle (RV) market is shaped by a complex interplay of economic and lifestyle factors. A primary consideration for potential buyers is the impact of fuel prices on RV ownership, which directly influences the debate over comparing gasoline versus diesel RV fuel efficiency.
- This financial consideration extends to the total lifecycle cost, including the maintenance costs of class a versus class c motorhomes. For families, the decision often revolves around towable RVs versus motorized RVs for families, weighing convenience against initial investment.
- A growing trend influencing purchase decisions is the demand for luxury customized RV interiors, which is met with customization options for modern fifth wheel trailers. Technologically, the future of hybrid and electric class b motorhomes is a key development area, though it faces challenges of electric RV adoption infrastructure.
- The role of IoT in smart RV system management is expanding, alongside the adoption of advanced safety features in travel trailers, which answers the question of how advanced technology drives RV market growth. The importance of lightweight materials in towable RVs cannot be overstated for efficiency.
- Operationally, the industry faces a skilled technician shortage in the RV service industry and the impact of safety recalls on RV brand reputation. Supply chain collaboration in RV component manufacturing and robust RV campground infrastructure development for tourism are vital for stability.
- Exploring the market dynamics of commercial use RV fleets and the growth of peer-to-peer RV rental platforms reveals new revenue streams, while generational trends in RV consumer buying behavior indicate sustained long-term interest.
- In this evolving landscape, manufacturers focusing on the benefits of solar power integration in motorhomes are better positioned for success, with certain specialized segments achieving shipment growth nearly 14% higher than conventional counterparts, a critical metric for operational planning.
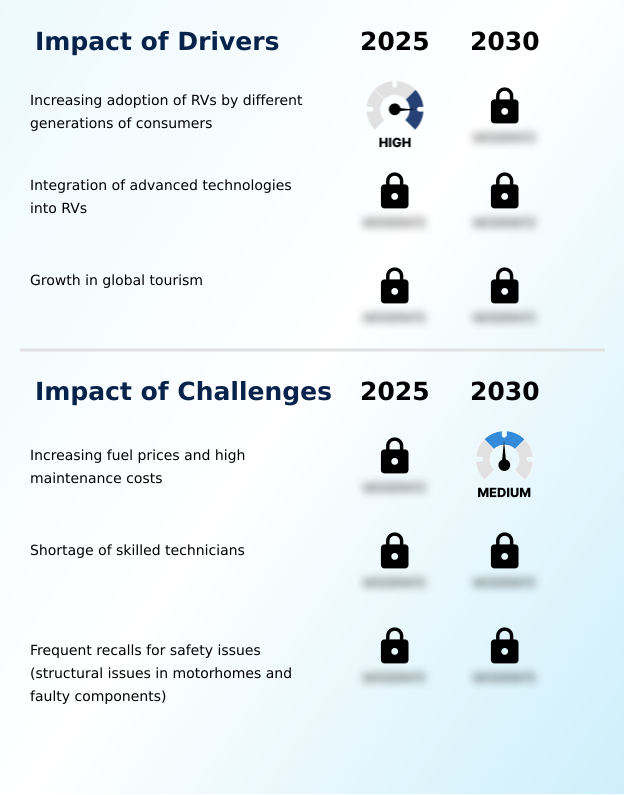
What are the key market drivers leading to the rise in the adoption of Recreational Vehicle (RV) Industry?
- The increasing adoption of recreational vehicles across different consumer generations serves as a key driver for market growth.
- Market growth is significantly influenced by the integration of technology aimed at enhancing the user experience for tech-savvy consumers.
- The adoption of smart RV systems, which provide a seamless mobile living environment, has boosted consumer satisfaction rates by over 20% in some surveys.
- These systems include integrated digital interfaces and app-based controls that improve operational efficiency for users on long-distance travel. The inclusion of advanced safety technologies, such as collision avoidance sensors, adaptive cruise control, and electronic stability systems, is also crucial.
- The rise of the nomadic workforce and the popularity of nature-based experiences have further expanded the market, with an estimated 72 million Americans planning trips annually, demonstrating the broad appeal of this travel style.
What are the market trends shaping the Recreational Vehicle (RV) Industry?
- A significant trend shaping the market is the increasing consumer demand for luxury and customized recreational vehicles. This reflects a shift toward premium models with upscale amenities and personalized features.
- Key market trends are centered on sustainability and high-end personalization, transforming vehicles into premium RV models. The push for cleaner travel solutions is accelerating the development of electric RVs and hybrid RVs, with some hybrid electric motorhome designs reducing emissions by over 30% compared to conventional counterparts.
- These alternative powertrain technologies, often featuring a specialized electric chassis and a low-emissions range extender, cater to rising demand for eco-friendly travel. Concurrently, the market for luxury RVs and customized RVs is expanding, with buyers seeking upscale amenities and customizable interiors.
- These glamping suites can command prices 50% higher than standard models, reflecting a strong preference for comfort and unique design.
What challenges does the Recreational Vehicle (RV) Industry face during its growth?
- Persistent challenges affecting industry growth include increasing fuel prices and high maintenance costs associated with recreational vehicle ownership.
- The market faces significant operational and financial headwinds that temper growth prospects. Persistently high fuel expenditure remains a primary concern, as fluctuating costs for gasoline engines and diesel engines can increase trip expenses by up to 25% during peak seasons.
- Compounding this are high maintenance costs associated with complex onboard systems, including electrical networks, plumbing systems, and HVAC systems, which require a level of quality assurance that is difficult to maintain. A critical challenge is the industry-wide shortage of skilled technicians, which leads to service delays and impacts consumer confidence.
- Furthermore, frequent safety recalls related to faulty components or structural issues with features like slide-out mechanisms disrupt operations and necessitate robust workforce development and supply chain optimization strategies.
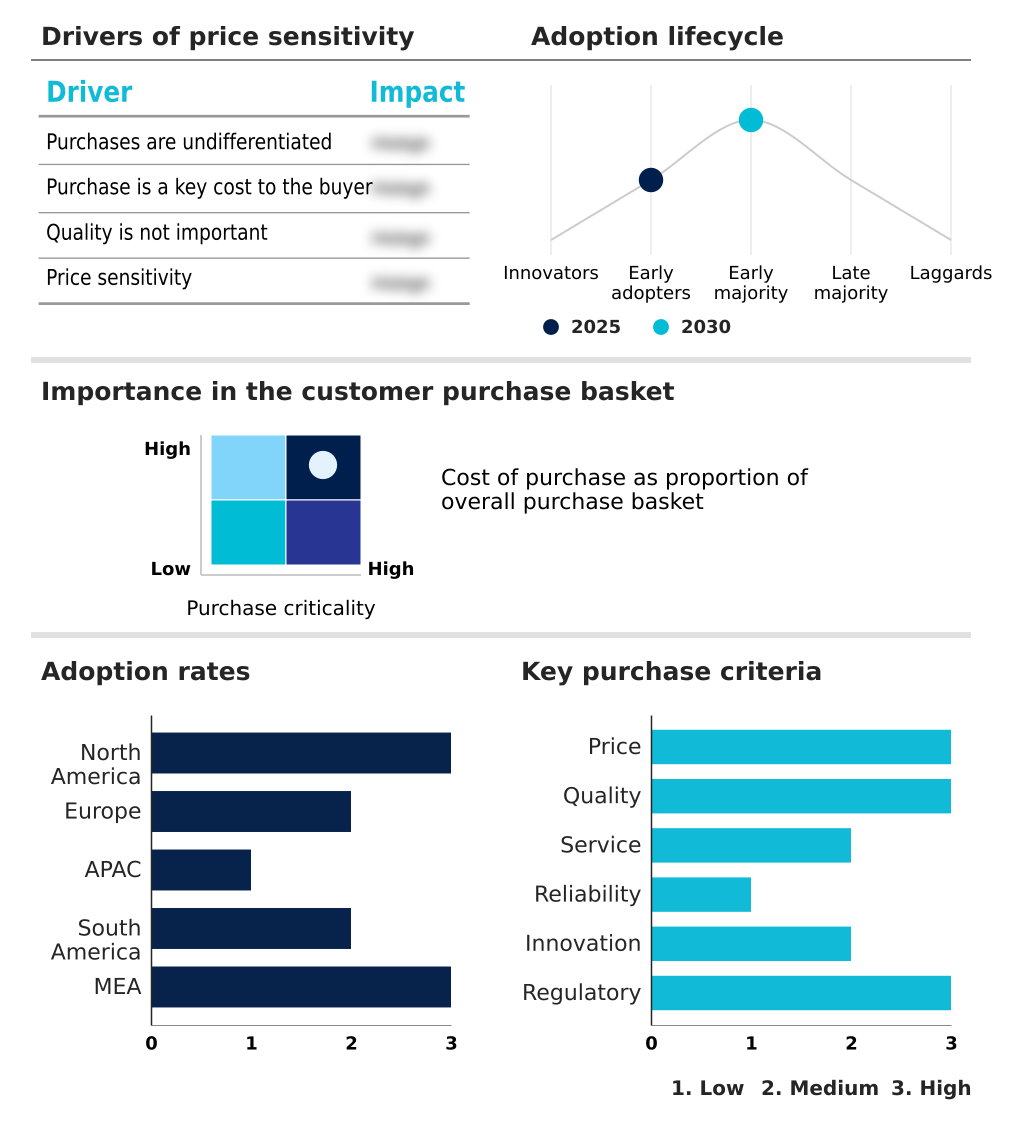
Exclusive Technavio Analysis on Customer Landscape
The recreational vehicle (rv) market forecasting report includes the adoption lifecycle of the market, covering from the innovator’s stage to the laggard’s stage. It focuses on adoption rates in different regions based on penetration. Furthermore, the recreational vehicle (rv) market report also includes key purchase criteria and drivers of price sensitivity to help companies evaluate and develop their market growth analysis strategies.
Customer Landscape of Recreational Vehicle (RV) Industry
Competitive Landscape
Companies are implementing various strategies, such as strategic alliances, recreational vehicle (rv) market forecast, partnerships, mergers and acquisitions, geographical expansion, and product/service launches, to enhance their presence in the industry.
Adria Mobil d.o.o - Key offerings include a diverse portfolio of motorized and towable recreational vehicles, from luxury touring coaches to versatile travel trailers.
The industry research and growth report includes detailed analyses of the competitive landscape of the market and information about key companies, including:
- Adria Mobil d.o.o
- Airstream Inc
- Coachmen RV
- Dethleffs GmbH and Co. KG
- Entegra Coach Inc.
- Forest River Inc.
- Grand Design RV
- Gulf Stream Coach Inc.
- Hobby Caravan
- Hymer GmbH and Co. KG
- Jayco Inc
- Knaus Tabbert AG
- Lance Camper Mfg. Corp
- REV Group Inc.
- The Trigano Group
- Thor Industries Inc.
- Tiffin Motorhomes Inc.
- Winnebago Industries Inc.
Qualitative and quantitative analysis of companies has been conducted to help clients understand the wider business environment as well as the strengths and weaknesses of key industry players. Data is qualitatively analyzed to categorize companies as pure play, category-focused, industry-focused, and diversified; it is quantitatively analyzed to categorize companies as dominant, leading, strong, tentative, and weak.
Recent Development and News in Recreational vehicle (rv) market
- In January 2025, a prominent manufacturer showcased a lineup of over 165 new recreational vehicle models, emphasizing new technology, customer-focused design improvements, and enhanced travel comfort.
- In March 2025, Campers Inn RV engaged in a strategic partnership and expanded its retail footprint through acquisitions, including an agreement to transfer three store locations to General RV Center.
- In March 2025, the National Highway Traffic Safety Administration (NHTSA) issued a recall notice for certain motorhome models due to safety risks involving slide-out rooms extending unexpectedly during travel.
- In May 2025, the RV Industry Association welcomed several new manufacturers, aftermarket suppliers, and service providers into its membership, expanding the industry's collaborative network.
Dive into Technavio’s robust research methodology, blending expert interviews, extensive data synthesis, and validated models for unparalleled Recreational Vehicle (RV) Market insights. See full methodology.
| Market Scope | |
|---|---|
| Page number | 291 |
| Base year | 2025 |
| Historic period | 2020-2024 |
| Forecast period | 2026-2030 |
| Growth momentum & CAGR | Accelerate at a CAGR of 8.3% |
| Market growth 2026-2030 | USD 42960.7 million |
| Market structure | Fragmented |
| YoY growth 2025-2026(%) | 7.9% |
| Key countries | US, Canada, Mexico, Germany, France, UK, Italy, Spain, Sweden, China, Japan, Australia, South Korea, India, Thailand, Brazil, Argentina, Chile, Saudi Arabia, UAE, South Africa, Turkey and Israel |
| Competitive landscape | Leading Companies, Market Positioning of Companies, Competitive Strategies, and Industry Risks |
Research Analyst Overview
- The recreational vehicle (RV) market is defined by a rapid convergence of automotive systems and residential components, creating sophisticated mobile living spaces.
- This evolution is driven by demand for a wide array of vehicle types, including versatile towable RVs like travel trailers and fifth wheel trailers, as well as a full spectrum of motorized RVs, from compact campervans and class b motorhomes to large class c and class a motorhomes.
- Key development areas include electric RVs and hybrid RVs, which feature advanced alternative powertrain technologies like the hybrid electric motorhome with a specialized electric chassis and a low-emissions range extender. The market for luxury RVs and customized RVs is expanding, incorporating premium materials and integrated digital interfaces.
- Technology is a critical differentiator, with smart RV systems enabling app-based controls and remote monitoring systems. Advanced safety technologies such as collision avoidance sensors, adaptive cruise control, and electronic stability systems are becoming standard. Onboard infrastructure, including plumbing systems, electrical networks, and HVAC systems, is increasingly complex, especially with features like slide-out mechanisms.
- This complexity, however, can lead to structural issues and faulty components. To improve efficiency, manufacturers are using lightweight construction materials and advanced energy management systems supported by solar power integration and IoT connectivity. While traditional gasoline engines and diesel engines remain prevalent, propane-based energy systems offer an alternative for certain functions.
- In certain segments, these innovations have contributed to shipment increases of nearly 14%, a key performance indicator guiding product strategy.
What are the Key Data Covered in this Recreational Vehicle (RV) Market Research and Growth Report?
-
What is the expected growth of the Recreational Vehicle (RV) Market between 2026 and 2030?
-
USD 42.96 billion, at a CAGR of 8.3%
-
-
What segmentation does the market report cover?
-
The report is segmented by Application (Personal, and Commercial), Product (Towable RVs, and Motorized RVs), Fuel Type (Gasoline, Diesel, and Others) and Geography (North America, Europe, APAC, South America, Middle East and Africa)
-
-
Which regions are analyzed in the report?
-
North America, Europe, APAC, South America and Middle East and Africa
-
-
What are the key growth drivers and market challenges?
-
Increasing adoption of RVs by different generations of consumers, Increasing fuel prices and high maintenance costs
-
-
Who are the major players in the Recreational Vehicle (RV) Market?
-
Adria Mobil d.o.o, Airstream Inc, Coachmen RV, Dethleffs GmbH and Co. KG, Entegra Coach Inc., Forest River Inc., Grand Design RV, Gulf Stream Coach Inc., Hobby Caravan, Hymer GmbH and Co. KG, Jayco Inc, Knaus Tabbert AG, Lance Camper Mfg. Corp, REV Group Inc., The Trigano Group, Thor Industries Inc., Tiffin Motorhomes Inc. and Winnebago Industries Inc.
-
Market Research Insights
- Market dynamics are increasingly shaped by the preferences of a diverse consumer base seeking experiential travel and a self-directed mobile living environment. This has improved operational efficiency for rental fleet managers, with some peer-to-peer rental platforms reporting user engagement increases of over 25% for premium RV models.
- The focus on enhancing the user experience through customizable interiors and upscale amenities is evident, as manufacturers cater to a nomadic workforce and tech-savvy consumers. This drive for personalization supports sustained demand, with certain vehicle segments showing shipment growth of nearly 14% year-over-year.
- The push for cleaner travel solutions is also influencing product development, fostering strategic alliances that aim to deliver eco-friendly travel options for long-distance travel and nature-based experiences without compromising performance.
We can help! Our analysts can customize this recreational vehicle (rv) market research report to meet your requirements.
 RIA -
RIA - 
