
Regenerative Agriculture Market Size 2025-2029
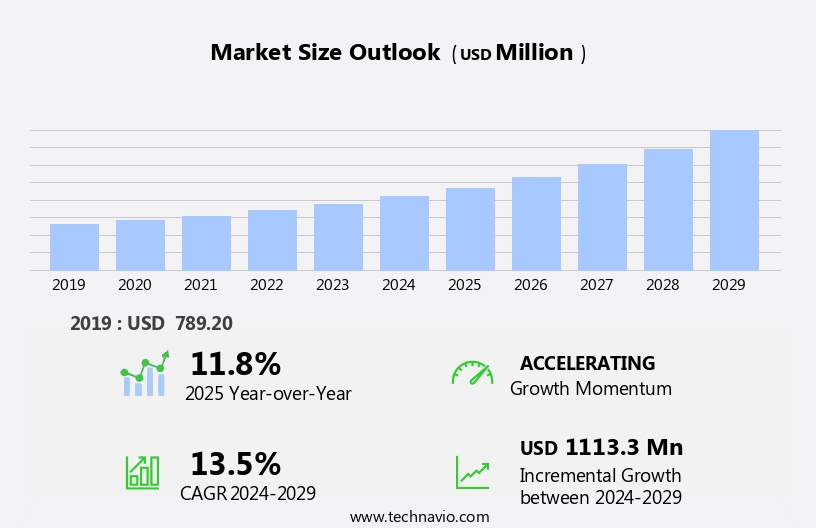
The regenerative agriculture market size is forecast to increase by USD 1.11 billion, at a CAGR of 13.5% between 2024 and 2029.
- The market is gaining momentum due to escalating environmental concerns, driven by the increasing recognition of the role agriculture plays in mitigating climate change and enhancing ecosystem health. This shift in awareness is further propelled by government initiatives and policies worldwide, promoting sustainable farming practices. However, the market faces challenges, primarily due to the limited understanding and education among farmers regarding the benefits and implementation of regenerative agriculture. This knowledge gap hampers the widespread adoption of these practices, despite their long-term potential to improve soil health, increase biodiversity, and reduce greenhouse gas emissions. To capitalize on the market opportunities and navigate these challenges effectively, companies must invest in educational programs and collaborate with farming communities to promote the adoption of regenerative agriculture.
- By addressing the knowledge gap and fostering a culture of sustainability, businesses can contribute to a more resilient agricultural sector and help mitigate the environmental challenges facing our planet.
What will be the Size of the Regenerative Agriculture Market during the forecast period?
Explore in-depth regional segment analysis with market size data - historical 2019-2023 and forecasts 2025-2029 - in the full report.
Request Free Sample
The market continues to evolve, driven by the growing demand for sustainable farming practices that prioritize soil health, circular economy principles, and climate change mitigation. Soil testing plays a crucial role in this dynamic landscape, providing farmers with valuable insights to optimize nutrient management and improve overall soil fertility. Market access is another critical factor, as farmers seek to connect with consumers and buyers who value the environmental and health benefits of regenerative agriculture. Circular economy principles are increasingly integrated into regenerative agriculture, with a focus on manure management, phosphorus cycling, and nutrient recycling. Rural development is also a significant consideration, as regenerative agriculture offers opportunities for economic viability and sustainable livelihoods in rural communities.
Sustainability reporting and environmental certification programs help to ensure transparency and accountability in the sector, while policy support from governments and organizations continues to shape the market's direction. Weed control, pest management, and pasture management are ongoing challenges that require innovative solutions, such as sustainable agriculture practices and the integration of livestock. Waste management and water conservation are essential components of regenerative agriculture, with farmers exploring new ways to reduce their environmental impact and improve efficiency. Climate change mitigation is a key driver of market activity, as farmers seek to adopt practices that sequester carbon and reduce greenhouse gas emissions.
Data analytics, precision agriculture, and renewable energy are emerging technologies that offer significant potential for improving the economic viability and sustainability of regenerative agriculture. Farm management software, GPS technology, variable rate technology, and yield monitoring are just a few of the tools that farmers are using to optimize their operations and reduce their environmental footprint. In this continuously evolving market, the focus on sustainability, circular economy principles, and climate change mitigation is driving innovation and growth across various sectors. From soil health to food security, the potential benefits of regenerative agriculture are vast and far-reaching.
How is this Regenerative Agriculture Industry segmented?
The regenerative agriculture industry research report provides comprehensive data (region-wise segment analysis), with forecasts and estimates in "USD million" for the period 2025-2029, as well as historical data from 2019-2023 for the following segments.
- Benefit
- Carbon sequestration
- Nutrient cycling
- Biodiversity
- Method
- Aquaculture
- Agroecology
- Agroforestry
- Silvopasture
- Others
- Type
- Livestock farming
- Agroforestry-based farming
- Arable crop farming
- Mixed farming
- Geography
- North America
- US
- Canada
- Europe
- France
- Germany
- Italy
- UK
- Middle East and Africa
- UAE
- APAC
- China
- India
- Japan
- South Korea
- South America
- Brazil
- Rest of World (ROW)
- North America
By Benefit Insights
The carbon sequestration segment is estimated to witness significant growth during the forecast period.
Regenerative agriculture, an environmentally sustainable approach to farming, focuses on enhancing ecosystem services, including carbon sequestration and biodiversity conservation. Carbon sequestration is achieved through practices such as cover cropping, crop rotation, and reduced tillage, which increase soil organic carbon content and reduce greenhouse gas emissions. Agroecology, an essential component of regenerative agriculture, incorporates ecological principles to optimize agricultural operations and promote natural resource management. This approach not only benefits the environment by improving soil health, water retention, and wildlife habitats but also supports local communities and food security. Digital tools and advisory services facilitate the implementation of regenerative farming methods and enable food producers to optimize their operations and comply with organic certification requirements.
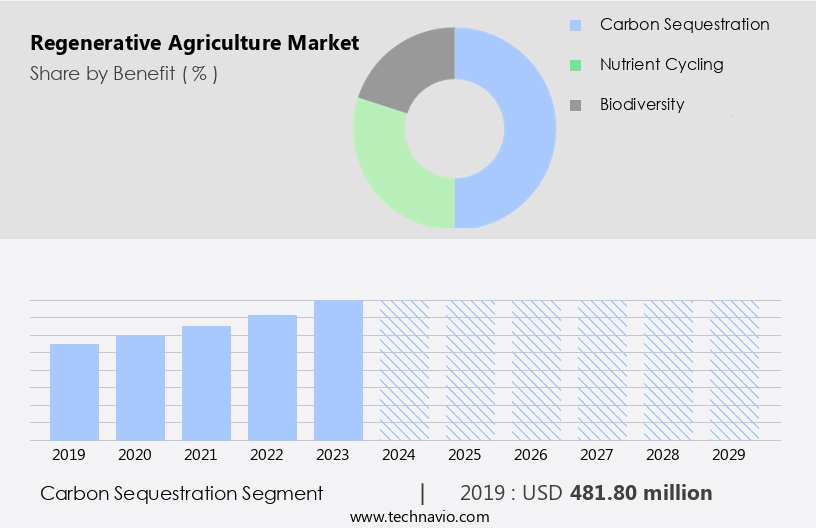
The Carbon sequestration segment was valued at USD 481.80 billion in 2019 and showed a gradual increase during the forecast period.
Regional Analysis
North America is estimated to contribute 38% to the growth of the global market during the forecast period. Technavio's analysts have elaborately explained the regional trends and drivers that shape the market during the forecast period.
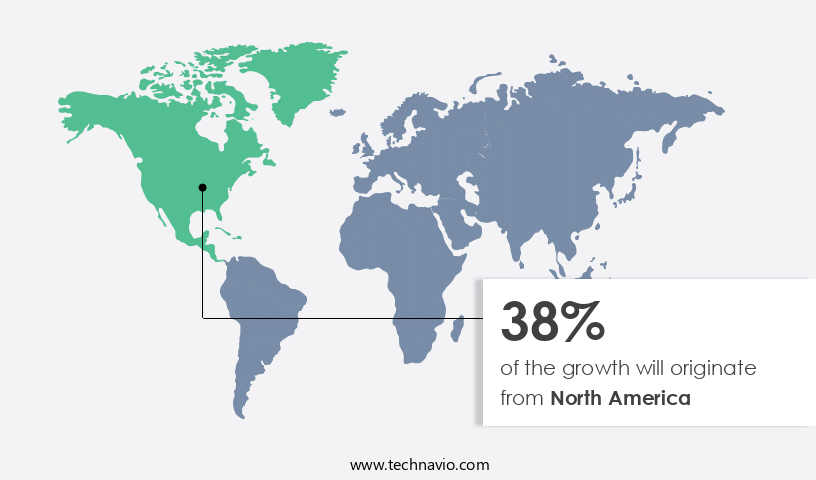
Regenerative agriculture is experiencing significant growth in North America, driven by a commitment to enhancing soil health and minimizing environmental impact. Cover cropping and crop rotation are among the popular regenerative practices gaining traction in the region. These methods, which also include reduced tillage and holistic grazing, contribute to carbon emission reduction and climate change mitigation. The circular economy and sustainable agriculture are key focus areas for North America, as evidenced by initiatives like General Mills' regenerative agriculture program and Regeneration Canada. Water conservation, mycorrhizal fungi, nitrogen fixation, and phosphorus cycling are integral to regenerative agriculture, as they promote soil fertility and nutrient cycling.
Climate-smart agriculture, irrigation scheduling, and precision agriculture further optimize resource usage and improve yield. Livestock integration, manure management, and pasture management contribute to a more sustainable and efficient farming system. Certification programs, such as environmental certification, ensure food safety and adherence to sustainable practices. Farm management software, data analytics, and GPS technology facilitate the efficient implementation of regenerative practices. Policy support and rural development are essential for the continued growth of regenerative agriculture in North America. The market is evolving, with a strong emphasis on soil health, nutrient management, and carbon sequestration. Weed control, pest management, and waste management are addressed through regenerative practices, contributing to a more sustainable and circular agricultural system.
Renewable energy, yield monitoring, and remote sensing technologies further enhance the efficiency and sustainability of regenerative agriculture. Regenerative agriculture's economic viability is increasingly recognized, as it offers long-term benefits for farmers and the environment. The supply chain is adapting to accommodate the growing demand for regeneratively produced goods, ensuring market access for farmers. The integration of regenerative practices into conventional agriculture is a significant trend, as farmers and agricultural professionals seek to improve sustainability and reduce their environmental footprint.
Market Dynamics
Our researchers analyzed the data with 2024 as the base year, along with the key drivers, trends, and challenges. A holistic analysis of drivers will help companies refine their marketing strategies to gain a competitive advantage.
In the evolving agricultural landscape, the market is gaining significant traction as farmers and entrepreneurs embrace sustainable farming practices. Regenerative agriculture focuses on rebuilding soil health, enhancing biodiversity, and sequestering carbon. Key practices include no-till farming, cover cropping, and rotational grazing. These methods not only improve soil quality but also increase resilience to climate extremes and reduce reliance on synthetic fertilizers and pesticides. Regenerative agriculture also supports local food systems, contributing to community health and economic development. Consumers are increasingly demanding transparency and ethical production, creating a lucrative niche for regenerative agriculture products. The market is expected to grow, driven by government incentives, private investments, and consumer preferences. Regenerative agriculture's potential to address climate change, promote food security, and improve rural livelihoods makes it a promising sector for innovation and investment.
What are the key market drivers leading to the rise in the adoption of Regenerative Agriculture Industry?
- The escalating importance of addressing environmental concerns serves as the primary catalyst for market growth.
- The market is experiencing significant growth due to increasing awareness of food safety and environmental sustainability. Traditional farming methods, such as monoculture and heavy use of synthetic fertilizers and pesticides, have negative impacts on the environment, including soil degradation and increased greenhouse gas emissions. In contrast, regenerative agriculture focuses on improving soil health through practices like no-till farming, cover crops, and pasture management. This approach enhances nutrient cycling, potassium availability, and microbial communities, reducing the need for synthetic inputs. Grazing systems, pest management, and environmental impact assessments are also essential components of regenerative agriculture.
- With the growing demand for sustainable food production, farmer training and education are becoming increasingly important to implement these practices effectively. Regenerative agriculture not only benefits the environment but also improves farm management software, enhancing overall efficiency and profitability.
What are the market trends shaping the Regenerative Agriculture Industry?
- One noteworthy market trend involves the escalating implementation of government initiatives and policies. This trend signifies a significant focus on regulatory support and incentives to drive industry growth.
- The market is experiencing significant growth due to increasing government initiatives aimed at promoting sustainable farming practices. Governments worldwide are providing incentives, subsidies, and regulatory frameworks to encourage farmers to adopt regenerative agriculture principles. For instance, the European Union's (EU) Farm to Fork Strategy focuses on reducing the use of harmful chemicals, promoting organic farming, and supporting agroecology. Regenerative agriculture emphasizes soil health, biodiversity, and resilience. Soil testing is a crucial aspect of this approach, as it helps farmers understand the nutrient needs of their land and optimize nutrient management. Manure management and waste management are also essential components of regenerative agriculture, as they contribute to nutrient cycling and reduce the need for synthetic fertilizers.
- Moreover, the circular economy is gaining momentum in agriculture, with a focus on reducing waste and maximizing resource efficiency. Environmental certification and sustainability reporting are becoming increasingly important for farmers seeking to access new markets and meet consumer demand for sustainable produce. Weed control and nutrient management are critical aspects of regenerative agriculture, and farmers are exploring innovative solutions to minimize the use of herbicides and other harmful chemicals. Policy support is essential for the growth of the market, as it provides farmers with the resources and incentives they need to transition to more sustainable practices. As governments continue to prioritize sustainability and rural development, the market is poised for continued growth.
What challenges does the Regenerative Agriculture Industry face during its growth?
- The lack of sufficient awareness and education among farmers represents a significant challenge impeding the growth of the agricultural industry.
- Regenerative agriculture, an approach that addresses climate change mitigation through practices like carbon sequestration, organic farming, and precision agriculture, is gaining traction due to its potential to enhance food security and promote sustainable farming. However, the market's growth is hampered by farmers' and consumers' limited understanding of these innovative methods. Traditional farming practices, deeply ingrained over decades, hinder the adoption of regenerative agriculture in some areas, particularly among low-income farmers. Data analytics, GPS technology, variable rate technology, renewable energy, yield monitoring, remote sensing, and water recycling are essential tools in regenerative agriculture. These technologies enhance farming efficiency, reduce environmental impact, and improve overall sustainability.
- Despite their benefits, the lack of awareness and education channels limits their adoption. Agricultural extension services are crucial in disseminating knowledge, but their availability and accessibility are often limited in certain regions. To overcome this challenge, innovative solutions like digital education platforms and collaborative farming initiatives can be employed. These approaches can provide farmers with the necessary knowledge and resources to transition to regenerative agriculture. By leveraging technology and collaboration, we can create a harmonious and immersive environment that emphasizes the importance of regenerative agriculture in mitigating climate change and ensuring long-term food security.
Exclusive Customer Landscape
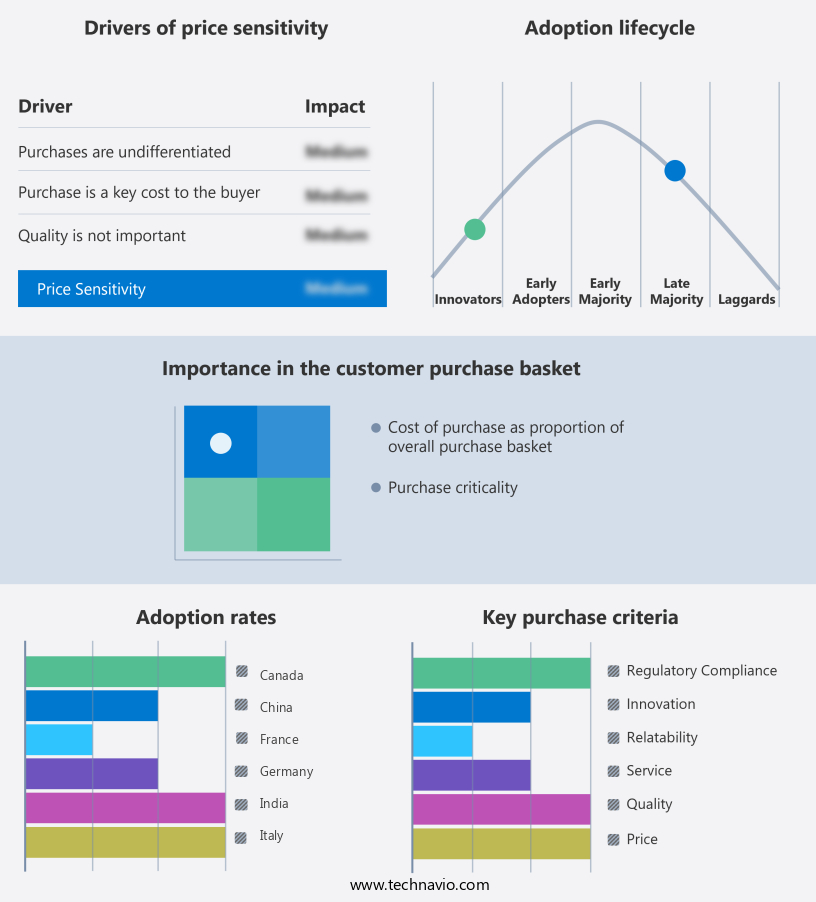
The regenerative agriculture market forecasting report includes the adoption lifecycle of the market, covering from the innovator's stage to the laggard's stage. It focuses on adoption rates in different regions based on penetration. Furthermore, the regenerative agriculture market report also includes key purchase criteria and drivers of price sensitivity to help companies evaluate and develop their market growth analysis strategies.
Customer Landscape
Key Companies & Market Insights
Companies are implementing various strategies, such as strategic alliances, regenerative agriculture market forecast, partnerships, mergers and acquisitions, geographical expansion, and product/service launches, to enhance their presence in the industry.
Agreena ApS - Through a community-driven approach, this company specializes in regenerative agriculture, encompassing every stage from seed to sale of grain products.
The industry research and growth report includes detailed analyses of the competitive landscape of the market and information about key companies, including:
- Agreena ApS
- Amiha
- Bluebird Grain Farms
- Cargill Inc.
- CIBO Technologies Inc.
- Continuum Ag
- Danone SA
- General Mills Inc.
- Grounded
- Indigo Ag Inc.
- My Serenity Kids
- Nestle SA
- reNature
- Roots of Nature
- Soil Capital
- Unilever PLC
- White Oak Pastures
Qualitative and quantitative analysis of companies has been conducted to help clients understand the wider business environment as well as the strengths and weaknesses of key industry players. Data is qualitatively analyzed to categorize companies as pure play, category-focused, industry-focused, and diversified; it is quantitatively analyzed to categorize companies as dominant, leading, strong, tentative, and weak.
Recent Development and News in Regenerative Agriculture Market
- In January 2024, Danish seed company Danisco announced the launch of their new line of regenerative agriculture seeds, focusing on improving soil health and reducing carbon emissions. These seeds, which incorporate advanced genetic traits, were developed in collaboration with leading research institutions (Danisco press release, 2024).
- In March 2024, AgroTech Corporation, a leading agricultural technology provider, and RegenTech, a regenerative agriculture solutions company, formed a strategic partnership. This collaboration aimed to integrate RegenTech's regenerative agriculture expertise with AgroTech's technology platform, offering farmers more sustainable and efficient farming solutions (AgroTech Corporation press release, 2024).
- In May 2024, the European Union approved the Regenerative Agriculture Action Plan, committing â¬10 billion to support farmers in adopting regenerative agriculture practices by 2027. This initiative aims to reduce greenhouse gas emissions, improve soil health, and promote biodiversity (European Commission press release, 2024).
- In April 2025, TerraGenesis, a regenerative agriculture technology company, secured a USD50 million Series C funding round, led by S2G Ventures. This investment will be used to expand their technology offerings and scale their operations, aiming to reach 10 million acres of regenerative farmland by 2028 (TerraGenesis press release, 2025).
Research Analyst Overview
- The market is experiencing significant activity and trends as consumer education and knowledge transfer drive the demand for sustainable farming practices. Regenerative grazing, a key component of this approach, enhances wildlife habitat and improves resource use efficiency and labor productivity. Investment opportunities abound as farmers adopt adaptive management strategies to increase land use efficiency and provide ecosystem services, such as carbon footprint reduction and water quality improvement. Brand positioning and marketing strategies are crucial for farmers to differentiate themselves in the global food systems market. Financial incentives, including sustainable development goals and policy instruments, offer support for farmers to reduce input costs and improve air quality.
- International cooperation and technology adoption are essential for advancing regenerative agriculture practices, while extension services and soil erosion control ensure long-term success. The market's focus on biodiversity enhancement and pollinator habitat improvement aligns with public awareness of the importance of sustainable agriculture for a healthier planet.
Dive into Technavio's robust research methodology, blending expert interviews, extensive data synthesis, and validated models for unparalleled Regenerative Agriculture Market insights. See full methodology.
|
Market Scope |
|
|
Report Coverage |
Details |
|
Page number |
213 |
|
Base year |
2024 |
|
Historic period |
2019-2023 |
|
Forecast period |
2025-2029 |
|
Growth momentum & CAGR |
Accelerate at a CAGR of 13.5% |
|
Market growth 2025-2029 |
USD 1113.3 million |
|
Market structure |
Fragmented |
|
YoY growth 2024-2025(%) |
11.8 |
|
Key countries |
US, China, Germany, UK, Canada, France, Italy, Japan, India, South Korea, Brazil, and UAE |
|
Competitive landscape |
Leading Companies, Market Positioning of Companies, Competitive Strategies, and Industry Risks |
What are the Key Data Covered in this Regenerative Agriculture Market Research and Growth Report?
- CAGR of the Regenerative Agriculture industry during the forecast period
- Detailed information on factors that will drive the growth and forecasting between 2025 and 2029
- Precise estimation of the size of the market and its contribution of the industry in focus to the parent market
- Accurate predictions about upcoming growth and trends and changes in consumer behaviour
- Growth of the market across North America, Europe, APAC, South America, and Middle East and Africa
- Thorough analysis of the market's competitive landscape and detailed information about companies
- Comprehensive analysis of factors that will challenge the regenerative agriculture market growth of industry companies
We can help! Our analysts can customize this regenerative agriculture market research report to meet your requirements.
 RIA -
RIA - 
