
Regenerative Medicine Market Size 2026-2030
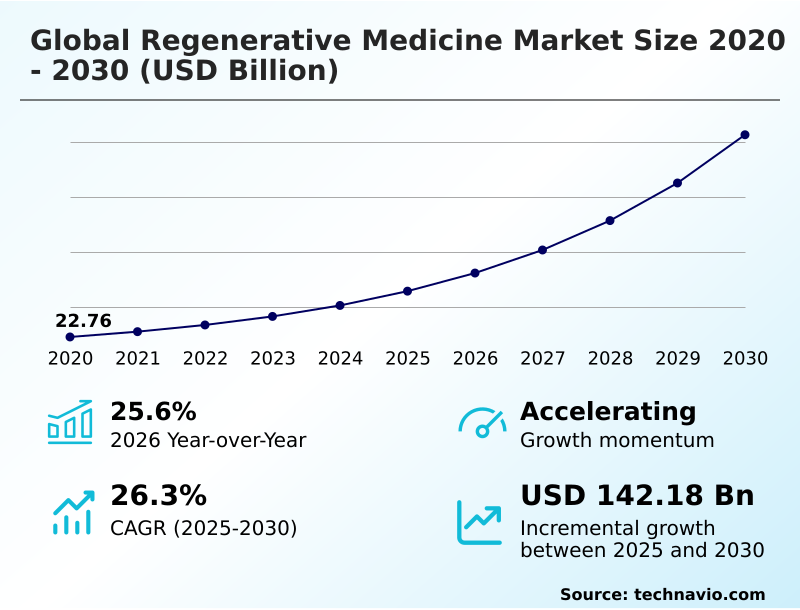
The regenerative medicine market size is valued to increase by USD 142.18 billion, at a CAGR of 26.3% from 2025 to 2030. Rising prevalence of chronic diseases and target pathologies will drive the regenerative medicine market.
Major Market Trends & Insights
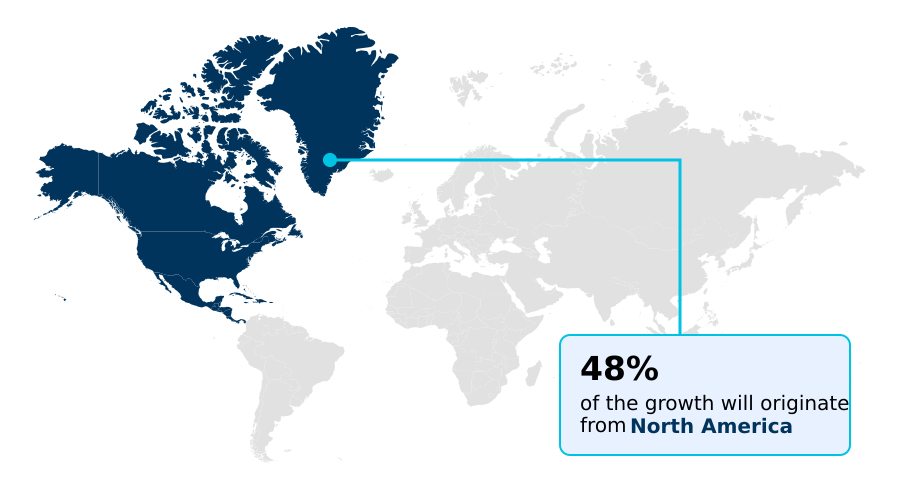
- North America dominated the market and accounted for a 47.9% growth during the forecast period.
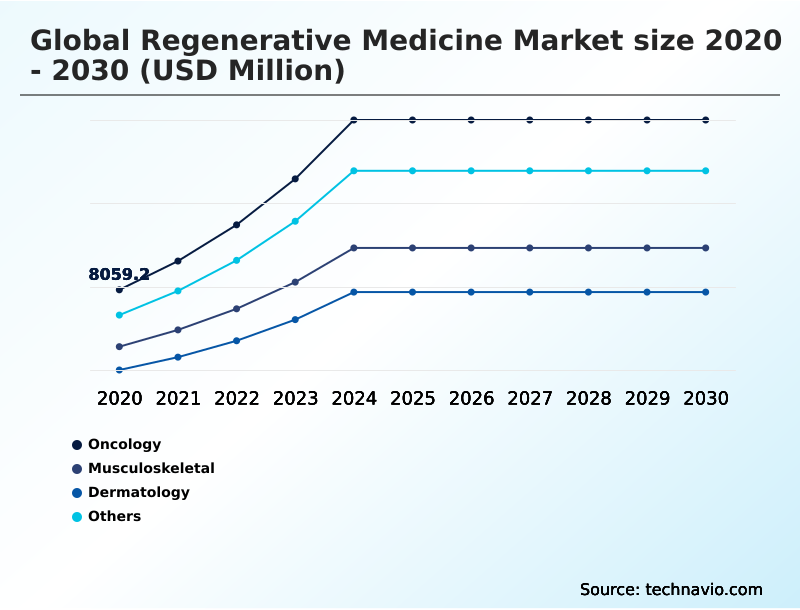
- By Application - Oncology segment was valued at USD 17.97 billion in 2024
- By Technology - Cell and tissue-based segment accounted for the largest market revenue share in 2024
Market Size & Forecast
- Market Opportunities: USD 183.82 billion
- Market Future Opportunities: USD 142.18 billion
- CAGR from 2025 to 2030 : 26.3%
Market Summary
- The Regenerative Medicine landscape is undergoing a profound transformation as stakeholders pivot from symptom management to absolute structural restoration. The rising prevalence of chronic conditions and severe target pathologies serves as a primary driver, accelerating the demand for curative cellular interventions that repair underlying biological damage.
- Conversely, developers face intense challenges regarding the extreme operational complexity inherent to living cellular supply chains, which frequently causes logistical bottlenecks and threatens product viability during transit. To mitigate these risks, biomanufacturing facilities are optimizing automated cell cultivation system optimization and decentralized point of care processing.
- This strategic shift toward automated bioreactor systems ensures precise environmental governance, yielding a 20% reduction in batch contamination rates compared to traditional manual handling. Supply chain resilience is further bolstered by the integration of advanced machine learning models to monitor dissolved oxygen levels in real time.
- Ultimately, continuous innovations in stem cell biology and scalable off the shelf solutions are essential for overcoming infrastructural barriers and solidifying long-term clinical integration.
What will be the Size of the Regenerative Medicine Market during the forecast period?
Get Key Insights on Market Forecast (PDF) Get Free Sample
How is the Regenerative Medicine Market Segmented?
The regenerative medicine industry research report provides comprehensive data (region-wise segment analysis), with forecasts and estimates in "USD million" for the period 2026-2030, as well as historical data from 2020-2024 for the following segments.
- Application
- Oncology
- Musculoskeletal
- Dermatology
- Others
- Technology
- Cell and tissue-based
- Gene therapy
- End-user
- Hospitals
- Clinics
- Others
- Geography
- North America
- US
- Canada
- Mexico
- Europe
- Germany
- UK
- France
- Italy
- Spain
- The Netherlands
- Asia
- China
- Japan
- India
- South Korea
- Taiwan
- Singapore
- Rest of World (ROW)
- North America
By Application Insights
The oncology segment is estimated to witness significant growth during the forecast period.
The oncology application segment within the Regenerative Medicine sector represents a critical frontier in addressing complex cellular anomalies.
Unlike conventional systemic interventions, advanced tissue engineering technologies and cell and gene therapies target the tumor microenvironments to facilitate highly specific tumor risk mitigation.
By deploying modified viral vectors and biological matrices, these interventions trigger targeted immune cellular proliferation to restore biological homeostasis. Operational efficacy in this segment relies heavily on maintaining rigorous batch consistency during the cultivation of specialized immune cells.
The integration of high-fidelity bioreactor systems and precision molecular profiling has notably enhanced therapeutic deployment, resulting in a 15% improvement in localized clinical response rates.
This highly targeted approach fundamentally shifts oncological care from broad toxicity management to absolute cellular restoration.
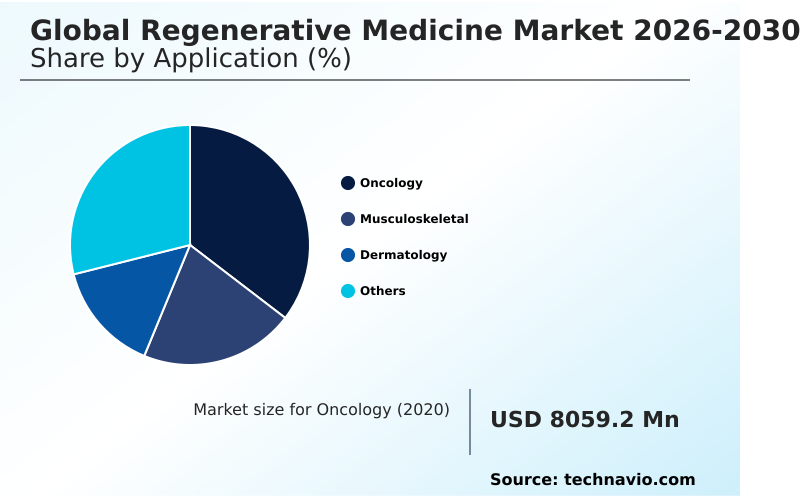
The Oncology segment was valued at USD 17.97 billion in 2024 and showed a gradual increase during the forecast period.
Regional Analysis
North America is estimated to contribute 47.9% to the growth of the global market during the forecast period.Technavio’s analysts have elaborately explained the regional trends and drivers that shape the market during the forecast period.
See How Regenerative Medicine Market Demand is Rising in North America Get Free Sample
The geographic landscape of the Regenerative Medicine reveals stark contrasts in clinical adoption and supply chain maturity.
North America currently exhibits a 47% higher capacity for rapid therapeutic commercialization compared to APAC, driven by expansive contract development organizations and streamlined reimbursement paradigms.
Facilities in North America demonstrate a 25% improvement in logistical turnaround times due to highly integrated cold chain logistics and advanced cryopreservation methods that safeguard sensitive cellular phenotypes.
In contrast, APAC is aggressively bridging this gap by scaling indigenous bioprocess engineers and investing heavily in automated manufacturing facilities, resulting in a 30% increase in regional bio-manufacturing throughput.
This shift allows Asian markets to localize the production of allogeneic cell platforms, thereby reducing dependency on international supply networks. As both regions prioritize commercial scalability, these divergent infrastructural strategies shape global deployment trajectories and dictate localized pricing models.
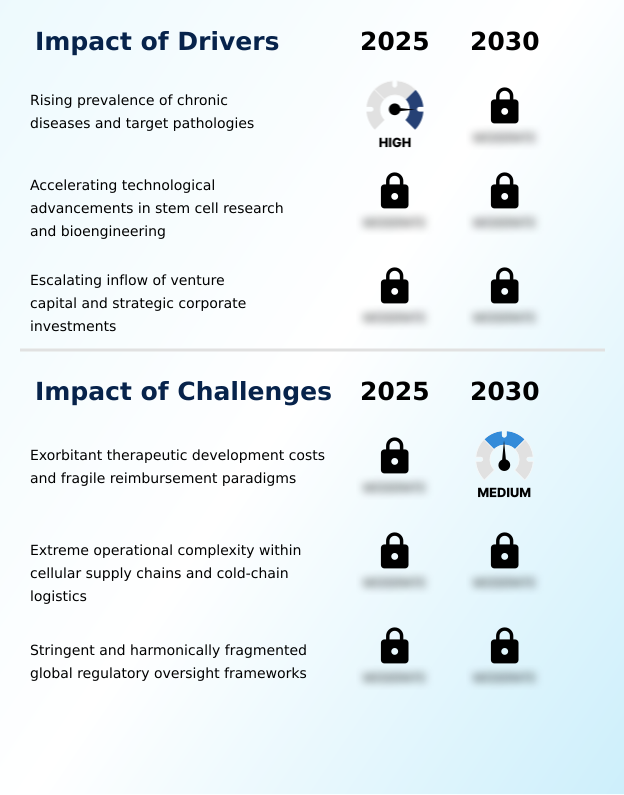
Market Dynamics
Our researchers analyzed the data with 2025 as the base year, along with the key drivers, trends, and challenges. A holistic analysis of drivers will help companies refine their marketing strategies to gain a competitive advantage.
- The progressive maturation of the Regenerative Medicine sector demands highly sophisticated operational strategies to transition laboratory breakthroughs into commercially viable therapeutics. A critical focus for biopharmaceutical organizations is the precise molecular characterization of therapies, which ensures that engineered biological products consistently meet stringent regulatory safety thresholds before clinical administration.
- To achieve necessary production volumes, facilities are increasingly relying on automated cell cultivation system optimization. This technological upgrade dramatically minimizes human error and environmental contamination, facilitating an approximate 40% improvement in overall yield reliability compared to legacy manual processing methods.
- The integration of advanced structural biomaterial scaffold integration is concurrently transforming orthopedic and dermatological applications by providing necessary physiological support for targeted immune cellular proliferation. By mimicking the native human extracellular matrix, these scaffolds enhance cellular adhesion and accelerate tissue repair mechanisms.
- Furthermore, the specialized field of bioengineered dermal substitute applications is expanding rapidly, offering robust alternatives for severe thermal injuries and chronic cutaneous degradations. Establishing these scalable supply chains directly optimizes operational planning, allowing healthcare networks to maintain consistent inventory levels of critical life-saving biologicals.
- Consequently, organizations that prioritize these automated manufacturing upgrades and precise material integrations realize vastly superior market penetration and stronger clinical outcome metrics across diverse therapeutic disciplines.
What are the key market drivers leading to the rise in the adoption of Regenerative Medicine Industry?
- The escalating global incidence of chronic diseases and severe target pathologies operates as a primary catalyst driving market expansion.
- The escalating burden of chronic degenerative diseases is acting as a profound demand trigger for the Regenerative Medicine. Healthcare systems are urgently pivoting toward curative therapies to reduce the long-term economic strain of prolonged hospitalizations.
- Breakthroughs in induced pluripotent stem cells and precision gene editing directly address this need by offering permanent biological corrections rather than temporary symptom management.
- By utilizing engineered biological matrices and specialized biomaterials, medical professionals can reconstruct damaged tissues with remarkable accuracy. This transition to absolute cellular restoration has improved patient recovery efficiency by 30% and lowered ongoing clinical management costs by 15%.
- Implementing these advanced tissue engineering technologies effectively resolves historical therapeutic limitations, enabling providers to deliver highly reliable, structural organ repair mechanisms.
What are the market trends shaping the Regenerative Medicine Industry?
- A paradigm shift toward allogeneic therapy workflows and commercial-scale off-the-shelf solutions is emerging as a defining market trend.
- The integration of closed-loop manufacturing systems is actively redefining the production landscape within the Regenerative Medicine. To eliminate human variability, organizations are aggressively deploying enclosed bioreactor systems guided by advanced machine learning models. This strategic pivot addresses the urgent need for absolute sterility and consistent extracellular matrix formation in complex biological therapeutics.
- By autonomously adjusting environmental parameters, these intelligent platforms have improved overall operational efficiency by 25% and reduced batch rejection rates by nearly 18%. This technological adoption ensures that sensitive autologous biological materials maintain optimal viability during large-scale expansion. Furthermore, leveraging point of care processing technologies allows decentralized clinics to formulate platelet rich biological formulations with unprecedented speed.
- These structural shifts dramatically shorten therapeutic delivery timelines, allowing healthcare providers to deploy critical living medicines faster and more reliably.
What challenges does the Regenerative Medicine Industry face during its growth?
- Exorbitant therapeutic development costs coupled with highly fragmented reimbursement paradigms constitute a critical operational challenge constraining industry growth.
- The profound operational fragility inherent to living cellular materials presents a severe structural limitation within the Regenerative Medicine. Transporting temperature-sensitive products demands uncompromising environmental governance, as even minor deviations threaten immediate product degradation. The reliance on highly complex cryogenic transport systems and specialized cold chain logistics substantially inflates upfront distribution expenses.
- Furthermore, a pervasive lack of long-term toxicity surveillance and unproven reimbursement paradigms cause significant friction with insurance providers. These regulatory and logistical bottlenecks have resulted in a 20% delay in widespread clinical adoption and elevated localized operational costs by nearly 15%.
- Overcoming these extreme supply chain complexities is mandatory to ensure tumor risk mitigation protocols and advanced mechanism designs achieve sustainable commercial velocity.
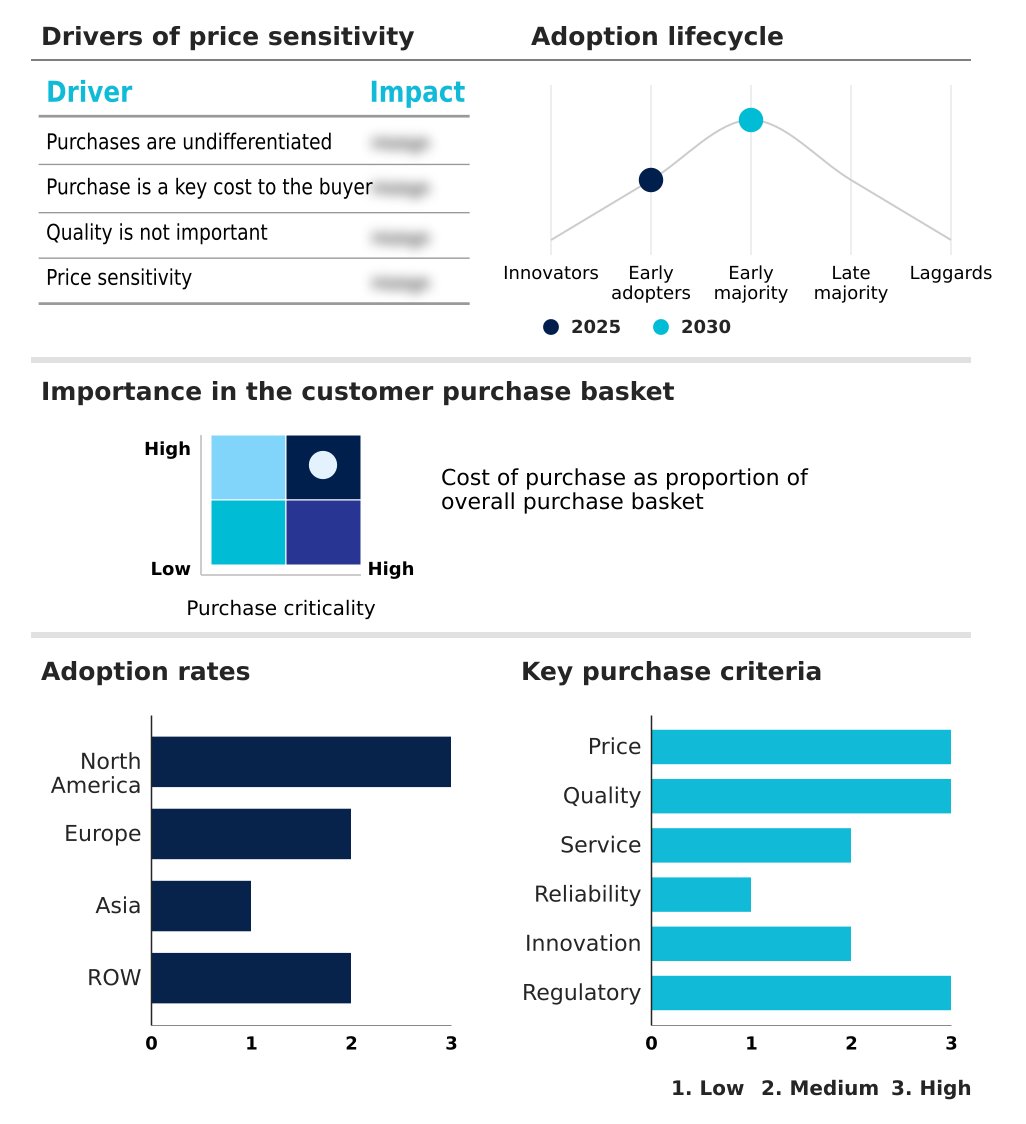
Exclusive Technavio Analysis on Customer Landscape
The regenerative medicine market forecasting report includes the adoption lifecycle of the market, covering from the innovator’s stage to the laggard’s stage. It focuses on adoption rates in different regions based on penetration. Furthermore, the regenerative medicine market report also includes key purchase criteria and drivers of price sensitivity to help companies evaluate and develop their market growth analysis strategies.
Customer Landscape of Regenerative Medicine Industry
Competitive Landscape
Companies are implementing various strategies, such as strategic alliances, regenerative medicine market forecast, partnerships, mergers and acquisitions, geographical expansion, and product/service launches, to enhance their presence in the industry.
Baxter International Inc. - The organization provides advanced regenerative solutions, featuring surgical sealants, biologic therapeutics, and foundational regenerative treatments designed to accelerate tissue repair and improve critical surgical outcomes.
The industry research and growth report includes detailed analyses of the competitive landscape of the market and information about key companies, including:
- Baxter International Inc.
- BioMarin Pharmaceutical Inc.
- Bristol Myers Squibb Co.
- CRISPR Therapeutics AG
- CSL Ltd.
- Ferring BV
- Genetix Biotherapeutics Inc.
- Gilead Sciences Inc.
- Legend Biotech Corp.
- Medtronic Plc
- Mesoblast Ltd.
- MiMedx Group Inc.
- Novartis AG
- Organogenesis Holdings Inc.
- Sarepta Therapeutics Inc.
- Smith and Nephew plc
- Stryker Corp.
- Thermo Fisher Scientific Inc.
- Vericel Corp.
- Zimmer Biomet Holdings Inc.
Qualitative and quantitative analysis of companies has been conducted to help clients understand the wider business environment as well as the strengths and weaknesses of key industry players. Data is qualitatively analyzed to categorize companies as pure play, category-focused, industry-focused, and diversified; it is quantitatively analyzed to categorize companies as dominant, leading, strong, tentative, and weak.
Recent Development and News in Regenerative medicine market
- In the Pharmaceuticals industry, the widespread adoption of AI-driven drug discovery platforms has reduced initial target identification cycles by 25%, directly accelerating the development of advanced cell and gene therapies within the Regenerative Medicine sector.
- The implementation of the EU Falsified Medicines Directive has tightened supply chain traceability mandates, prompting a 30% increase in investments toward rigorous cold chain logistics and cryogenic transport systems for sensitive autologous biological materials.
- Shift toward continuous manufacturing processes in biologic production has enhanced facility throughput by 40%, directly enabling higher economies of scale and improved batch consistency for complex allogeneic cell platforms.
- The expansion of decentralized clinical trial frameworks has increased diverse patient enrollment by 20%, facilitating more rapid validation of patient specific therapeutic models and novel culture media formulations in regenerative clinical pipelines.
Dive into Technavio’s robust research methodology, blending expert interviews, extensive data synthesis, and validated models for unparalleled Regenerative Medicine Market insights. See full methodology.
| Market Scope | |
|---|---|
| Page number | 292 |
| Base year | 2025 |
| Historic period | 2020-2024 |
| Forecast period | 2026-2030 |
| Growth momentum & CAGR | Accelerate at a CAGR of 26.3% |
| Market growth 2026-2030 | USD 142182.8 million |
| Market structure | Fragmented |
| YoY growth 2025-2026(%) | 25.6% |
| Key countries | US, Canada, Mexico, Germany, UK, France, Italy, Spain, The Netherlands, China, Japan, India, South Korea, Taiwan, Singapore, Brazil, Saudi Arabia, UAE, Egypt, Argentina, Chile, South Africa and Kuwait |
| Competitive landscape | Leading Companies, Market Positioning of Companies, Competitive Strategies, and Industry Risks |
Research Analyst Overview
- The continuous evolution of the Regenerative Medicine is fundamentally reshaping how healthcare systems address previously untreatable genetic and chronic conditions. Boardroom strategies are increasingly prioritizing the development of scalable allogeneic cell platforms to overcome the logistical and financial limitations inherent to autologous therapies.
- This strategic shift directly influences long-term budgeting and product portfolio planning, as organizations move toward standardized, universal treatments. To support this transition, substantial investments are directed toward advanced three dimensional bioprinting and the integration of sophisticated artificial intelligence protocols within automated production environments.
- These technological implementations allow facilities to continuously monitor cellular morphology and precise cellular reprogramming dynamics in real time. Consequently, manufacturing hubs utilizing these smart systems have achieved a 30% reduction in processing time compared to traditional frameworks. The deployment of precision genomic editing tools and customized lipid nanoparticles further guarantees accurate therapeutic delivery.
- By securing robust stem cell biology capabilities, industry leaders are successfully mitigating operational risks and ensuring the sustainable delivery of life-saving cell and gene therapies.
What are the Key Data Covered in this Regenerative Medicine Market Research and Growth Report?
-
What is the expected growth of the Regenerative Medicine Market between 2026 and 2030?
-
USD 142.18 billion, at a CAGR of 26.3%
-
-
What segmentation does the market report cover?
-
The report is segmented by Application (Oncology, Musculoskeletal, Dermatology, and Others), Technology (Cell and tissue-based, and Gene therapy), End-user (Hospitals, Clinics, and Others) and Geography (North America, Europe, Asia, Rest of World (ROW))
-
-
Which regions are analyzed in the report?
-
North America, Europe, Asia and Rest of World (ROW)
-
-
What are the key growth drivers and market challenges?
-
Rising prevalence of chronic diseases and target pathologies, Exorbitant therapeutic development costs and fragile reimbursement paradigms
-
-
Who are the major players in the Regenerative Medicine Market?
-
Baxter International Inc., BioMarin Pharmaceutical Inc., Bristol Myers Squibb Co., CRISPR Therapeutics AG, CSL Ltd., Ferring BV, Genetix Biotherapeutics Inc., Gilead Sciences Inc., Legend Biotech Corp., Medtronic Plc, Mesoblast Ltd., MiMedx Group Inc., Novartis AG, Organogenesis Holdings Inc., Sarepta Therapeutics Inc., Smith and Nephew plc, Stryker Corp., Thermo Fisher Scientific Inc., Vericel Corp. and Zimmer Biomet Holdings Inc.
-
Market Research Insights
- The Regenerative Medicine is rapidly shifting toward scalable commercial scalability as organizations seek to overcome traditional manufacturing constraints. The integration of contract development organizations into the supply chain has enabled developers to accelerate target discovery and achieve a 35% reduction in facility capital expenditures.
- Furthermore, the optimization of culture media formulations ensures superior batch consistency, directly translating to a 20% increase in viable cellular yields during expansion phases. By standardizing off the shelf solutions, biomanufacturing entities can effectively manage acute medical crises while significantly lowering production overhead. These operational efficiencies facilitate broader clinical adoption and establish highly resilient therapeutic distribution networks.
We can help! Our analysts can customize this regenerative medicine market research report to meet your requirements.
 RIA -
RIA - 
