Rehabilitation Robots Market Size 2025-2029
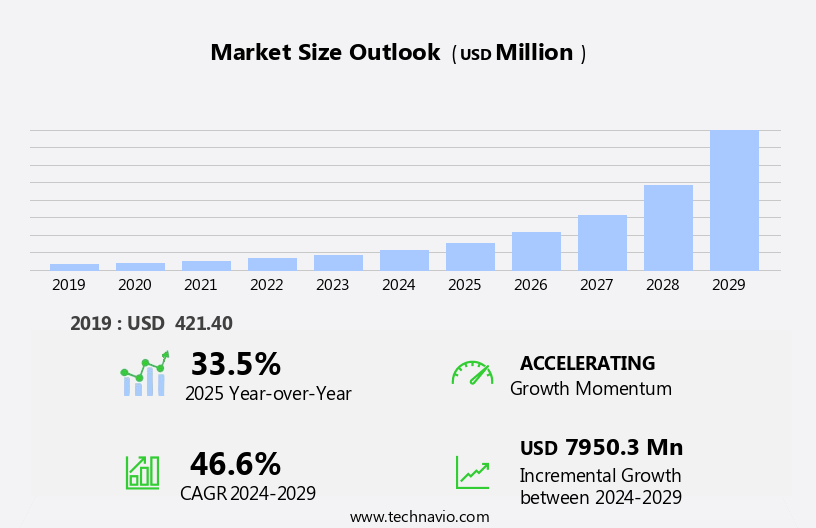
The rehabilitation robots market size is forecast to increase by USD 7.95 billion at a CAGR of 46.6% between 2024 and 2029.
- The market is experiencing significant growth due to the rising instances of strokes, injuries, and neurological diseases, which create a high demand for advanced rehabilitation solutions. The aging population further fuels market expansion, as an increasing number of elderly individuals require rehabilitation services. However, the high cost of rehabilitation robots poses a significant challenge for market growth. Despite this obstacle, companies can capitalize on opportunities by focusing on cost reduction strategies, such as producing more affordable models or offering financing options. The integration of artificial intelligence and machine learning technologies in rehabilitation robots is a key trend, enabling personalized therapy programs and improved patient outcomes
- Regulatory hurdles also impact adoption, necessitating robust compliance strategies and collaborations with regulatory bodies. Supply chain inconsistencies, including component availability and delivery times, temper growth potential. To navigate these challenges effectively, market participants should prioritize strategic partnerships, invest in research and development, and maintain a strong focus on customer needs and satisfaction.
What will be the Size of the Rehabilitation Robots Market during the forecast period?
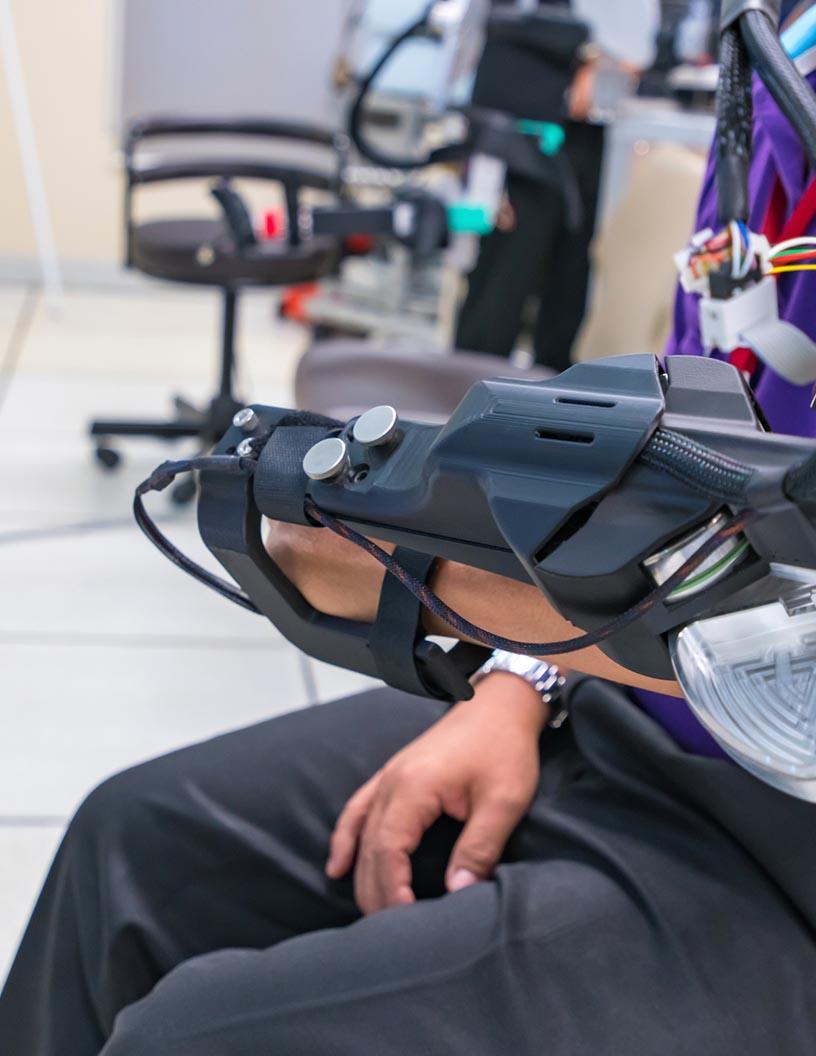
- In the dynamic US market for therapy robots, the commercialization of exoskeleton technology continues to gain traction, particularly in medical applications for musculoskeletal disorders and rehabilitation of the elderly population. The prevalence of conditions such as stroke and spinal cord injury necessitates advanced solutions for lower body disabilities. Healthcare providers prioritize device reliability and user safety in the approval process for these technologically advanced pieces of equipment. Exoskeletons, including robotic lower-body and upper body extremity models, are increasingly utilized in standard care hospitalization and rehabilitation centers. The geriatric population, afflicted by chronic diseases and disabilities, benefits significantly from these innovative solutions.
- Stringent regulations ensure that these devices meet the highest safety standards, with a focus on user safety and maintenance. Cerebral palsy patients and those with other mobility impairments also stand to benefit from these advancements. As the market for rehabilitation robots continues to grow, healthcare organizations invest in these solutions to improve patient outcomes and enhance the quality of care. The integration of exoskeletons into therapy programs offers a promising future for those requiring maintenance and support in overcoming lower body disabilities.
How is this Rehabilitation Robots Industry segmented?
The rehabilitation robots industry research report provides comprehensive data (region-wise segment analysis), with forecasts and estimates in "USD million" for the period 2025-2029, as well as historical data from 2019-2023 for the following segments.
- Product
- UERR
- LERR
- FE
- TRR
- End-user
- Hospitals and clinics
- Senior care facilities
- Homecare settings
- Product Type
- Lower body
- Upper body
- Geography
- North America
- US
- Canada
- Europe
- France
- Germany
- Italy
- UK
- APAC
- China
- India
- Japan
- South Korea
- Rest of World (ROW)
- North America
By Product Insights
The UERR segment is estimated to witness significant growth during the forecast period.
Rehabilitation robots, technologically advanced equipment designed to assist individuals with neurological impairments and musculoskeletal issues in regaining mobility, have gained significant attention in the healthcare sector. The European Commission's focus on improving geriatric care and the prevalence of chronic diseases, such as spinal cord injury and cerebral palsy, have driven the demand for these devices. With the aging population and the increasing prevalence of stroke, the need for rehabilitation robots, particularly for upper body extremities, has surged. These robots offer a solution to the shortage of therapy professionals and enable paralyzed patients to perform activities of daily living with minimal impact on their lives.
The FDA approval process ensures user safety and device reliability, making these robots a valuable addition to hospitals and clinics. Exoskeletons, a type of rehabilitation robot, are also gaining popularity, particularly for lower body disabilities. The commercialization of these products is expected to continue as awareness of their benefits grows, with senior care facilities and healthcare providers investing in this technology for post-stroke rehabilitation. Despite the stringent regulations, trainers are essential for effective use, ensuring optimal results for patients with conditions like multiple sclerosis and musculoskeletal disorders.
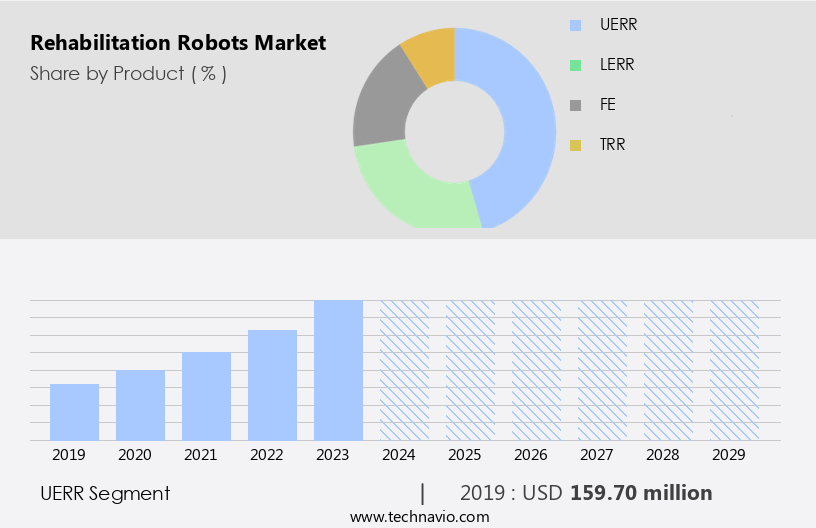
The UERR segment was valued at USD 159.70 billion in 2019 and showed a gradual increase during the forecast period.
Regional Analysis
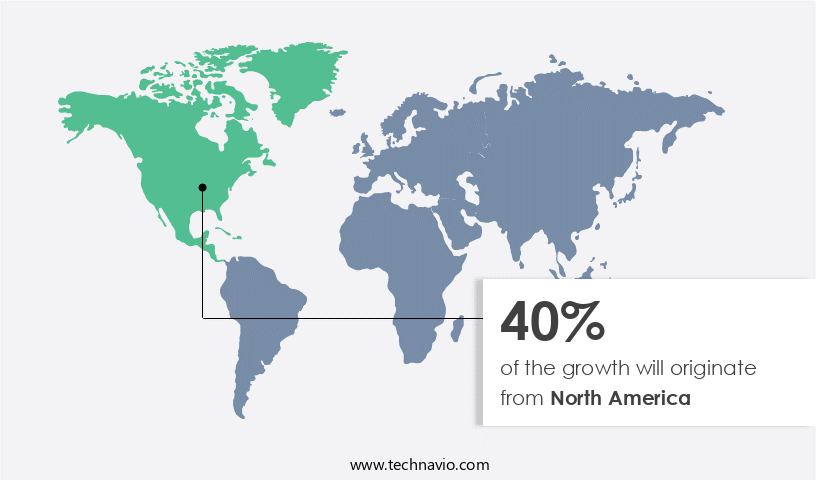
North America is estimated to contribute 40% to the growth of the global market during the forecast period.Technavio's analysts have elaborately explained the regional trends and drivers that shape the market during the forecast period.
In the US, healthcare expenditure surpasses the global average, with nearly half of the spending allocated to hospitals, clinics, and senior care facilities. These institutions are integrating technologically advanced rehabilitation robots to cater to the increasing prevalence of neurological impairments, particularly among the geriatric population. Factors such as the high incidence of chronic diseases like stroke and spinal cord injury, stringent regulations ensuring user safety, and the FDA's approval process for paralyzed patients contribute to the market's growth. Exoskeletons, therapy robots, and other rehabilitation equipment targeting lower body disabilities and upper body extremities are commercially available, addressing musculoskeletal disorders and musculoskeletal issues.
Healthcare providers are increasingly relying on these devices for post-stroke rehabilitation and the treatment of conditions like cerebral palsy and multiple sclerosis. The European Commission's emphasis on standard care hospitalization and ISO standards further encourages the adoption of these technologies. Despite the complex approval process, the market continues to expand as awareness of the benefits of rehabilitation robots surges among the frail elderly and their caregivers.
Market Dynamics
Our researchers analyzed the data with 2024 as the base year, along with the key drivers, trends, and challenges. A holistic analysis of drivers will help companies refine their marketing strategies to gain a competitive advantage.
What are the Rehabilitation Robots market drivers leading to the rise in the adoption of Industry?
- The surge in cases of strokes, injuries, and neurological diseases serves as the primary catalyst for market growth in this sector.
- The market is experiencing significant growth due to the rising prevalence of neurological impairments among older adults and individuals with chronic diseases. Conditions such as strokes, spinal cord injuries, traumatic brain injuries, multiple sclerosis, Parkinson's disease, and cerebral palsy are driving the demand for technologically advanced rehabilitation solutions. With increasing awareness of robot-assisted treatments and high disposable income per capita, more individuals, particularly in developed countries, are investing in rehabilitation robots for recovery and improved quality of life. The European Commission has been actively promoting the use of rehabilitation robots to address the shortage of experienced therapists and the high cost of rehabilitation training.
- The need for prolonged therapy sessions, as required in conventional therapy, is also leading to the adoption of alternative methods involving rehabilitation robots. User safety remains a top priority in the development and deployment of rehabilitation robots, with regulatory bodies such as the FDA granting approvals for the use of these devices in paralyzed patients. Overall, the market is poised for continued growth as it offers a promising solution for individuals seeking effective and efficient rehabilitation therapy.
What are the Rehabilitation Robots market trends shaping the Industry?
- The aging population represents a significant market trend that is gaining momentum. This demographic shift presents numerous opportunities for businesses catering to the unique needs of older adults.
- The global aging population, which accounted for approximately 10% of the world's total population in 2024, is becoming more susceptible to chronic ailments, including orthopedic disorders. In response, governments are taking initiatives to enhance access to healthcare, leading to an increased demand for rehabilitation robots. These robots play a crucial role in providing physical assistance to elderly patients, particularly in developed regions of North America and Europe. Developing regions, such as APAC and South America, are also expected to witness significant growth in the adoption of rehabilitation robots, particularly among the elderly population. The prevalence of conditions like stroke and cerebral palsy further underscores the need for these advanced technologies.
- The approval process for these medical applications is ongoing, with exoskeletons, for both lower body disabilities and upper body extremities, gaining traction. The implementation of rehabilitation robots is poised to increase over the forecast period as the global population continues to age.
How does Rehabilitation Robots market faces challenges face during its growth?
- The high cost of rehabilitation robots poses a significant challenge to the growth of the industry, as these advanced technologies remain a substantial investment for healthcare providers and organizations.
- Rehabilitation robots, a technological innovation in healthcare, offer significant benefits for individuals dealing with lower body extremity musculoskeletal disorders and post-stroke paralysis. However, the high cost of these devices, which can reach up to USD100,000, poses a significant barrier to adoption for both healthcare providers and senior care facilities. This price point is substantially higher than traditional rehabilitation methods and substitute products, which typically cost around USD1,500. The total cost of ownership for rehabilitation robots also includes expenses for servicing, maintenance, training, and supervision, further increasing the financial commitment. Few companies currently provide affordable options due to the novelty of the technology, leading to a moderate competition landscape and limited bargaining power for buyers.
- Additionally, in developing countries, price sensitivity may cause potential customers to opt for less expensive alternatives. Despite these challenges, The market continues to grow, driven by the potential for improved patient outcomes and reduced healthcare expenditure in the long term.
Exclusive Customer Landscape
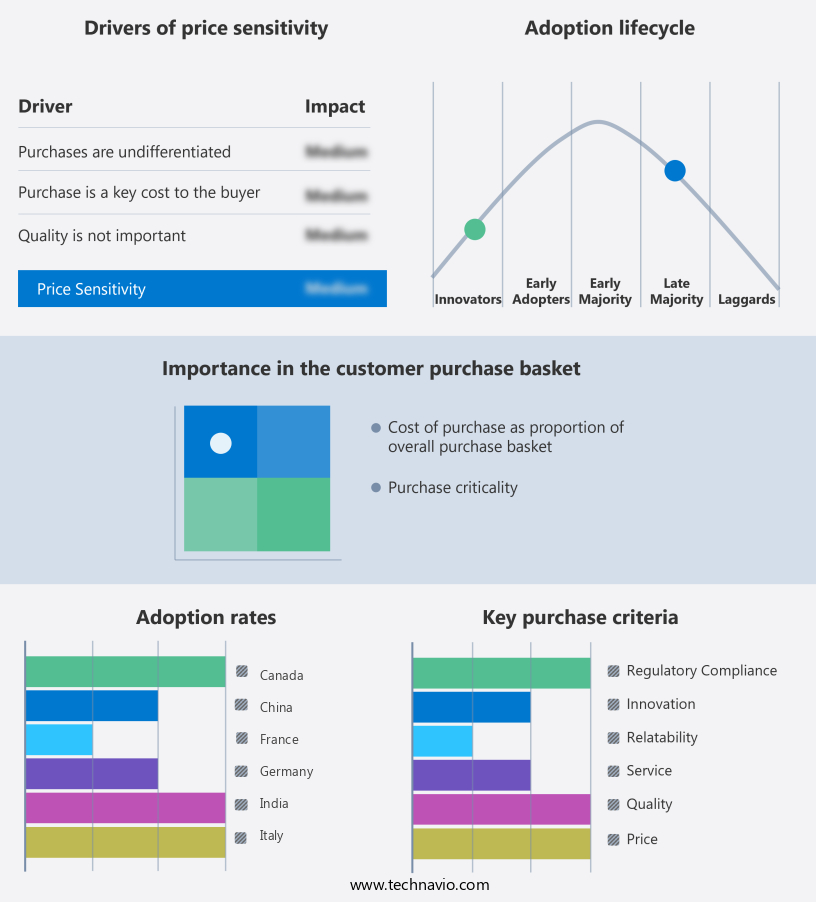
The rehabilitation robots market forecasting report includes the adoption lifecycle of the market, covering from the innovator's stage to the laggard's stage. It focuses on adoption rates in different regions based on penetration. Furthermore, the rehabilitation robots market report also includes key purchase criteria and drivers of price sensitivity to help companies evaluate and develop their market growth analysis strategies.
Customer Landscape
Key Companies & Market Insights
Companies are implementing various strategies, such as strategic alliances, rehabilitation robots market forecast, partnerships, mergers and acquisitions, geographical expansion, and product/service launches, to enhance their presence in the industry.
ABB Ltd. - The company specializes in advanced rehabilitation technology, utilizing robotic solutions such as ABB SCARA robots, to enhance patient recovery and mobility.
The industry research and growth report includes detailed analyses of the competitive landscape of the market and information about key companies, including:
- ABB Ltd.
- AlterG Inc.
- B Temia
- Bionik Laboratories Corp.
- Boston Dynamics Inc.
- Cyberdyne Inc.
- DIH Hero
- Diligent Robotics Inc.
- Ekso Bionics Holdings Inc.
- Focal Meditech
- Fourier Intelligence
- Hocoma AG
- KUKA AG
- MediTouch Ltd.
- MossRehab
- MYOMO INC.
- Ottobock SE and Co. KGaA
- PARKER HANNIFIN CORP.
- Reha Stim Medtec AG
- ReWalk Robotics Ltd.
- Rex Bionics Ltd.
- Siemens AG
- Tyromotion GmbH
Qualitative and quantitative analysis of companies has been conducted to help clients understand the wider business environment as well as the strengths and weaknesses of key industry players. Data is qualitatively analyzed to categorize companies as pure play, category-focused, industry-focused, and diversified; it is quantitatively analyzed to categorize companies as dominant, leading, strong, tentative, and weak.
Recent Development and News in Rehabilitation Robots Market
- In February 2024, Hocama Robotics, a leading rehabilitation robotics company, announced the launch of their new exoskeleton robot, "ExoRehab," designed for stroke rehabilitation. ExoRehab is the first robotic device to receive FDA clearance for home use, marking a significant shift in the accessibility and affordability of rehabilitation technology (Hocama Robotics Press Release).
- In October 2024, Intuitive Surgical, a global leader in robotic-assisted surgery, entered the rehabilitation robotics market through a strategic partnership with Bionik Laboratories. This collaboration aims to integrate Bionik's rehabilitation robots with Intuitive's surgical systems, creating a comprehensive solution for post-surgical rehabilitation (Intuitive Surgical Press Release).
- In January 2025, Ekso Bionics, a prominent rehabilitation robotics company, secured a USD30 million series D funding round, led by New Enterprise Associates (NEA). This investment will be used to expand the company's product portfolio and accelerate the commercialization of their robotic exoskeletons (Ekso Bionics Press Release).
- In March 2025, the European Union approved the use of rehabilitation robots in clinical settings, marking a major policy change. This decision is expected to boost the adoption of rehabilitation robots in Europe, which currently lags behind North America in this technology (European Parliament Press Release).
Research Analyst Overview
Rehabilitation robots have emerged as a promising solution for addressing the unique needs of individuals with neurological impairments and chronic diseases, particularly among the geriatric population. The European Commission has identified the importance of technologically advanced equipment in medical applications, with a focus on improving the quality of life for older adults and paralyzed patients. The prevalence of neurological conditions, such as spinal cord injury, cerebral palsy, and multiple sclerosis, is on the rise, fueling the demand for rehabilitation robots. These robots offer numerous benefits, including the ability to provide personalized therapy sessions, improve user safety, and enhance the effectiveness of rehabilitation programs.
The approval process for rehabilitation robots is stringent, with regulatory bodies like the FDA ensuring the reliability and safety of these devices. Hospitals and clinics have begun integrating these robots into their standard care hospitalization and senior care facilities, as the cost of healthcare expenditure continues to rise. Rehabilitation robots are not limited to lower body disabilities. Therapy robots for upper body extremities have also gained popularity, particularly among individuals with musculoskeletal disorders and musculoskeletal issues. Exoskeletons, a type of rehabilitation robot, have shown significant potential in helping individuals regain mobility and independence. The aging population, particularly the frail elderly, is a significant target market for rehabilitation robots.
The surging awareness of the importance of maintaining mobility and independence in older adults has led to the commercialization of these products. User safety is a top priority in the development and implementation of rehabilitation robots. ISO standards and trainers play a crucial role in ensuring the safe and effective use of these devices. The European Commission has also recognized the importance of user safety and has implemented regulations to ensure the safety and reliability of rehabilitation robots. The rehabilitation robot market is dynamic and evolving, with new advancements and applications emerging regularly. The use of rehabilitation robots in post-stroke rehabilitation, for example, has shown promising results in improving functional recovery and reducing the risk of complications.
In conclusion, the rehabilitation robot market is poised for significant growth, driven by the increasing prevalence of neurological impairments and chronic diseases, particularly among the geriatric population. The integration of these robots into healthcare settings and the focus on user safety and reliability are key factors contributing to their growing popularity. The ongoing development of new technologies and applications will continue to shape the dynamics of this market.
Dive into Technavio's robust research methodology, blending expert interviews, extensive data synthesis, and validated models for unparalleled Rehabilitation Robots Market insights. See full methodology.
|
Market Scope |
|
|
Report Coverage |
Details |
|
Page number |
218 |
|
Base year |
2024 |
|
Historic period |
2019-2023 |
|
Forecast period |
2025-2029 |
|
Growth momentum & CAGR |
Accelerate at a CAGR of 46.6% |
|
Market growth 2025-2029 |
USD 7950.3 million |
|
Market structure |
Fragmented |
|
YoY growth 2024-2025(%) |
33.5 |
|
Key countries |
US, Japan, Germany, UK, Canada, France, China, India, Italy, and South Korea |
|
Competitive landscape |
Leading Companies, Market Positioning of Companies, Competitive Strategies, and Industry Risks |
What are the Key Data Covered in this Rehabilitation Robots Market Research and Growth Report?
- CAGR of the Rehabilitation Robots industry during the forecast period
- Detailed information on factors that will drive the growth and forecasting between 2025 and 2029
- Precise estimation of the size of the market and its contribution of the industry in focus to the parent market
- Accurate predictions about upcoming growth and trends and changes in consumer behaviour
- Growth of the market across North America, Europe, APAC, South America, and Middle East and Africa
- Thorough analysis of the market's competitive landscape and detailed information about companies
- Comprehensive analysis of factors that will challenge the rehabilitation robots market growth of industry companies
We can help! Our analysts can customize this rehabilitation robots market research report to meet your requirements.
 RIA -
RIA - 
