
REIT Market Size 2026-2030
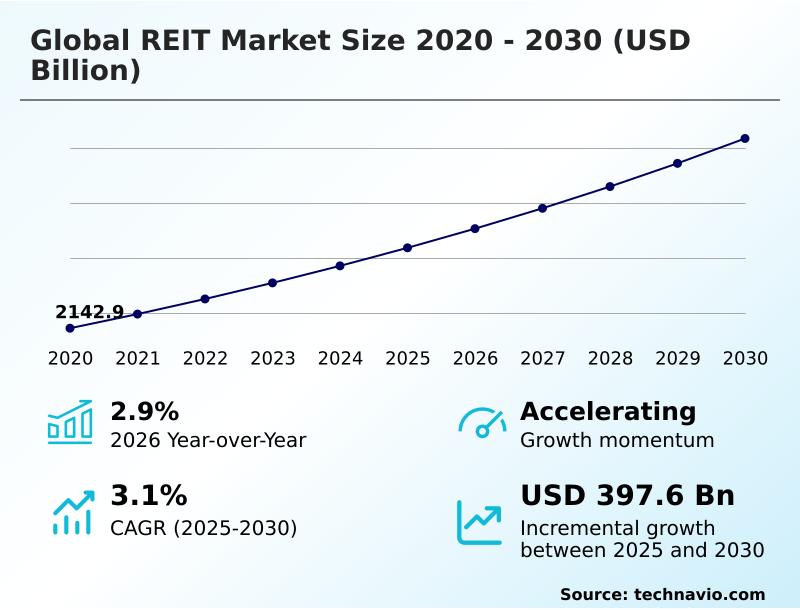
The reit market size is valued to increase by USD 397.6 billion, at a CAGR of 3.1% from 2025 to 2030. Persistent search for yield and portfolio diversification will drive the reit market.
Major Market Trends & Insights
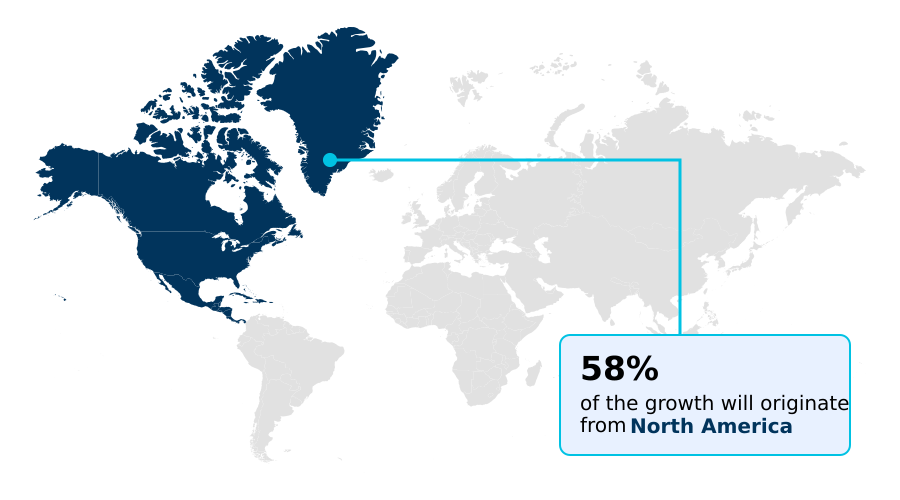
- North America dominated the market and accounted for a 58.3% growth during the forecast period.
- By Type - Industrial segment was valued at USD 1691.9 billion in 2024
- By Application - Warehouses and communication centers segment accounted for the largest market revenue share in 2024
Market Size & Forecast
- Market Opportunities: USD 689.9 billion
- Market Future Opportunities: USD 397.6 billion
- CAGR from 2025 to 2030 : 3.1%
Market Summary
- The REIT market offers investors access to portfolios of income-generating real estate through publicly traded securities, modeled after mutual funds. A key driver is the search for durable income and portfolio diversification benefits, as these instruments provide a reliable dividend yield and a historical hedge against inflation.
- This market is undergoing a significant transformation, with capital rotating from traditional office and retail properties to specialized property sectors. The digital economy fuels intense demand for digital infrastructure assets like data centers and cell towers, while demographic shifts support growth in healthcare real estate.
- For example, a logistics REIT might implement an asset recycling strategy, divesting older warehouses to fund the development of automated last-mile logistics facility hubs. This approach optimizes funds from operations (FFO) and aligns the portfolio with modern supply chain needs.
- However, the industry's performance is closely tied to macroeconomic conditions, with interest rate sensitivity being a primary challenge that can impact the cost of capital and property valuations, affecting rental growth dynamics.
What will be the Size of the REIT Market during the forecast period?
Get Key Insights on Market Forecast (PDF) Get Free Sample
How is the REIT Market Segmented?
The reit industry research report provides comprehensive data (region-wise segment analysis), with forecasts and estimates in "USD billion" for the period 2026-2030, as well as historical data from 2020-2024 for the following segments.
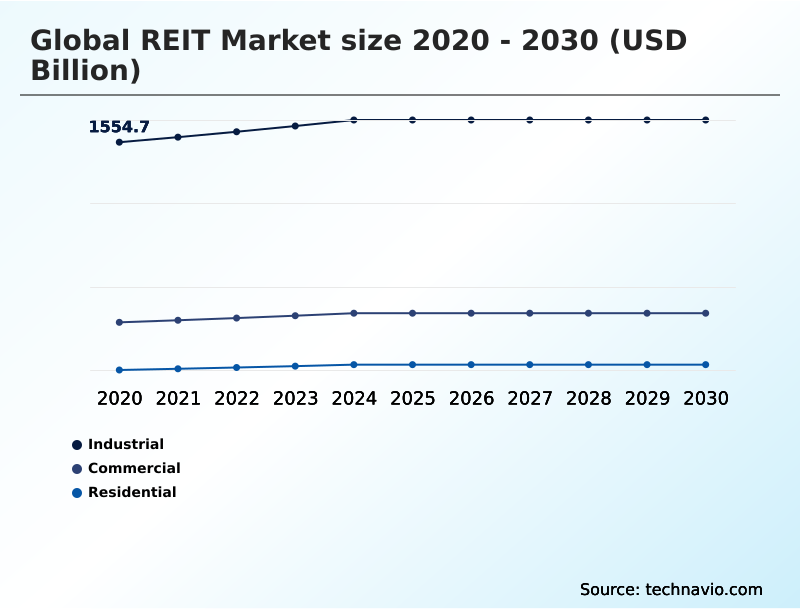
- Type
- Industrial
- Commercial
- Residential
- Application
- Warehouses and communication centers
- Self-storage facilities and data centers
- Others
- Product type
- Triple net
- Double net
- Modified gross lease
- Full service
- Percentage
- Geography
- North America
- US
- Canada
- Mexico
- APAC
- Japan
- Australia
- China
- Europe
- UK
- France
- Germany
- South America
- Brazil
- Argentina
- Middle East and Africa
- Saudi Arabia
- UAE
- South Africa
- Rest of World (ROW)
- North America
By Type Insights
The industrial segment is estimated to witness significant growth during the forecast period.
The industrial segment is driven by powerful structural growth drivers, particularly the expansion of e-commerce, which fuels demand for modern logistics supply chain infrastructure. This includes large fulfillment centers and, crucially, last-mile logistics facility assets near urban cores.
Beyond e-commerce, the onshoring of manufacturing and inventory strengthens the need for industrial space. Investment in industrial reit performance remains strong, fueled by high occupancy and positive rental growth dynamics.
For real estate portfolio management professionals, the focus is on property acquisition financing for state-of-the-art facilities.
These specialized property sectors, focused on income-generating real estate, have shown that optimizing facility layouts can improve throughput efficiency by up to 25%, a key metric for tenants.
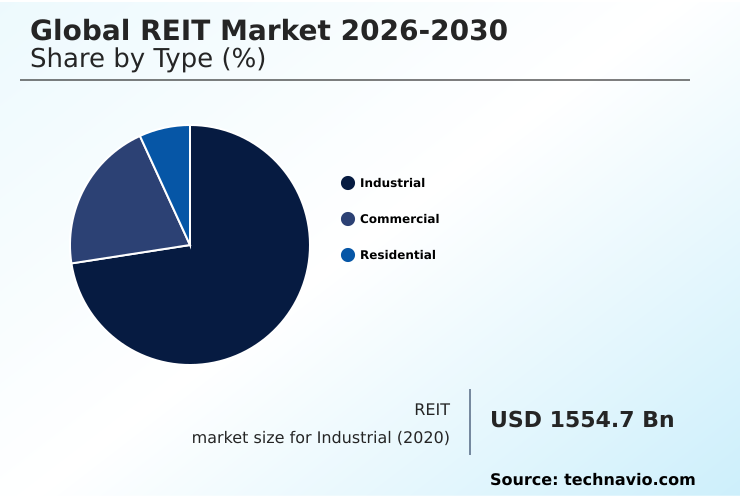
The Industrial segment was valued at USD 1691.9 billion in 2024 and showed a gradual increase during the forecast period.
Regional Analysis
North America is estimated to contribute 58.3% to the growth of the global market during the forecast period.Technavio’s analysts have elaborately explained the regional trends and drivers that shape the market during the forecast period.
See How REIT Market Demand is Rising in North America Get Free Sample
The geographic landscape of the REIT market is led by North America, which accounts for over 58% of the global market opportunity. This mature market is defined by a high degree of specialization and innovation, particularly in the US.
In contrast, the APAC region is the fastest-growing, driven by the adoption of global REIT framework adoption in countries like India and China. European markets are focusing on modernizing core property assets and ESG compliance.
Across regions, there's a consistent focus on operational efficiency. For instance, strategic asset recycling strategy initiatives have helped firms improve their portfolio net asset value (NAV) by 5-8% annually.
Furthermore, the use of sale-leaseback transaction structures has unlocked capital for expansion while maintaining operational control, showcasing a key financial strategy in a competitive environment where cap rate compression is a persistent theme.
Market Dynamics
Our researchers analyzed the data with 2025 as the base year, along with the key drivers, trends, and challenges. A holistic analysis of drivers will help companies refine their marketing strategies to gain a competitive advantage.
- A comprehensive analysis of the global REIT market reveals complex dynamics influenced by various external and internal factors. A primary concern for investors is the impact of monetary policy on REITs, as rising rates can increase the cost of capital for REITs and diminish the relative appeal of their dividend yields.
- This is particularly relevant when evaluating REIT performance during inflationary periods, where their ability to act as an inflation hedge is tested. The growth drivers for industrial logistics continue to be robust, fueled by e-commerce, making last-mile facility investment criteria a key focus for acquisitions. Simultaneously, the market is seeing a divergence in asset classes.
- The future of retail REIT properties is being redefined through redevelopment and experiential concepts, while structural headwinds for office REITs persist due to hybrid work models. For investors, a key decision is the REIT vs direct property investment trade-off, weighing liquidity and diversification against direct control.
- The role of proptech in asset management is becoming critical for operational efficiency, with some platforms enabling a 15% reduction in maintenance overhead. Niche sectors also present unique considerations, from valuing data center REIT assets based on power and connectivity to understanding the healthcare REIT investment thesis tied to demographics.
- Analyzing REIT dividend sustainability and NAV premium and discount analysis are fundamental for stock selection. ESG integration in property portfolios is no longer optional, and triple net lease risk factors, such as tenant creditworthiness, are scrutinized. Furthermore, the nuances of cell tower lease escalation clauses and single-family rental market fundamentals require specialized knowledge.
- All activities must adhere to stringent REIT regulatory compliance requirements, underscoring the complexity of capital recycling in real estate.
What are the key market drivers leading to the rise in the adoption of REIT Industry?
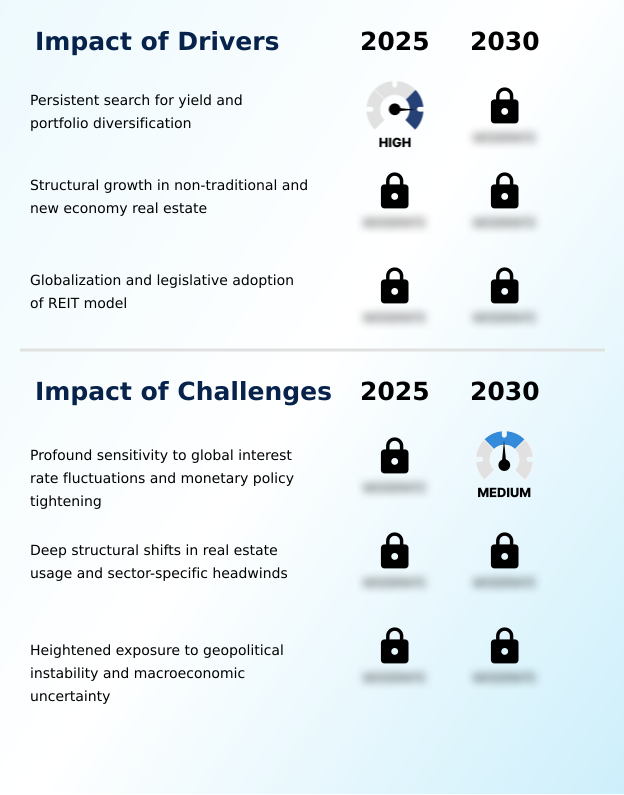
- The persistent search for yield and effective portfolio diversification remains a key driver of market growth.
- A primary driver for the market is the investor pursuit of stable income and portfolio diversification benefits.
- Publicly traded real estate offers compelling dividend yield comparison metrics, with top-tier industrial portfolios delivering a 5% higher net operating income (NOI) growth than broader market indices.
- The inflation-hedging characteristics of real estate are particularly attractive, as assets demonstrate a consistent ability to grow rental income.
- The global REIT framework adoption in emerging markets is expanding the investable universe, increasing capital inflows by over 20% in certain jurisdictions.
- This tax-efficient investment structure, combined with capital appreciation potential, makes it a cornerstone for many institutional and retail investors, especially as a yield-sensitive asset class in a fluctuating interest rate environment.
What are the market trends shaping the REIT Industry?
- A notable market trend is the strategic pivot toward niche property sectors. This shift is increasingly driven by technology-oriented assets and specialized real estate classes.
- A defining trend in the market is the pivot to non-traditional real estate, driven by structural economic shifts. Digital infrastructure assets, including data centers and cell towers, are at the forefront, with data center REIT demand fueling a 30% increase in hyperscale development pipelines.
- The adoption of property technology (proptech) is another key trend, enhancing asset management expertise and operational efficiency; platforms that optimize energy usage have demonstrated cost reductions of up to 15%. This strategic capital rotation is also evident in the single-family rental market, which has seen tenant retention rates improve by 10% year-over-year.
- As investors navigate sector-specific headwinds in traditional segments, ESG criteria integration is becoming a standard for attracting capital and mitigating long-term risk.
What challenges does the REIT Industry face during its growth?
- The market's profound sensitivity to global interest rate fluctuations and monetary policy tightening presents a key challenge to industry growth.
- The market faces significant challenges, primarily from its high interest rate sensitivity, which directly impacts the cost of capital and commercial property valuation models. An increase in benchmark rates can elevate borrowing costs by 50-75 basis points, squeezing margins. This monetary policy impact creates share price volatility and requires careful management of development pipeline risk.
- Another challenge involves sector-specific headwinds, particularly for the retail REIT sector, which has seen tenant defaults increase by 5% in secondary locations. Maintaining high tenant credit quality across portfolios is crucial.
- Navigating the real estate market cycle requires disciplined underwriting, as evidenced by the need to refinance maturing debt at potentially less favorable terms, which can strain liquidity and test an organization's financial resilience.
Exclusive Technavio Analysis on Customer Landscape
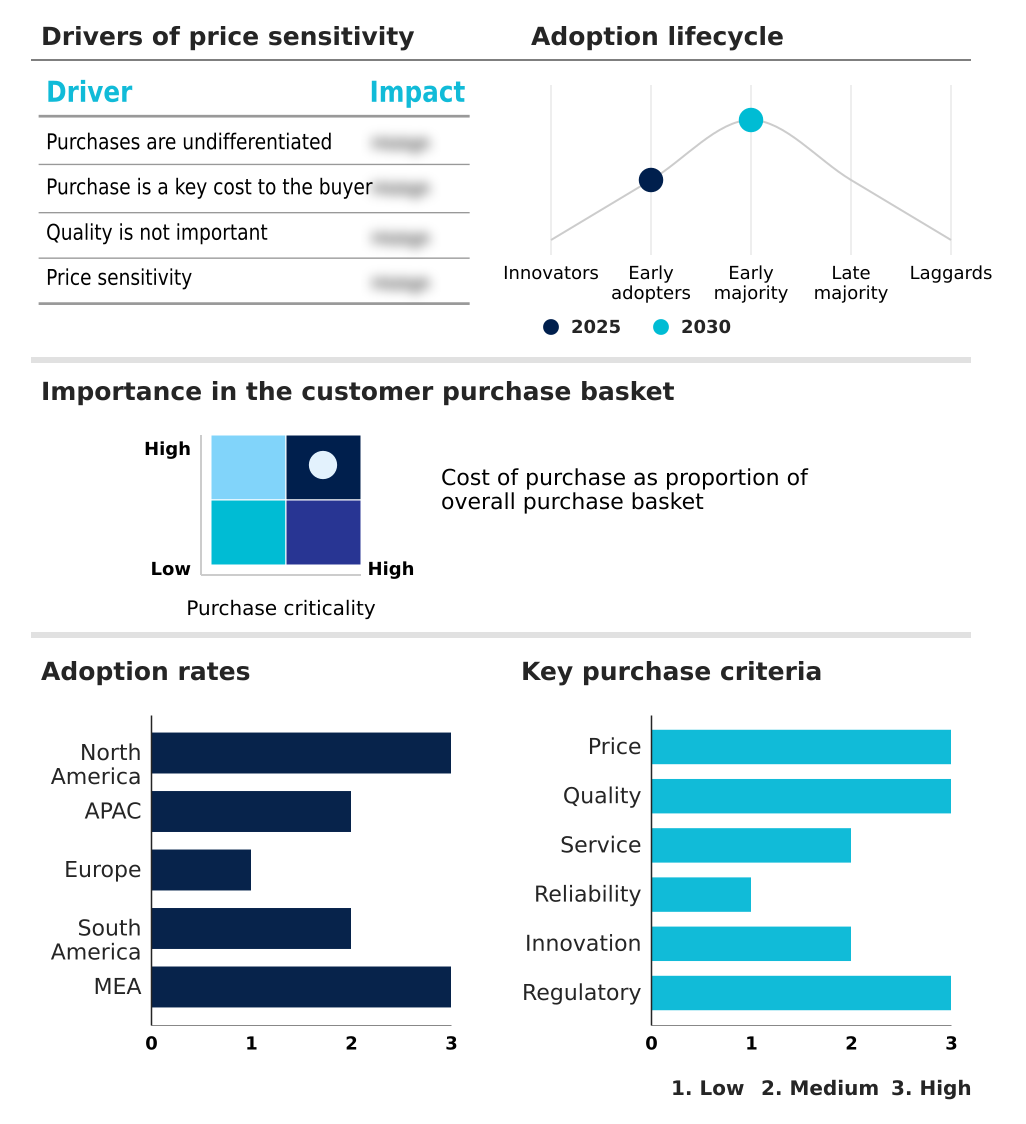
The reit market forecasting report includes the adoption lifecycle of the market, covering from the innovator’s stage to the laggard’s stage. It focuses on adoption rates in different regions based on penetration. Furthermore, the reit market report also includes key purchase criteria and drivers of price sensitivity to help companies evaluate and develop their market growth analysis strategies.
Customer Landscape of REIT Industry
Competitive Landscape
Companies are implementing various strategies, such as strategic alliances, reit market forecast, partnerships, mergers and acquisitions, geographical expansion, and product/service launches, to enhance their presence in the industry.
Automotive Properties REIT - Analysis indicates a specialized focus on acquiring and managing single-tenant automotive and service-related properties, creating a niche portfolio of income-generating assets.
The industry research and growth report includes detailed analyses of the competitive landscape of the market and information about key companies, including:
- Automotive Properties REIT
- Brookfield India Real Estate Trust inc.
- CapitaLand Ltd.
- Dexus Group
- Federal Realty Investment Trust
- Gecina REIT SA
- GPT Management Holdings Ltd.
- Japan Real Estate Investment Corp.
- Link Asset Management Ltd.
- Mirvac Group
- NorthWest Healthcare Properties
- Omega Heathcare Investors Inc.
- RioCan
- Segro Plc
- STAG Industrial Inc.
- W. P. Carey Inc.
Qualitative and quantitative analysis of companies has been conducted to help clients understand the wider business environment as well as the strengths and weaknesses of key industry players. Data is qualitatively analyzed to categorize companies as pure play, category-focused, industry-focused, and diversified; it is quantitatively analyzed to categorize companies as dominant, leading, strong, tentative, and weak.
Recent Development and News in Reit market
- In September 2024, STAG Industrial Inc. announced the acquisition of a $500 million portfolio of last-mile logistics facilities in key sunbelt markets, capitalizing on surging e-commerce demand.
- In November 2024, NorthWest Healthcare Properties launched a strategic joint venture to develop and acquire a portfolio of life science and medical office buildings adjacent to major research hubs, committing over $750 million in initial capital.
- In February 2025, W. P. Carey Inc. executed a series of sale-leaseback transactions valued at over $400 million, diversifying its portfolio with industrial and specialized retail assets while providing long-term net lease income.
- In March 2025, following a significant interest rate hike, Federal Realty Investment Trust announced a revised capital allocation strategy, prioritizing the redevelopment of existing mixed-use assets over new acquisitions to enhance portfolio value and manage borrowing costs.
Dive into Technavio’s robust research methodology, blending expert interviews, extensive data synthesis, and validated models for unparalleled REIT Market insights. See full methodology.
| Market Scope | |
|---|---|
| Page number | 292 |
| Base year | 2025 |
| Historic period | 2020-2024 |
| Forecast period | 2026-2030 |
| Growth momentum & CAGR | Accelerate at a CAGR of 3.1% |
| Market growth 2026-2030 | USD 397.6 billion |
| Market structure | Fragmented |
| YoY growth 2025-2026(%) | 2.9% |
| Key countries | US, Canada, Mexico, Japan, Australia, China, South Korea, Indonesia, India, UK, France, Germany, The Netherlands, Spain, Italy, Brazil, Argentina, Chile, Saudi Arabia, UAE, South Africa, Israel and Turkey |
| Competitive landscape | Leading Companies, Market Positioning of Companies, Competitive Strategies, and Industry Risks |
Research Analyst Overview
- The REIT market is defined by a strategic shift towards specialized property sectors and operational optimization. Performance is increasingly measured by metrics like funds from operations (FFO) and adjusted funds from operations (AFFO), which provide a clearer view of cash flow than standard accounting earnings.
- A key boardroom-level focus is the execution of an effective asset recycling strategy, where non-core property assets are sold to fund investments in high-growth areas like digital infrastructure assets and last-mile logistics facility projects. This disciplined capital allocation is critical in an environment where interest rate sensitivity affects the cost of capital.
- Successful operators are those who manage their development pipeline risk while maintaining high tenant credit quality. For example, the adoption of property technology (proptech) has enabled some industrial operators to increase space utilization by 20%.
- This pivot also involves complex structures like upreit transactions to facilitate tax-efficient acquisitions and a focus on ESG criteria integration, which impacts everything from net operating income (NOI) to the weighted average lease expiry (WALE).
What are the Key Data Covered in this REIT Market Research and Growth Report?
-
What is the expected growth of the REIT Market between 2026 and 2030?
-
USD 397.6 billion, at a CAGR of 3.1%
-
-
What segmentation does the market report cover?
-
The report is segmented by Type (Industrial, Commercial, and Residential), Application (Warehouses and communication centers, Self-storage facilities and data centers, and Others), Product Type (Triple net, Double net, Modified gross lease, Full service, and Percentage) and Geography (North America, APAC, Europe, South America, Middle East and Africa)
-
-
Which regions are analyzed in the report?
-
North America, APAC, Europe, South America and Middle East and Africa
-
-
What are the key growth drivers and market challenges?
-
Persistent search for yield and portfolio diversification, Profound sensitivity to global interest rate fluctuations and monetary policy tightening
-
-
Who are the major players in the REIT Market?
-
Automotive Properties REIT, Brookfield India Real Estate Trust inc., CapitaLand Ltd., Dexus Group, Federal Realty Investment Trust, Gecina REIT SA, GPT Management Holdings Ltd., Japan Real Estate Investment Corp., Link Asset Management Ltd., Mirvac Group, NorthWest Healthcare Properties, Omega Heathcare Investors Inc., RioCan, Segro Plc, STAG Industrial Inc. and W. P. Carey Inc.
-
Market Research Insights
- The REIT market is shaped by a dynamic interplay of structural growth drivers and sector-specific headwinds. Investors are increasingly focused on non-traditional real estate, with demand for data center REIT demand and cell tower REIT infrastructure showing marked acceleration.
- The logistics supply chain continues to be a focal point, where facilities adopting automated systems have reported a 15% increase in operational throughput. In contrast, retail REIT sector headwinds persist, compelling operators to innovate.
- This strategic shift is evident as asset management expertise is applied to repurpose assets, with some firms achieving a 20% improvement in energy efficiency, aligning with broader ESG goals.
- This environment highlights the importance of real estate portfolio management and adapting to the evolving real estate market cycle, especially as monetary policy impact creates share price volatility across this yield-sensitive asset class.
We can help! Our analysts can customize this reit market research report to meet your requirements.
 RIA -
RIA - 
