Remote Patient Monitoring Market Size 2026-2030
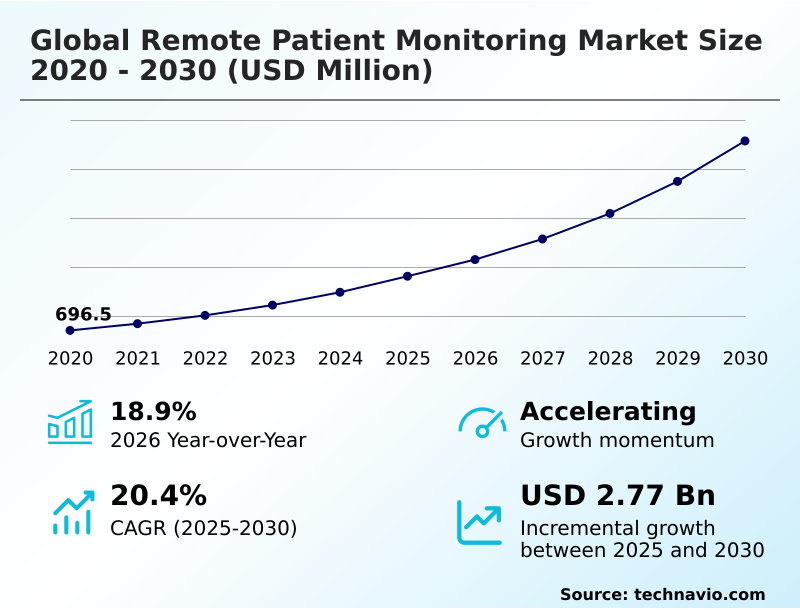
The remote patient monitoring market size is valued to increase by USD 2.77 billion, at a CAGR of 20.4% from 2025 to 2030. Rising burden of chronic diseases and global demographic shifts will drive the remote patient monitoring market.
Major Market Trends & Insights
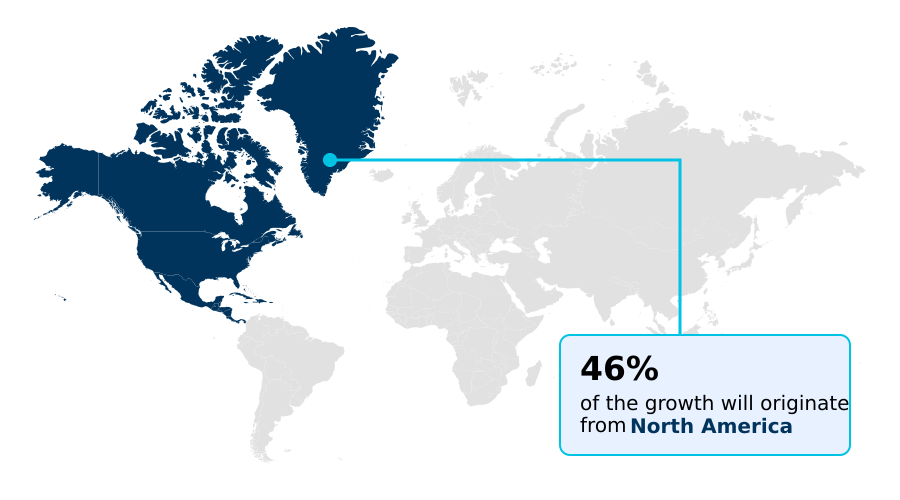
- North America dominated the market and accounted for a 45.9% growth during the forecast period.
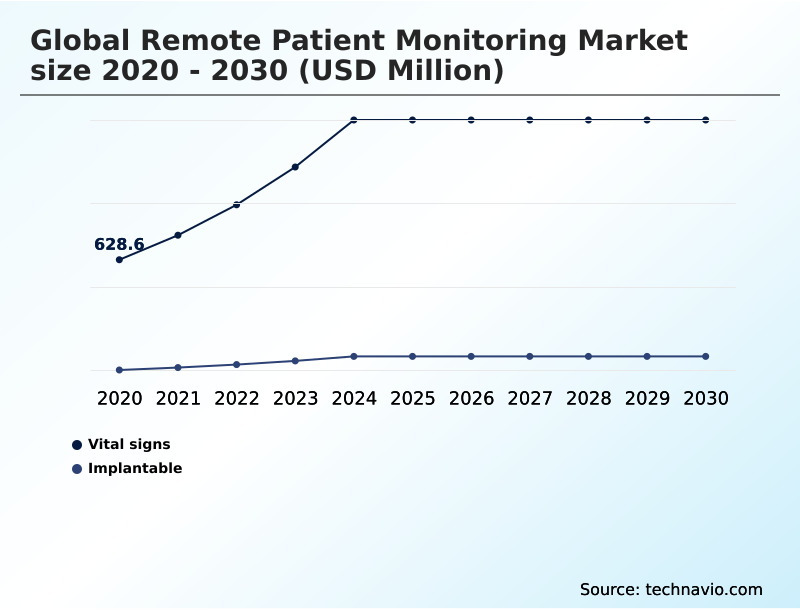
- By Product - Vital signs segment was valued at USD 1.34 billion in 2024
- By End-user - Hospitals segment accounted for the largest market revenue share in 2024
Market Size & Forecast
- Market Opportunities: USD 3.88 billion
- Market Future Opportunities: USD 2.77 billion
- CAGR from 2025 to 2030 : 20.4%
Market Summary
- The remote patient monitoring market is expanding beyond simple data collection, driven by the need for more efficient and proactive healthcare. This evolution in digital health is characterized by the integration of advanced sensors and intelligent analytics to manage chronic conditions and post-acute care.
- For instance, a health system can deploy a hospital-at-home program for patients recovering from cardiac surgery, using wearable biosensors for real-time clinical decision support. This approach leverages physiological data transmission to a central command center, where AI-powered diagnostic platforms analyze trends and alert clinicians to potential complications, reducing readmission rates and optimizing bed capacity.
- The market's trajectory is shaped by the convergence of miniaturized sensor hardware, telehealth communication platforms, and a growing focus on value-based care. However, ensuring secure data exchange protocols and navigating complex patient data privacy frameworks remain critical considerations for sustained growth and patient trust in these innovative care models.
What will be the Size of the Remote Patient Monitoring Market during the forecast period?
Get Key Insights on Market Forecast (PDF) Get Free Sample
How is the Remote Patient Monitoring Market Segmented?
The remote patient monitoring industry research report provides comprehensive data (region-wise segment analysis), with forecasts and estimates in "USD million" for the period 2026-2030, as well as historical data from 2020-2024 for the following segments.
- Product
- Vital signs
- Implantable
- End-user
- Hospitals
- ASCs
- Home care
- Application
- Cardiology
- Diabetes management
- Respiratory and pulmonary care
- Geography
- North America
- US
- Canada
- Mexico
- Europe
- Germany
- UK
- France
- Asia
- Rest of World (ROW)
- North America
By Product Insights
The vital signs segment is estimated to witness significant growth during the forecast period.
The vital signs segment is foundational to digital healthcare, focusing on devices for remote vital signs measurement like blood pressure cuffs and pulse oximeters.
Growth is driven by the need for continuous supervision in chronic care, supported by the expansion of reimbursement policy expansion and value-based healthcare incentives.
The integration of high-speed wireless connectivity and cloud-based data storage allows for the instantaneous transfer of data, facilitating rapid clinical responses.
This use of ambulatory surgical center (ASC) workflows and chronic disease management software has demonstrated a 15% improvement in early anomaly detection.
The focus on clinical-grade sensor accuracy and interoperable health systems is essential for creating a comprehensive patient health history, while patient adherence technologies ensure consistent data collection from home-based monitoring devices.
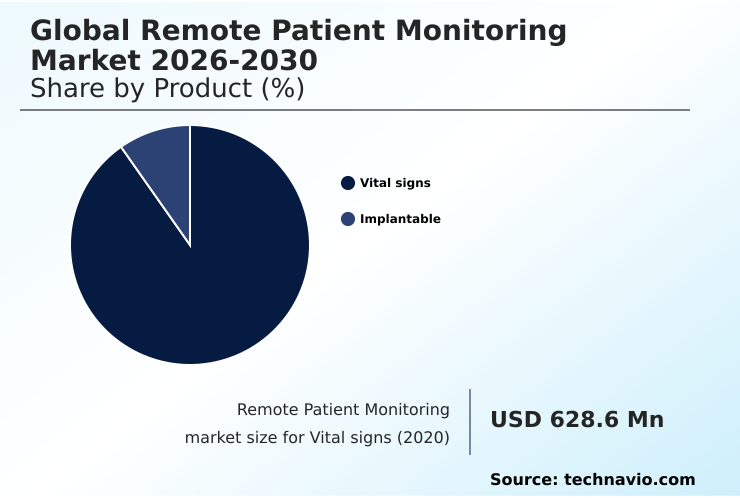
The Vital signs segment was valued at USD 1.34 billion in 2024 and showed a gradual increase during the forecast period.
Regional Analysis
North America is estimated to contribute 45.9% to the growth of the global market during the forecast period.Technavio’s analysts have elaborately explained the regional trends and drivers that shape the market during the forecast period.
See How Remote Patient Monitoring Market Demand is Rising in North America Get Free Sample
The geographic landscape of the remote patient monitoring market is led by North America, which accounts for over 45% of the incremental growth, driven by advanced healthcare infrastructure and favorable reimbursement policies.
This region sees high adoption of digital health application (diga) solutions and mHealth integration, supported by widespread 5G connectivity that ensures reliable physiological data transmission.
In contrast, Asia is the fastest-growing region, with a focus on deploying decentralized care models to bridge urban-rural healthcare gaps. Europe emphasizes regulatory compliance, with GDPR shaping patient data privacy frameworks.
The successful deployment of virtual ward infrastructure in the UK has reduced hospital stays by an average of 20%. Across all regions, the move toward data-driven treatment plans and cuffless blood pressure monitoring technologies is a unifying trend.
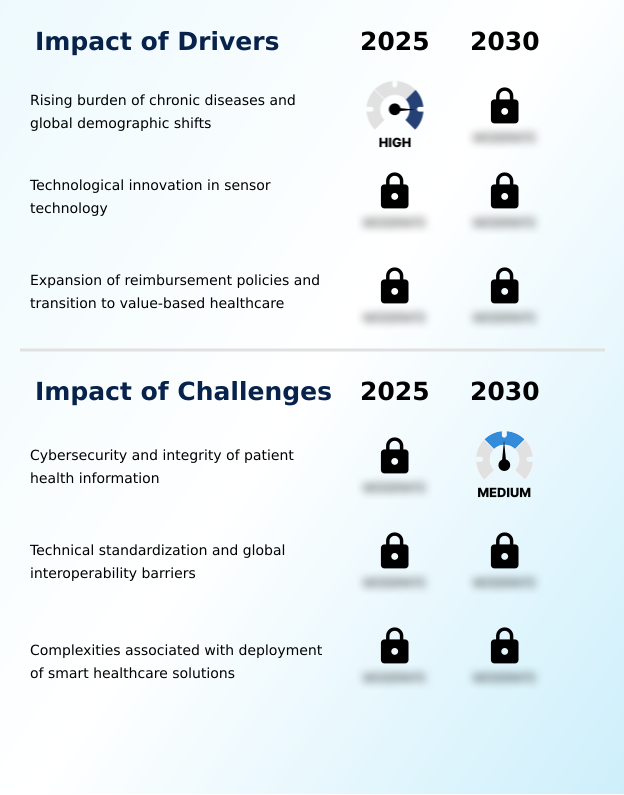
Market Dynamics
Our researchers analyzed the data with 2025 as the base year, along with the key drivers, trends, and challenges. A holistic analysis of drivers will help companies refine their marketing strategies to gain a competitive advantage.
- The global remote patient monitoring market is evolving through strategic implementations that address specific clinical and operational needs. The benefits of remote patient monitoring for cardiology are increasingly evident, with systems providing early warnings for cardiac events. A key focus is deploying virtual wards for post-acute care, which has proven to lower readmission rates significantly.
- However, this raises the importance of establishing robust security measures for wearable health technology to protect sensitive data. Many organizations still grapple with interoperability challenges in remote monitoring systems, which can hinder the seamless flow of information. The role of generative AI in predictive health analytics is becoming central to overcoming these issues by synthesizing complex data streams.
- When comparing implantable vs wearable monitoring devices, the choice often depends on the required data fidelity and patient lifestyle. The remote patient monitoring reimbursement code impact is a major driver for adoption in developed markets. For specific conditions, such as managing chronic obstructive pulmonary disease remotely, integrated platforms are essential.
- Similarly, continuous glucose monitoring data integration strategies are transforming diabetes care. Efforts to improve patient adherence to remote monitoring involve user-friendly interfaces and patient engagement tools. Studies on the cost-effectiveness of hospital-at-home programs show significant savings over traditional inpatient stays. As the population ages, vital signs monitoring for geriatric care becomes more critical.
- Consequently, data security compliance for health apps is a non-negotiable aspect of development. Overall, remote monitoring solutions for diabetes management are among the most mature segments. The impact of 5G on telehealth data speed is enhancing real-time capabilities. The use of bio-integrated sensors for continuous tracking makes data collection passive.
- Providers are working to minimize alarm fatigue with smart telemetry, especially in remote monitoring in ambulatory surgery centers.
- Finally, successful telehealth platform integration with EHR systems and the use of AI-driven analytics for early risk detection are key to realizing the full potential of this market, with some systems showing a threefold increase in early risk identification compared to manual methods.
What are the key market drivers leading to the rise in the adoption of Remote Patient Monitoring Industry?
- The increasing burden of chronic diseases, compounded by significant global demographic shifts, serves as the primary driver for market expansion.
- Market growth is primarily driven by the increasing need for efficient chronic care management and supportive reimbursement policy expansion. The global shift towards value-based healthcare incentives is compelling providers to adopt technologies that improve outcomes while lowering costs.
- Advanced monitoring solutions have demonstrated a 20% reduction in emergency room visits for high-risk patient groups. Technological advancements in miniaturized sensor hardware and low-power communication protocols are making devices more accessible and user-friendly.
- This fosters greater patient engagement and supports decentralized care models.
- Furthermore, the focus on population health management and the need for seamless data synchronization between disparate systems are pushing the demand for interoperable platforms that support proactive and continuous care, enhancing overall health system efficiency.
What are the market trends shaping the Remote Patient Monitoring Industry?
- The integration of generative AI with predictive clinical analytics is emerging as a transformative market trend, reshaping data interpretation and proactive care strategies.
- Key market trends are centered on the integration of intelligent technologies to enhance care delivery and patient outcomes. The adoption of predictive clinical analytics is transforming raw data into actionable insights, with platforms now able to forecast potential health events with up to 75% accuracy.
- This is complemented by the rise of bio-integrated wearables and smart inhaler technology, making data collection seamless and improving adherence. The expansion of hospital-at-home models is a direct response to capacity constraints, supported by robust virtual ward infrastructure and advanced real-time physiological alerts.
- This shift toward proactive medical intervention and automated clinical documentation is streamlining workflows, allowing clinicians to manage larger patient panels more effectively, with some systems reducing administrative tasks by 30%. These advancements underscore a move toward more personalized and preventative healthcare.
What challenges does the Remote Patient Monitoring Industry face during its growth?
- Ensuring the cybersecurity and integrity of sensitive patient health information presents a key challenge that affects industry growth and adoption.
- Key challenges in the market revolve around data security, interoperability, and implementation complexity. The risk of cyber threats necessitates advanced encryption methods and robust patient data privacy frameworks, as a single breach can compromise thousands of patient records.
- A lack of health data interoperability standards creates fragmented data silos, which can increase clinician data fatigue by 40% due to the need to manage multiple, non-integrated systems. Deploying these solutions requires significant upfront investment and specialized expertise for clinical workflow optimization and integration with legacy EHRs.
- Addressing these hurdles through secure cloud infrastructure and industry-wide collaboration on secure data exchange protocols is essential for building trust and achieving scalable, long-term adoption across the healthcare ecosystem.
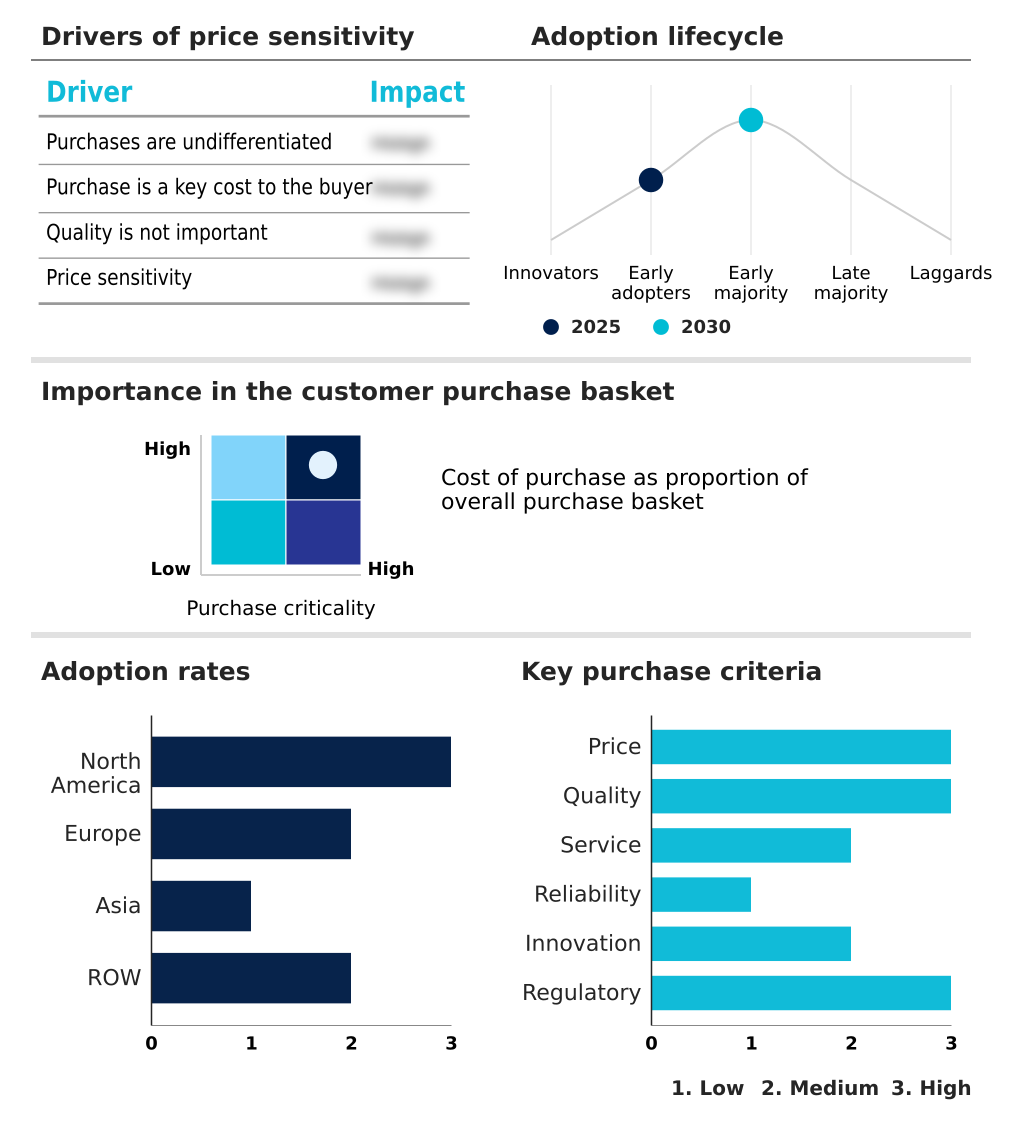
Exclusive Technavio Analysis on Customer Landscape
The remote patient monitoring market forecasting report includes the adoption lifecycle of the market, covering from the innovator’s stage to the laggard’s stage. It focuses on adoption rates in different regions based on penetration. Furthermore, the remote patient monitoring market report also includes key purchase criteria and drivers of price sensitivity to help companies evaluate and develop their market growth analysis strategies.
Customer Landscape of Remote Patient Monitoring Industry
Competitive Landscape
Companies are implementing various strategies, such as strategic alliances, remote patient monitoring market forecast, partnerships, mergers and acquisitions, geographical expansion, and product/service launches, to enhance their presence in the industry.
Abbott Laboratories - Connected diagnostic and implantable devices provide continuous health data, enabling real-time physiological insights for proactive patient care and chronic disease management.
The industry research and growth report includes detailed analyses of the competitive landscape of the market and information about key companies, including:
- Abbott Laboratories
- Advantech Co. Ltd.
- Babyscripts
- Biofourmis Inc.
- Boston Scientific Corp.
- Caretaker Medical NA
- Dragerwerk AG and Co. KGaA
- GE HealthCare Technologies
- Honeywell International Inc.
- Koninklijke Philips N.V.
- Masimo Corp.
- Medtronic Plc
- Napier Healthcare Solutions
- Nihon Kohden Corp.
- OMRON Corp.
- OSI Systems Inc.
- OSP
- Shenzhen Mindray Co. Ltd.
- Siemens Healthineers AG
- Smith and Nephew plc
Qualitative and quantitative analysis of companies has been conducted to help clients understand the wider business environment as well as the strengths and weaknesses of key industry players. Data is qualitatively analyzed to categorize companies as pure play, category-focused, industry-focused, and diversified; it is quantitatively analyzed to categorize companies as dominant, leading, strong, tentative, and weak.
Recent Development and News in Remote patient monitoring market
- In August 2025, the Japanese Ministry of Health, Labour and Welfare mandated the inclusion of remote monitoring for all postoperative home care as a standard reimbursable service.
- In August 2025, the International Standards Organization issued a formal directive requiring all new remote monitoring hardware to support a universal data exchange format to improve EHR integration.
- In November 2025, Siemens Healthineers launched the Guardian-AI platform, which utilizes large language models to provide real-time clinical decision support for virtual wards.
- In May 2025, the World Health Organization published its Global Chronic Care Strategic Framework, recommending the integration of remote digital tools for elderly care in middle-income nations.
Dive into Technavio’s robust research methodology, blending expert interviews, extensive data synthesis, and validated models for unparalleled Remote Patient Monitoring Market insights. See full methodology.
| Market Scope | |
|---|---|
| Page number | 297 |
| Base year | 2025 |
| Historic period | 2020-2024 |
| Forecast period | 2026-2030 |
| Growth momentum & CAGR | Accelerate at a CAGR of 20.4% |
| Market growth 2026-2030 | USD 2767.5 million |
| Market structure | Fragmented |
| YoY growth 2025-2026(%) | 18.9% |
| Key countries | US, Canada, Mexico, Germany, UK, France, Italy, Spain, The Netherlands, China, India, Japan, South Korea, Indonesia, Thailand, Saudi Arabia, UAE, Brazil, Turkey, Argentina, Colombia, South Africa and Israel |
| Competitive landscape | Leading Companies, Market Positioning of Companies, Competitive Strategies, and Industry Risks |
Research Analyst Overview
- The remote patient monitoring market is defined by a rapid convergence of advanced hardware and intelligent software, fundamentally shifting care delivery from reactive to proactive models. This landscape is characterized by the use of wearable biosensors, implantable cardiac monitors, and devices for continuous glucose monitoring (cgm), all dependent on reliable physiological data transmission.
- A key boardroom consideration is navigating regulatory compliance management, as digital health application (diga) and patient data privacy frameworks become more stringent. The adoption of hospital-at-home models and virtual ward infrastructure is accelerating, powered by telehealth communication platforms and AI-powered diagnostic platforms that offer real-time clinical decision support.
- Innovations like the bio-conductive smart thread, sub-dermal patches, and cuffless blood pressure monitoring are enhancing patient comfort and adherence. The successful electronic health record (EHR) integration of data from multi-parameter monitoring systems is critical for workflow efficiency, with some health systems achieving a 40% reduction in manual data entry tasks.
- Technologies such as smart telemetry systems, insertable loop recorders, and closed-loop therapeutic systems are enabling sophisticated chronic disease management software and post-surgical recovery tracking. This requires advanced encryption methods and secure data exchange protocols to ensure clinical-grade sensor accuracy and prevent post-operative complication prevention.
- Furthermore, optimizing ambulatory surgical center (ASC) workflows through mobile health (mhealth) integration and biometric data analysis is a key focus for improving cardiac arrhythmia detection and overall patient outcomes through advanced patient engagement platforms and cloud-based data storage.
What are the Key Data Covered in this Remote Patient Monitoring Market Research and Growth Report?
-
What is the expected growth of the Remote Patient Monitoring Market between 2026 and 2030?
-
USD 2.77 billion, at a CAGR of 20.4%
-
-
What segmentation does the market report cover?
-
The report is segmented by Product (Vital signs, and Implantable), End-user (Hospitals, ASCs, and Home care), Application (Cardiology, Diabetes management, and Respiratory and pulmonary care) and Geography (North America, Europe, Asia, Rest of World (ROW))
-
-
Which regions are analyzed in the report?
-
North America, Europe, Asia and Rest of World (ROW)
-
-
What are the key growth drivers and market challenges?
-
Rising burden of chronic diseases and global demographic shifts, Cybersecurity and integrity of patient health information
-
-
Who are the major players in the Remote Patient Monitoring Market?
-
Abbott Laboratories, Advantech Co. Ltd., Babyscripts, Biofourmis Inc., Boston Scientific Corp., Caretaker Medical NA, Dragerwerk AG and Co. KGaA, GE HealthCare Technologies, Honeywell International Inc., Koninklijke Philips N.V., Masimo Corp., Medtronic Plc, Napier Healthcare Solutions, Nihon Kohden Corp., OMRON Corp., OSI Systems Inc., OSP, Shenzhen Mindray Co. Ltd., Siemens Healthineers AG and Smith and Nephew plc
-
Market Research Insights
- The dynamics of the remote patient monitoring market are increasingly shaped by a strategic shift toward decentralized care models and data-driven treatment plans. The adoption of these technologies has led to a 25% reduction in hospital readmissions for certain chronic conditions. Health systems implementing virtual care delivery models report up to a 30% improvement in clinical workflow optimization.
- This transition is enabled by advancements in patient-centric care platforms and connected diagnostic devices that provide predictive health insights. The emphasis is on proactive medical intervention rather than reactive treatment.
- This focus is critical as providers aim to improve outcomes while managing costs in an evolving healthcare landscape, with successful implementations showing a clear return on investment through enhanced operational efficiencies and better population health management.
We can help! Our analysts can customize this remote patient monitoring market research report to meet your requirements.
 RIA -
RIA - 
