Resilient Vinyl Flooring Market Size 2025-2029
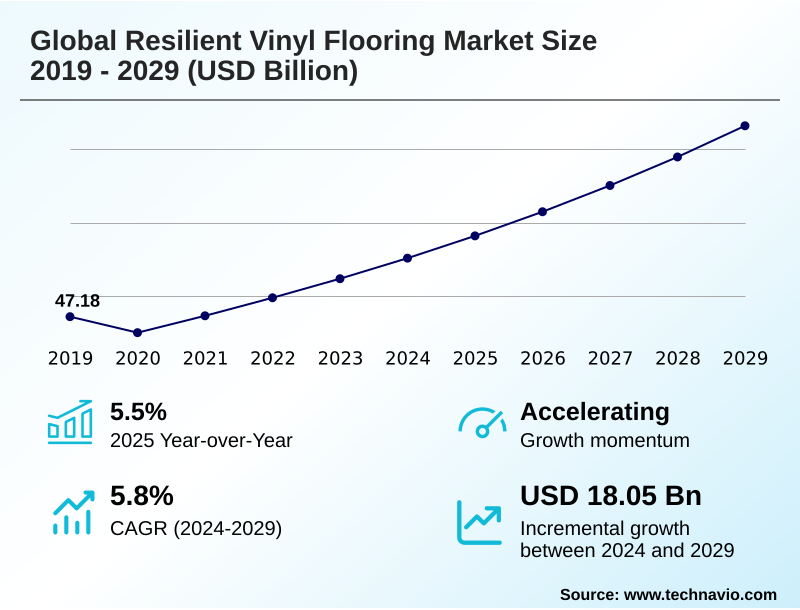
The resilient vinyl flooring market size is valued to increase by USD 18.05 billion, at a CAGR of 5.8% from 2024 to 2029. Increase in building and construction activities will drive the resilient vinyl flooring market.
Major Market Trends & Insights
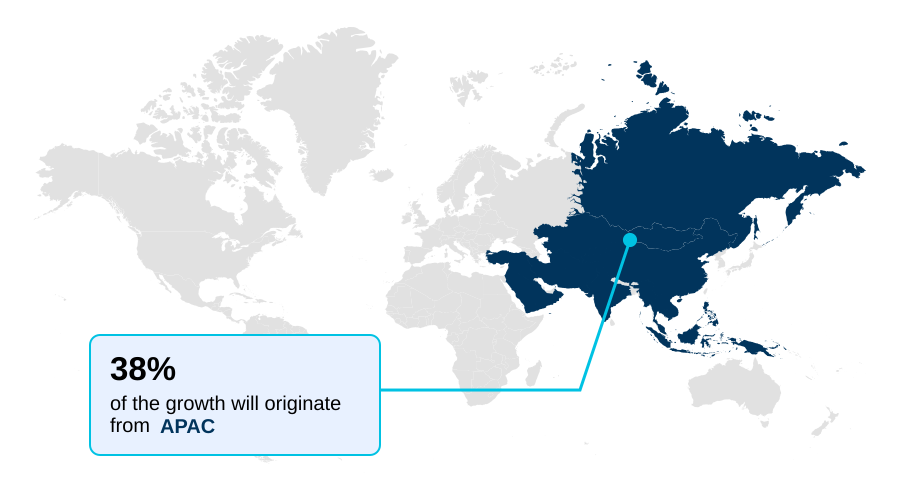
- APAC dominated the market and accounted for a 38.1% growth during the forecast period.
- By Type - Luxury vinyl tile segment was valued at USD 23.65 billion in 2023
- By End-user - Residential segment accounted for the largest market revenue share in 2023
Market Size & Forecast
- Market Opportunities: USD 26.04 billion
- Market Future Opportunities: USD 18.05 billion
- CAGR from 2024 to 2029 : 5.8%
Market Summary
- The resilient vinyl flooring market is experiencing significant evolution, driven by advancements in material science and a growing emphasis on performance and sustainability. Core to this expansion is the development of products like stone polymer composite (spc) and wood polymer composite (wpc) flooring, which offer enhanced dimensional stability and water resistance compared to traditional materials.
- This makes them ideal for a wide range of applications, from high-traffic commercial spaces to moisture-prone residential areas. A key trend shaping the industry is the integration of smart technologies and sustainable practices, with manufacturers focusing on low-voc formulations and recycled content to meet stringent indoor air quality standards.
- For instance, a large hospitality chain might specify greenguard gold certified flooring with antimicrobial properties across its properties to enhance guest safety and simplify maintenance protocols, illustrating how product attributes directly address operational business needs.
- However, the market is not without challenges; issues surrounding end-of-life management and the need for skilled installation to prevent costly failures persist, pushing companies toward developing more robust closed-loop recycling programs and user-friendly installation systems.
What will be the Size of the Resilient Vinyl Flooring Market during the forecast period?
Get Key Insights on Market Forecast (PDF) Get Free Sample
How is the Resilient Vinyl Flooring Market Segmented?
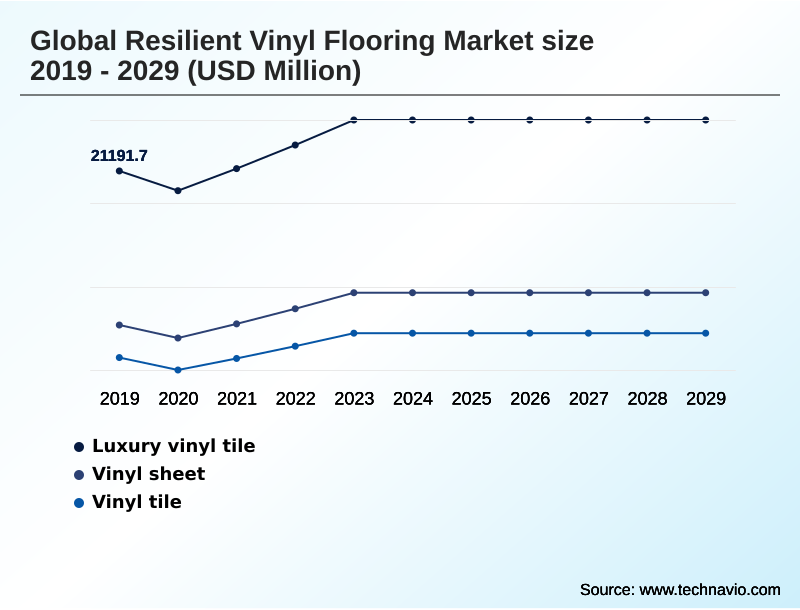
The resilient vinyl flooring industry research report provides comprehensive data (region-wise segment analysis), with forecasts and estimates in "USD million" for the period 2025-2029, as well as historical data from 2019-2023 for the following segments.
- Type
- Luxury vinyl tile
- Vinyl sheet
- Vinyl tile
- End-user
- Residential
- Commercial
- Installation type
- Glue-down
- Click-lock
- Loose lay
- Peel-and-stick
- Geography
- APAC
- China
- Japan
- India
- North America
- US
- Canada
- Europe
- Germany
- UK
- France
- Middle East and Africa
- Saudi Arabia
- UAE
- South America
- Brazil
- Argentina
- Rest of World (ROW)
- APAC
By Type Insights
The luxury vinyl tile segment is estimated to witness significant growth during the forecast period.
The luxury vinyl tile (LVT) segment continues its expansion, driven by its ability to meet diverse commercial flooring specifications and capitalize on residential renovation trends.
Innovations in manufacturing allow for a wide range of decorative vinyl flooring options, including realistic wood-look vinyl with an embossed-in-register texture that closely mimics natural materials.
The use of high-quality polyvinyl chloride (pvc) resin ensures high-traffic durability, making it a superior choice for environments with heavy commercial traffic. Unlike commercial-grade vinyl sheet, its modular vinyl tile design simplifies replacement and enables diy-friendly installation.
A robust, scratch-resistant wear layer contributes significantly to its longevity, with proper maintenance leading to a lifecycle cost reduction of up to 15% compared to less resilient alternatives.
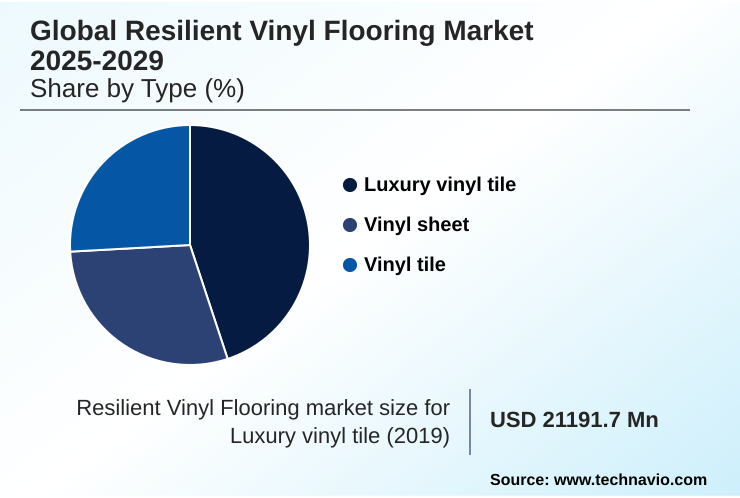
The Luxury vinyl tile segment was valued at USD 23.65 billion in 2023 and showed a gradual increase during the forecast period.
Regional Analysis
APAC is estimated to contribute 38.1% to the growth of the global market during the forecast period.Technavio’s analysts have elaborately explained the regional trends and drivers that shape the market during the forecast period.
See How Resilient Vinyl Flooring Market Demand is Rising in APAC Get Free Sample
The market's geographic landscape is characterized by varied regional dynamics and adoption rates.
In APAC, which accounts for over 38% of incremental growth, rapid urbanization fuels demand for residential vinyl planks and materials suited for heavy commercial traffic in new infrastructure.
North America shows a strong preference for rigid core vinyl flooring with realistic wood-look vinyl aesthetics, often specified with greenguard gold certification for institutional building projects.
In Europe, a focus on sustainability drives recycled content integration and demand for products with floorscore certification.
Installation methods also vary regionally, with glue-down adhesive bonding prevalent in high-traffic commercial zones, while loose-lay vinyl planks gain traction in markets prioritizing flexibility.
The overall market shows a steady year-over-year expansion of 5.5%, reflecting a global shift towards these durable and versatile flooring solutions.
Market Dynamics
Our researchers analyzed the data with 2024 as the base year, along with the key drivers, trends, and challenges. A holistic analysis of drivers will help companies refine their marketing strategies to gain a competitive advantage.
- Navigating the resilient flooring market requires a deep understanding of product specifics and application requirements. Decision-makers often start by comparing lvt vs wpc flooring performance, where the benefits of spc rigid core flooring, such as superior dent resistance, become a key differentiator.
- For specialized areas, selecting waterproof lvt for commercial kitchens is critical, which necessitates proper subfloor preparation and often a low-voc adhesive for vinyl flooring to meet health standards. The choice of installation method, whether glue-down vs floating vinyl planks or easy-to-use peel-and-stick vinyl tiles, directly impacts project timelines and costs.
- Choosing the best underlayment for click-lock vinyl is essential for achieving desired acoustic outcomes, making soundproof vinyl flooring for apartments a viable solution. Performance attributes are paramount; the scratch resistance of luxury vinyl tile and ensuring slip resistant vinyl for healthcare environments are non-negotiable.
- For long-term value, understanding the commercial vinyl flooring cleaning guide for maintaining high-traffic commercial vinyl floors is vital. Sustainability is also a major consideration, with growing interest in the benefits of using phthalate-free vinyl and options for sustainable and recyclable vinyl. These choices influence the ability to achieve floorscore certification for products.
- Finally, technical compatibility, such as using vinyl flooring for radiant heat systems, and understanding the impact of subfloor on vinyl installation are crucial for success, as is choosing the right wear layer for residential vinyl to ensure longevity.
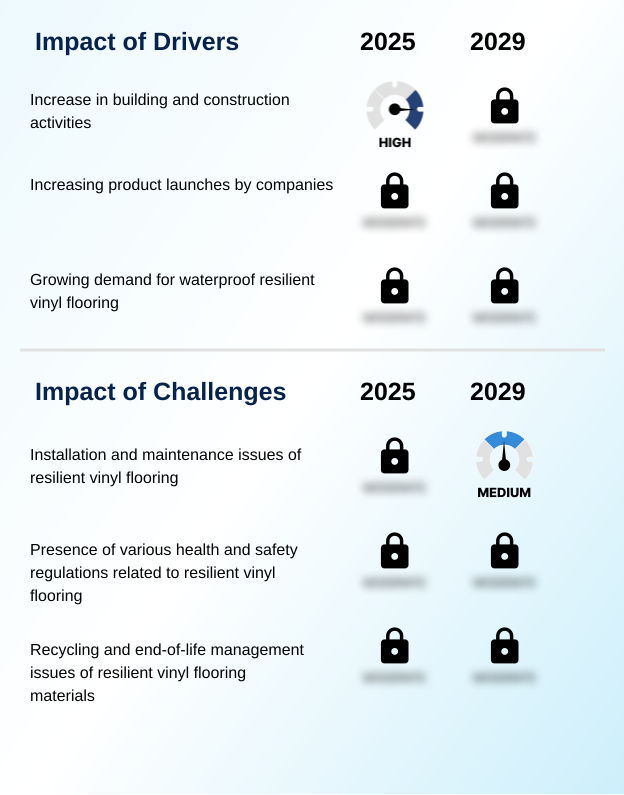
What are the key market drivers leading to the rise in the adoption of Resilient Vinyl Flooring Industry?
- The primary driver fueling market growth is the sustained increase in global building and construction activities across residential and commercial sectors.
- Growth is significantly driven by demand for waterproof flooring options like waterproof vinyl planks (wvp) and stone polymer composite (spc) flooring, which offer superior dimensional stability and heavy foot traffic resistance.
- These products are critical for meeting stringent healthcare flooring standards and hospitality flooring requirements. The boom in residential renovation trends, along with large-scale institutional building projects and educational facility flooring upgrades, provides consistent demand.
- Products with effective sound absorption properties are specified more frequently, improving indoor acoustics by up to 25%.
- Furthermore, innovations such as peel-and-stick backing simplify installations, broadening the appeal of these materials and making them a staple in environments that demand both high performance and aesthetic flexibility, aligning with modern commercial flooring specifications.
What are the market trends shaping the Resilient Vinyl Flooring Industry?
- The emergence of hybrid resilient vinyl flooring, which combines multiple materials to create innovative and balanced solutions, is a key market trend. These products cater to diverse consumer preferences by enhancing durability, aesthetics, and overall performance.
- The market is increasingly shaped by the emergence of hybrid resilient flooring, which combines materials like wood polymer composite (wpc) to create sustainable flooring solutions. This trend is coupled with advancements in smart flooring technology, including options with integrated led lighting, which are gaining traction in commercial design. Innovations in surface treatment technology and advanced protective coating enhance durability.
- Moreover, the prevalence of the click-lock installation system has made floating floor system products more accessible for diy-friendly installation, reducing professional labor costs by up to 40%.
- Tools leveraging augmented reality visualization are also transforming the selection process, allowing consumers to preview custom design flooring in their space, improving purchase confidence by over 60% and solidifying the move toward more technologically integrated, eco-friendly building materials.
What challenges does the Resilient Vinyl Flooring Industry face during its growth?
- A significant challenge impacting market expansion relates to installation complexities and maintenance issues inherent to resilient vinyl flooring.
- Key market challenges are centered on technical and environmental compliance. Adherence to strict indoor air quality (iaq) standards requires manufacturers to invest in low-voc formulation and the use of phthalate-free plasticizers, which can increase production costs by 10-15%.
- Proper installation remains a hurdle, with failures often linked to inadequate subfloor preparation guidelines and managing the moisture vapor emission rate, necessitating a subfloor moisture barrier. Following correct flooring maintenance protocols is crucial for preserving the high-performance wear layer in light commercial applications.
- Furthermore, the industry faces pressure regarding end-of-life management, with developing a viable closed-loop recycling program being a complex logistical challenge. Demands for transparency through material ingredient disclosure and rigorous chemical emissions testing add another layer of operational complexity.
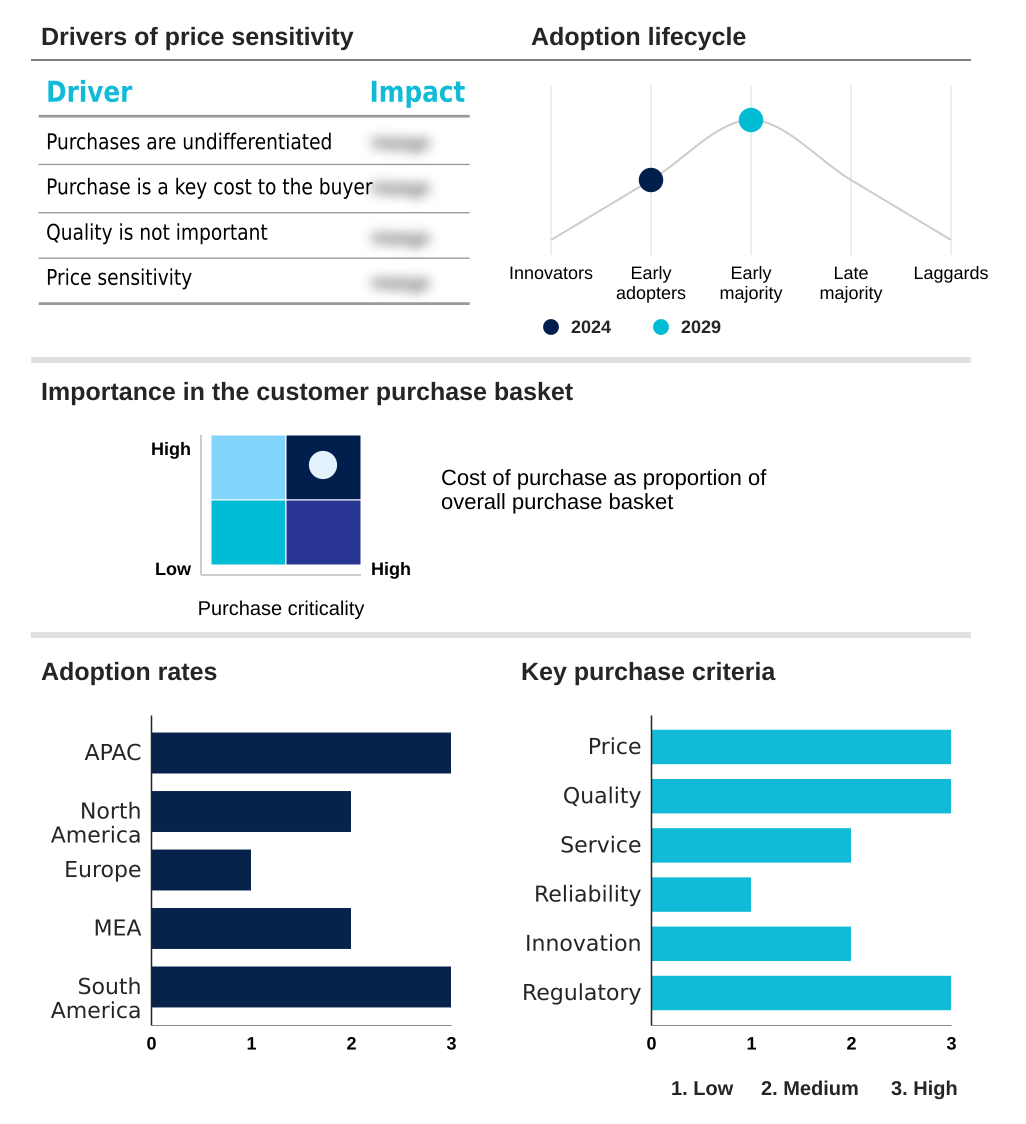
Exclusive Technavio Analysis on Customer Landscape
The resilient vinyl flooring market forecasting report includes the adoption lifecycle of the market, covering from the innovator’s stage to the laggard’s stage. It focuses on adoption rates in different regions based on penetration. Furthermore, the resilient vinyl flooring market report also includes key purchase criteria and drivers of price sensitivity to help companies evaluate and develop their market growth analysis strategies.
Customer Landscape of Resilient Vinyl Flooring Industry
Competitive Landscape
Companies are implementing various strategies, such as strategic alliances, resilient vinyl flooring market forecast, partnerships, mergers and acquisitions, geographical expansion, and product/service launches, to enhance their presence in the industry.
AAMTAC Co. Ltd. - The vendor provides high-quality resilient flooring systems, including homogeneous vinyl and entrance solutions, engineered for demanding commercial applications and innovative design.
The industry research and growth report includes detailed analyses of the competitive landscape of the market and information about key companies, including:
- AAMTAC Co. Ltd.
- AHF LLC.
- American Biltrite Inc.
- AWI Licensing LLC
- Beaulieu International Group
- Congoleum Corp.
- Forbo Management SA
- Gerflor Group
- Interface Inc.
- IVC Group
- Karndean
- LX Hausys Ltd
- Mannington Mills Inc.
- Metroflor Corp
- Milliken and Co.
- Mohawk Industries Inc.
- Novalis Global Flooring GmbH
- Parterre Flooring and Surface Systems LLC
- Responsive Industries Ltd.
- Roppe Corp.
- Shaw Industries Group Inc.
- Tarkett Group
Qualitative and quantitative analysis of companies has been conducted to help clients understand the wider business environment as well as the strengths and weaknesses of key industry players. Data is qualitatively analyzed to categorize companies as pure play, category-focused, industry-focused, and diversified; it is quantitatively analyzed to categorize companies as dominant, leading, strong, tentative, and weak.
Recent Development and News in Resilient vinyl flooring market
- In September 2024, Interface Inc. launched its Northern Grain series of luxury vinyl tiles, featuring 39% pre-consumer recycled content and achieving carbon neutrality across its lifecycle through the company's verified reclamation program.
- In November 2024, REGUPOL Germany GmbH and Co. KG introduced regupol upscale, a new collection of recycled rubber tiles and planks designed as a sustainable alternative to traditional LVT for commercial environments.
- In January 2025, AHF Products, through its Parterre Flooring brand, unveiled the unfazed luxury vinyl flooring line, which incorporates a proprietary core for enhanced indent resistance and an exclusive coating for superior durability.
- In April 2025, Tarkett expanded its portfolio with the collaborative collection, featuring soft surface and LVT flooring designs with an emphasis on recycled materials and enhanced acoustic performance for modern workplace environments.
Dive into Technavio’s robust research methodology, blending expert interviews, extensive data synthesis, and validated models for unparalleled Resilient Vinyl Flooring Market insights. See full methodology.
| Market Scope | |
|---|---|
| Page number | 265 |
| Base year | 2024 |
| Historic period | 2019-2023 |
| Forecast period | 2025-2029 |
| Growth momentum & CAGR | Accelerate at a CAGR of 5.8% |
| Market growth 2025-2029 | USD 18047.1 million |
| Market structure | Fragmented |
| YoY growth 2024-2025(%) | 5.5% |
| Key countries | China, Japan, India, South Korea, Australia, US, Canada, Germany, UK, France, Saudi Arabia, UAE, Brazil and Argentina |
| Competitive landscape | Leading Companies, Market Positioning of Companies, Competitive Strategies, and Industry Risks |
Research Analyst Overview
- The resilient vinyl flooring market is defined by a convergence of material innovation and application-specific demands. Core product categories like luxury vinyl tile (lvt), commercial-grade vinyl sheet, and modular vinyl tile design are evolving with technologies such as stone polymer composite (spc) and wood polymer composite (wpc).
- This has led to offerings like waterproof vinyl planks (wvp) and residential vinyl planks that provide superior dimensional stability and heavy foot traffic resistance. Key to this performance is the integration of a scratch-resistant wear layer and a durable polyurethane (pu) coating over the polyvinyl chloride (pvc) resin base.
- Installation methods are diversifying, from traditional glue-down adhesive bonding to user-friendly click-lock installation system, floating floor system, peel-and-stick backing, and loose-lay vinyl planks.
- A major focus for manufacturers is achieving functional excellence through enhanced sound absorption properties, thermal insulation value, and a high slip resistance rating, often verified through chemical emissions testing and resulting in floorscore certification or greenguard gold certification. This addresses concerns related to the moisture vapor emission rate, for which a subfloor moisture barrier is essential.
- The push for sustainability is evident in the use of phthalate-free plasticizers, increased recycled content integration, and the development of closed-loop recycling programs to manage end-of-life. These advancements, including realistic embossed-in-register texture and low-voc formulation with antimicrobial surface treatment, are critical as improper subfloor preparation is linked to over 40% of flooring failures.
What are the Key Data Covered in this Resilient Vinyl Flooring Market Research and Growth Report?
-
What is the expected growth of the Resilient Vinyl Flooring Market between 2025 and 2029?
-
USD 18.05 billion, at a CAGR of 5.8%
-
-
What segmentation does the market report cover?
-
The report is segmented by Type (Luxury vinyl tile, Vinyl sheet, Vinyl tile), End-user (Residential, Commercial), Installation Type (Glue-down, Click-lock, Loose lay, Peel-and-stick) and Geography (APAC, North America, Europe, Middle East and Africa, South America)
-
-
Which regions are analyzed in the report?
-
APAC, North America, Europe, Middle East and Africa and South America
-
-
What are the key growth drivers and market challenges?
-
Increase in building and construction activities, Installation and maintenance issues of resilient vinyl flooring
-
-
Who are the major players in the Resilient Vinyl Flooring Market?
-
AAMTAC Co. Ltd., AHF LLC., American Biltrite Inc., AWI Licensing LLC, Beaulieu International Group, Congoleum Corp., Forbo Management SA, Gerflor Group, Interface Inc., IVC Group, Karndean, LX Hausys Ltd, Mannington Mills Inc., Metroflor Corp, Milliken and Co., Mohawk Industries Inc., Novalis Global Flooring GmbH, Parterre Flooring and Surface Systems LLC, Responsive Industries Ltd., Roppe Corp., Shaw Industries Group Inc. and Tarkett Group
-
Market Research Insights
- The market dynamics are increasingly influenced by the demand for specialized, high-performance products. The adoption of sustainable flooring solutions and eco-friendly building materials is a primary factor, with facilities reporting over 75% reductions in VOCs by adhering to stringent indoor air quality (iaq) standards.
- In commercial flooring specifications, particularly for healthcare flooring standards, there is a strong emphasis on products that meet rigorous hygiene and durability criteria. The shift towards diy-friendly installation methods for residential renovation trends has also been significant, reducing project timelines by up to 50% compared to traditional techniques.
- Furthermore, in hospitality flooring requirements, custom design flooring and decorative vinyl flooring are crucial for brand differentiation, leading to a greater focus on innovative surface treatment technology and realistic wood-look vinyl options.
We can help! Our analysts can customize this resilient vinyl flooring market research report to meet your requirements.
 RIA -
RIA - 
