Reusable Launch Vehicles Market Size 2024-2028
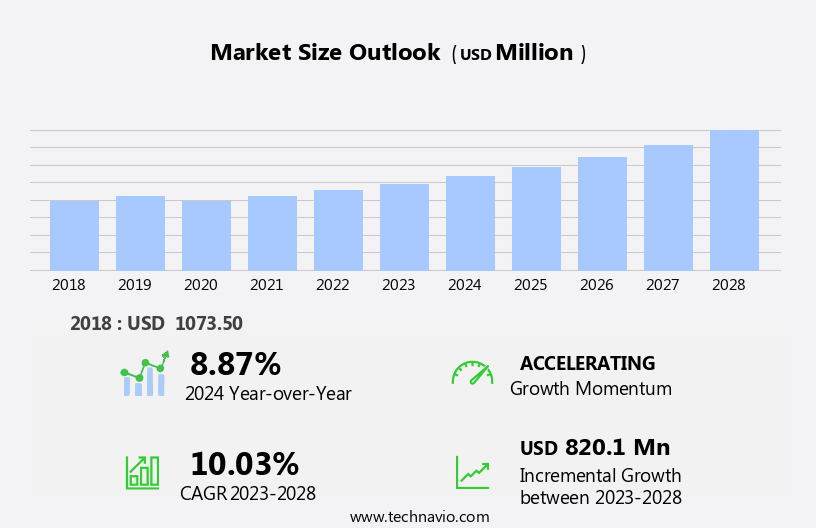
The reusable launch vehicles market size is forecast to increase by USD 820.1 million at a CAGR of 10.03% between 2023 and 2028.
- The reusable launch vehicles (RLV) market is experiencing significant growth due to the adoption of concepts for space habitat and the deployment of reusable upper stages. This trend is driven by the increasing demand for cost-effective space travel, including space tourism and satellite deployment.
- However, the high costs of development remain a challenge for market growth. In the context of space exploration, RLVs offer numerous advantages, such as insulation and fuel tank reusability, which are crucial for extended space missions. Furthermore, the potential for space mining adds to the market's appeal, as it presents an opportunity for sustainable resource extraction in space.
What will be the Size of the Reusable Launch Vehicles Market During the Forecast Period?
- The reusable launch vehicle (RLV) market is experiencing significant growth and innovation In the global space industry. RLVs offer the potential for cost savings and increased access to space by enabling the reuse of launch vehicles for multiple missions. This market encompasses various players, including space agencies and private entities, developing RLV technologies for launching satellites and space missions. Applications for RLVs span across various sectors, including communication, navigation, satellite-based earth observation, scientific research, defense, and military surveillance. Notable developments include the use of RLVs for deploying Starlink internet satellites, which aim to provide global broadband coverage. Additionally, advancements in launch vehicle design, materials, and propulsion systems, such as Hall effect thrusters, are driving market expansion.
- The RLV market is expected to grow substantially due to the increasing demand for low Earth orbit satellite deployments. Companies are actively contributing to the development and implementation of RLVs. The Artemis Accords, a multilateral agreement between space-faring nations, further emphasize the importance of collaboration and innovation in space exploration. Overall, the RLV market represents a dynamic and evolving sector withIn the broader space technology landscape.
How is this Reusable Launch Vehicles Industry segmented and which is the largest segment?
The reusable launch vehicles industry research report provides comprehensive data (region-wise segment analysis), with forecasts and estimates in "USD million" for the period 2024-2028, as well as historical data from 2018-2022 for the following segments.
- Type
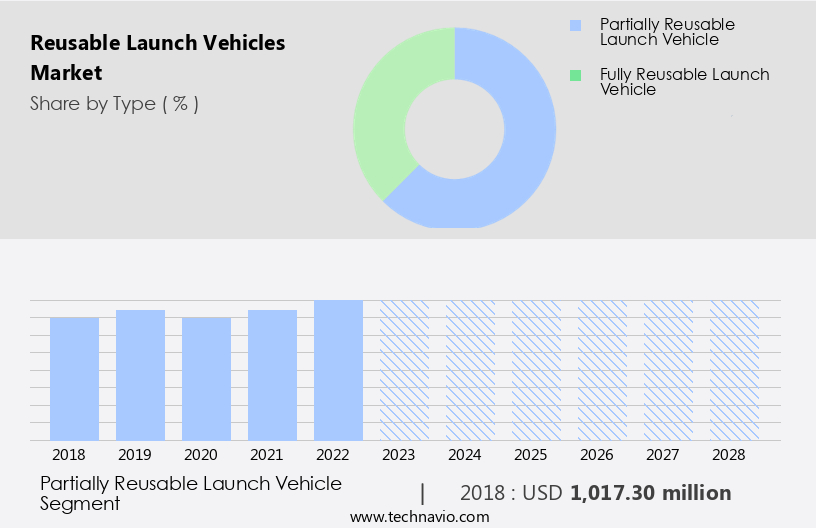
- Partially reusable launch vehicle
- Fully reusable launch vehicle
- Geography
- North America
- US
- Europe
- Germany
- France
- APAC
- China
- India
- South America
- Middle East and Africa
- North America
By Type Insights
- The partially reusable launch vehicle segment is estimated to witness significant growth during the forecast period.
Reusable launch vehicles (RLVs) represent a significant advancement in space technology, enabling the launch of satellites at reduced costs for various applications, including satellite networks, military surveillance, communication, navigation, Earth observation, scientific research, and space exploration. The space industry is witnessing an increasing demand for RLVs due to the growing need to minimize launch expenses. Manufacturers are focusing on developing and assembling RLVs with a minimum of 50% reusable parts, such as Exotrail's Reusable Launcher Using Additively Manufactured Engines (RLUAME), Isar Aerospace's Synergetic Air-Breathing Rocket Engine (SABRE), Blue Origin's New Shepard, and SpaceX's Starship. This trend is expected to continue, as RLVs offer potential benefits to both commercial and defense sectors, as well as space agencies and private companies.
Key players In the RLV market include SpaceX, Blue Origin, and several other OEMs. The development and production of RLVs involve significant initial investment and development costs, but the long-term cost savings make it a worthwhile investment. RLVs are designed using advanced materials and propulsion systems, and their usage contributes to the growth of space technology and exploration, including space mining, interplanetary exploration, and Sun-synchronous orbit missions. The Aeronautical Test Range, DRDO, and other space agencies and private companies are collaborating on RLV projects, such as India's Reusable Launch Vehicle-Technological Demonstrator (RLV-TD) and SpaceX's Starship. RLVs are also expected to play a crucial role in the development of the Tiangong space station and other space missions.
Get a glance at the Reusable Launch Vehicles Industry report of share of various segments Request Free Sample
The Partially reusable launch vehicle segment was valued at USD 1.02 billion in 2018 and showed a gradual increase during the forecast period.
Regional Analysis
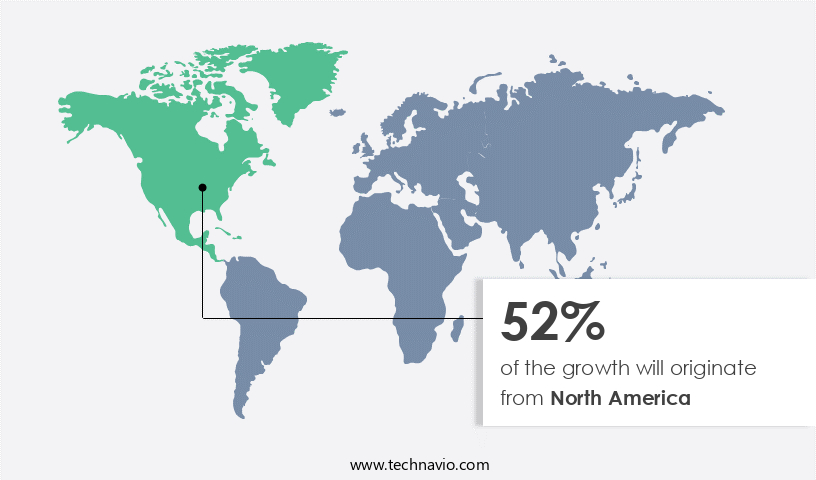
- North America is estimated to contribute 52% to the growth of the global market during the forecast period.
Technavio's analysts have elaborately explained the regional trends and drivers that shape the market during the forecast period.
For more insights on the market share of various regions, Request Free Sample
The Reusable Launch Vehicle (RLV) market is a significant segment of the space industry, particularly in North America where the US, Canada, and Mexico lead the global demand for satellite systems. The US government's civilian space sector, headed by NASA, focuses on aeronautics research, exploration systems, science, and space operations. Notable developments include NASA and SpaceX's reusable satellite launch vehicles, which support multiple missions and cater to the increasing demand for small satellites. Commercial applications span satellite networks for internet services like Starlink, defense, military surveillance, communication, navigation, Earth observation, scientific research, and space exploration. Key players include SpaceX's Starship, Exotrail, Isar Aerospace, Blue Origin, and Galactic Energy.
OEMs invest heavily in RLV design, materials, and propulsion systems, driving market growth. Environmental impact is a concern, but advancements in technology minimize this. The US market's consistent growth is attributed to its leading role in commercial satellite and launch services.
Market Dynamics
Our researchers analyzed the data with 2023 as the base year, along with the key drivers, trends, and challenges. A holistic analysis of drivers will help companies refine their marketing strategies to gain a competitive advantage.
What are the key market drivers leading to the rise In the adoption of Reusable Launch Vehicles Industry?
Adoption of deep space habitat concepts is the key driver of the market.
- Reusable Launch Vehicles (RLVs) are revolutionizing the space industry with their potential to significantly reduce satellite launching costs. Companies like SpaceX, Blue Origin, Isar Aerospace, and Exotrail are leading this innovation. RLVs are essential for deploying Starlink internet satellites and other satellite networks in Low Earth Orbit (LEO) for commercial and defense applications, including communication, navigation, Earth observation, scientific research, military surveillance, and space exploration. The development of long-duration space habitats near the moon is expected to fuel the growth of the RLV market. NASA, in collaboration with six US-based partners, is working on this concept to create astronaut habitats for independent living and research.
- This will act as a stepping stone for interplanetary exploration and space mining. RLV design involves advanced materials and propulsion systems. Key players are investing heavily in R&D to improve efficiency and reduce costs. For instance, SpaceX's Starship and Blue Origin's New Shepard are advanced RLVs designed for space tourism, scientific discovery, and space missions. Galactic Energy's RLV-TD and DRDO's Maia are other notable initiatives. The space technology sector is undergoing a transformation with the advent of RLVs. The environmental impact of these vehicles is a concern, but ongoing research and technological advancements are addressing these issues. The Aeronautical Test Range is a significant contributor to the development and testing of RLVs.
- In conclusion, the RLV market is poised for significant growth due to its role in deploying satellite networks, supporting space missions, and enabling deep space habitation concepts. The collaboration between space agencies and private companies is driving innovation and reducing costs. Despite initial investment and development costs, the long-term benefits far outweigh the challenges.
What are the market trends shaping the Reusable Launch Vehicles Industry?
Design and deployment of reusable upper stages is the upcoming market trend.
- Reusable Launch Vehicles (RLVs) have transformed the space industry by moving beyond the conventional method of bringing the shuttle back to introducing a system that remains in orbit and is reusable. United Launch Alliance (ULA), a collaboration between Boeing and Lockheed Martin, pioneered this innovation with the Advanced Cryogenic Evolved Stage (ACES). This reusable system, resembling a small fuel tank with four rocket motors at one end, offers effective fuel storage in space through specialized insulation and a simplified electrical system. This design enables weight reduction and the capability to restart and refuel in space, allowing the stage to wait in orbit for extended periods before serving its next satellite cargo.
- The RLV market is witnessing significant growth due to the increasing demand for satellite networks in commercial, defense, military surveillance, communication, navigation, Earth observation, scientific research, and space exploration applications. Key players are investing heavily In the development of RLVs, focusing on materials, propulsion systems, and launch vehicle design to reduce costs and expand the scope of space missions. The market also includes initiatives by space agencies and private companies to launch satellite-based projects, such as SpaceX's Starlink internet satellites, the Tiangong space station, and India's RLV-TD.
- The environmental impact of RLVs is a significant concern, with ongoing research on reducing their carbon footprint and ensuring sustainable space exploration. Other emerging applications of RLVs include space mining, interplanetary exploration, and sun-synchronous orbit missions. Overall, the RLV market is poised for substantial growth, driven by the increasing demand for space technology and the potential for scientific discovery and space tourism.
What challenges does the Reusable Launch Vehicles Industry face during its growth?
High costs of development is a key challenge affecting the industry growth.
- Reusable Launch Vehicles (RLVs) have been a topic of interest In the space industry for nearly four decades, with the potential to significantly reduce the time and cost associated with manufacturing a new vehicle for each satellite launch. Several countries have explored the usage of RLVs, with NASA being the only one to put the concept into practical use through its Space Shuttle program from 1981 to 2011. The program, which flew 135 missions, had a total budget of over USD209 billion, with each mission costing approximately USD1.5 billion. Despite its notable achievements, the Space Shuttle program was expensive, highlighting the high initial costs of RLV design and development.
- Today, private companies such as SpaceX, Blue Origin, Isar Aerospace, and Exotrail, among others, are investing In the development of RLVs for commercial and defense applications, including satellite networks, military surveillance, communication, navigation, Earth observation, scientific research, and space exploration. These RLVs are being designed with advanced materials and propulsion systems to support various missions, from low Earth orbit to sun-synchronous orbit and interplanetary exploration. Companies are also exploring the use of RLVs for space mining, space tourism, and the Tiangong space station. The RLV market is expected to grow as these vehicles become increasingly crucial for space missions and space technology advancements.
Exclusive Customer Landscape
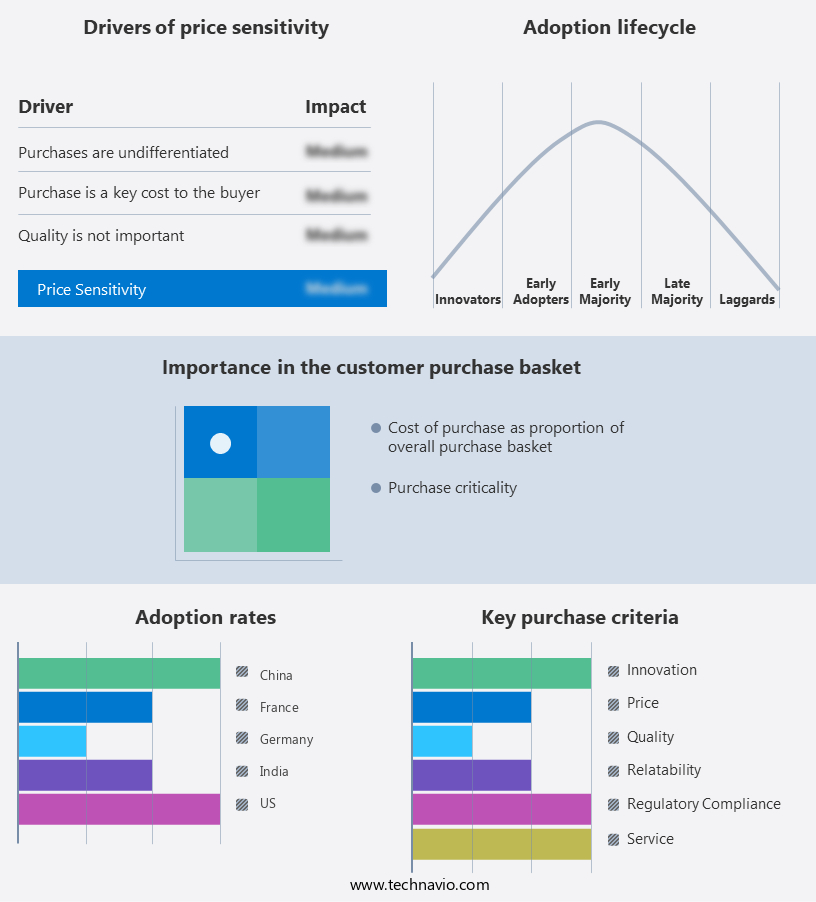
The reusable launch vehicles market forecasting report includes the adoption lifecycle of the market, covering from the innovator's stage to the laggard's stage. It focuses on adoption rates in different regions based on penetration. Furthermore, the reusable launch vehicles market report also includes key purchase criteria and drivers of price sensitivity to help companies evaluate and develop their market growth analysis strategies.
Customer Landscape
Key Companies & Market Insights
Companies are implementing various strategies, such as strategic alliances, reusable launch vehicles market forecast, partnerships, mergers and acquisitions, geographical expansion, and product/service launches, to enhance their presence In the industry.
The industry research and growth report includes detailed analyses of the competitive landscape of the market and information about key companies, including:
- Airbus SE
- Beijing Interstellar Glory Space Technology Co. Ltd.
- Blue Origin Enterprises LP
- China Aerospace Science and Technology Corp.
- European Space Agency
- exos Aerospace Systems and Technologies Inc.
- Firefly Aerospace Inc.
- Indian Space Research Organisation
- Masten Space Systems
- NASA
- Orbex
- Payload Aerospace SL
- Relativity Space Inc.
- Rocket Lab USA Inc.
- Space Exploration Technologies Corp.
- The Boeing Co.
- UP Aerospace Inc.
Qualitative and quantitative analysis of companies has been conducted to help clients understand the wider business environment as well as the strengths and weaknesses of key industry players. Data is qualitatively analyzed to categorize companies as pure play, category-focused, industry-focused, and diversified; it is quantitatively analyzed to categorize companies as dominant, leading, strong, tentative, and weak.
Research Analyst Overview
Reusable launch vehicles (RLVs) have emerged as a game-changer In the space industry, offering significant cost savings and increased accessibility to space for various applications. These vehicles, which can be used multiple times, are gaining traction among both commercial and government entities in low Earth orbit (LEO). RLVs have found particular interest In the deployment of satellite networks. For instance, Starlink, a leading satellite constellation, is utilizing RLVs to launch its internet satellites, aiming to provide global broadband coverage. This application is just one of many In the communication, navigation, earth observation, scientific research, and military surveillance sectors. The space industry is witnessing a surge in innovation, with numerous private companies and space agencies investing in RLV technology.
Companies such as ISAR Aerospace and Blue Origin are at the forefront of this development, focusing on the design, materials, and propulsion systems of these vehicles. Space missions in LEO and beyond are increasingly relying on RLVs for their launching systems. The benefits extend beyond cost savings, as these vehicles enable more frequent launches and a reduced environmental impact compared to traditional, single-use launch vehicles. The development of RLVs is a collaborative effort between various stakeholders, including Original Equipment Manufacturers (OEMs) and space agencies. The technology's potential applications are vast, from space exploration and space tourism to scientific discovery and space mining.
Despite the progress made in RLV technology, there are challenges to overcome. Initial investment and development costs remain high, necessitating ongoing research and innovation. Additionally, the materials and propulsion systems used in RLV design require rigorous testing to ensure reliability and safety. The aeronautical test range plays a crucial role In the development and certification of RLVs. These facilities provide the necessary infrastructure for testing various aspects of the vehicles, ensuring they meet the stringent requirements for space missions. RLVs are also gaining attention In the defense sector, with applications in military surveillance and interplanetary exploration. For instance, the Tiangong Space Station, a collaborative project between China and other countries, is using RLVs for its transport and resupply missions.
|
Market Scope |
|
|
Report Coverage |
Details |
|
Page number |
139 |
|
Base year |
2023 |
|
Historic period |
2018-2022 |
|
Forecast period |
2024-2028 |
|
Growth momentum & CAGR |
Accelerate at a CAGR of 10.03% |
|
Market growth 2024-2028 |
USD 820.1 million |
|
Market structure |
Fragmented |
|
YoY growth 2023-2024(%) |
8.87 |
|
Key countries |
US, China, France, Germany, and India |
|
Competitive landscape |
Leading Companies, Market Positioning of Companies, Competitive Strategies, and Industry Risks |
What are the Key Data Covered in this Reusable Launch Vehicles Market Research and Growth Report?
- CAGR of the Reusable Launch Vehicles industry during the forecast period
- Detailed information on factors that will drive the growth and forecasting between 2024 and 2028
- Precise estimation of the size of the market and its contribution of the industry in focus to the parent market
- Accurate predictions about upcoming growth and trends and changes in consumer behaviour
- Growth of the market across North America, Europe, APAC, South America, and Middle East and Africa
- Thorough analysis of the market's competitive landscape and detailed information about companies
- Comprehensive analysis of factors that will challenge the reusable launch vehicles market growth of industry companies
We can help! Our analysts can customize this reusable launch vehicles market research report to meet your requirements.
 RIA -
RIA - 
