Riflescope And Red Dot Sight Market Size 2025-2029
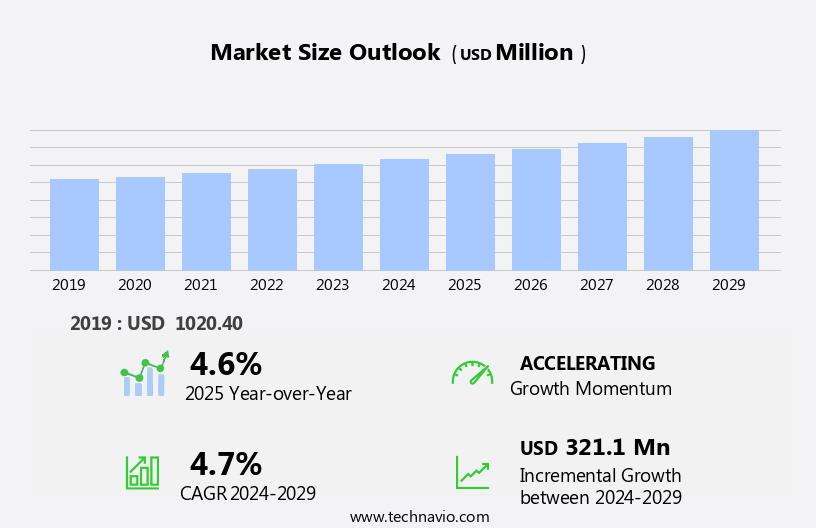
The riflescope and red dot sight market size is forecast to increase by USD 321.1 million, at a CAGR of 4.7% between 2024 and 2029.
- The market exhibits significant growth due to several key trends. Firstly, the increasing defense and military expenditure worldwide fuel the demand for advanced optics technology. Secondly, the integration of digital and smart features in riflescopes and red dot sights enhances their functionality and precision, making them popular among shooters. Further, hunting remains a significant market for riflescopes and red dot sights, with trends leaning towards user-friendly, versatile, and precise aiming solutions. Innovations in the industry include Bluetooth connectivity, real-time data transmission via mobile apps, and the integration of high-tech features like thermal imaging and high-definition optics. Lastly, stringent regulations and compliance requirements ensure the production of high-quality and safe optics products. These factors collectively drive the growth of the market.
What will be the Size of the Riflescope And Red Dot Sight Market During the Forecast Period?
- The market encompassing riflescopes and red dot sights experiences continuous growth, driven by the increasing popularity of precision shooting and shooting sports. Firearm ownership for both recreational and professional purposes fuels the demand for advanced optical equipment. Riflescope technology is evolving, offering features such as clarity under various lighting conditions, digital range finding, and advanced reticle systems. Military and government spending on high-tech shooting equipment also contributes to market expansion. Overall, the market is expected to continue growing, providing shooting enthusiasts and professionals with an array of advanced, accurate, and user-friendly optical equipment solutions.
How is this Riflescope And Red Dot Sight Industry segmented and which is the largest segment?
The riflescope and red dot sight industry research report provides comprehensive data (region-wise segment analysis), with forecasts and estimates in "USD million" for the period 2025-2029, as well as historical data from 2019-2023 for the following segments.
- Type
- Riflescope
- Red dot sight
- End-user
- Hunting
- Military and defense
- Sports shooting
- Law enforcement
- Security and surveillance
- Geography
- North America
- Canada
- US
- Europe
- Germany
- France
- Italy
- APAC
- China
- India
- Japan
- South America
- Brazil
- Middle East and Africa
- North America
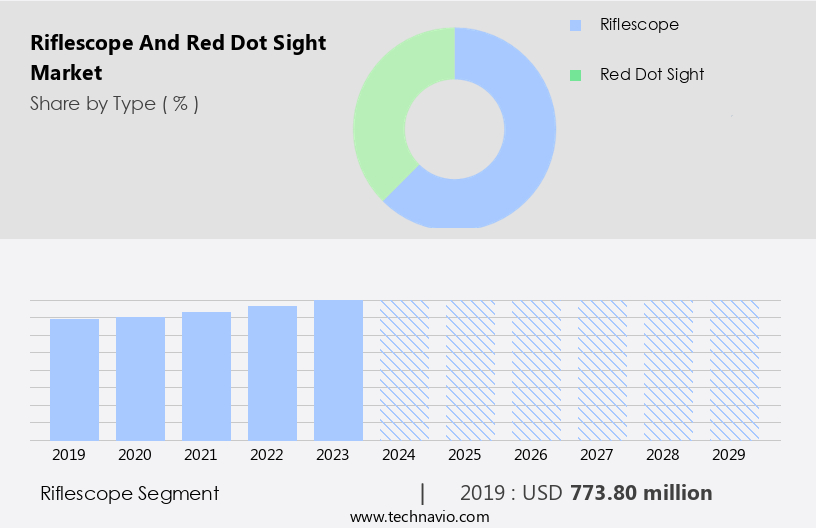
By Type Insights
The riflescope segment is estimated to witness significant growth during the forecast period. Riflescopes are essential optical devices used to enhance shooting accuracy by magnifying targets and providing precise aiming points. These devices are widely employed in hunting, security, and tactical applications. The market can be segmented based on magnification, technology, and application. Fixed power riflescopes offer a constant magnification level, such as the Leupold FX-II 4x33, which is known for its simplicity, reliability, and quick target acquisition, making it suitable for close-to-mid-range shooting. In contrast, variable power riflescopes, like the Vortex Optics Viper PST Gen II 3-15x44, offer adjustable magnification, providing greater flexibility for various shooting distances.
Further, advanced technologies, such as HD lenses, T coating, and digital imaging, enhance riflescope performance. Magnification levels, brightness, and clarity are critical factors in riflescope selection. Riflescopes are also used in shooting sports, armed forces modernization, and anti-terrorist activities. Reliability, smart scopes, infrared scopes, target tracking, and weather resistance are essential features. Scope accessories, such as target practice tools, remote settings, and advanced technology, further enhance riflescope functionality.
Get a glance at the market report of share of various segments Request Free Sample
The riflescope segment was valued at USD 773.80 million in 2019 and showed a gradual increase during the forecast period.
Regional Analysis
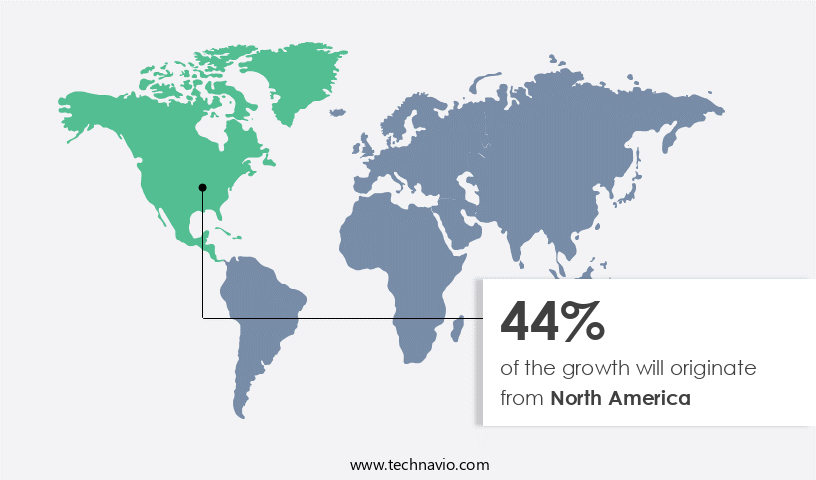
North America is estimated to contribute 44% to the growth of the global market during the forecast period. Technavio's analysts have elaborately explained the regional trends and drivers that shape the market during the forecast period.
For more insights on the market size of various regions, Request Free Sample
The North American market is driven by significant defense spending, a strong hunting culture, and increasing civilian firearm ownership. The US dominates this market due to extensive military modernization efforts and the demand for advanced optical solutions. In 2023, the US Department of Defense allocated over USD 900 billion to defense spending, with a substantial portion dedicated to advanced firearm equipment, including precision optics. This continuous investment fuels the demand for high-performance riflescopes and red dot sights among military personnel and law enforcement agencies. Additionally, the well-established hunting and shooting sports culture in North America further bolsters market growth. HD lenses, clarity, magnification, brightness, and reliability are essential features sought after by consumers in this market.
Advanced technology, such as smart scopes, infrared scopes, target tracking, weather resistance, and reflective scopes, is also driving market growth. Scope accessories, target practice, remote settings, and advanced calibration are other significant factors contributing to the market's expansion. The market caters to various applications, including long-range shooting, hunting optics, ballistic compensation, sports optics, outdoor recreation, and law enforcement optics. Wireless connectivity, intuitive design, and customizable settings are some advanced features that enhance the user experience.
Market Dynamics
Our researchers analyzed the data with 2024 as the base year, along with the key drivers, trends, and challenges. A holistic analysis of drivers will help companies refine their marketing strategies to gain a competitive advantage.
What are the key market drivers leading to the rise In the adoption of Riflescope And Red Dot Sight Industry?
- Rising defense and military expenditure is the key driver of the market. The market is experiencing significant growth due to escalating defense and military expenditures worldwide. Advanced optics, including HD lenses, T coating, and magnification, are in high demand to improve precision and readiness for armed forces modernization programs. In 2023, global military spending reached an all-time high of USD 2,443 billion, marking a 6.8% increase from the previous year. This rise in spending is driven by the top military spenders, including the US, China, and Russia. Hunting, shooting sports, and law enforcement also contribute to the market's growth. Advanced technology, such as smart scopes, infrared scopes, thermal imaging scopes, and ballistic compensation, enhances the functionality of riflescopes and red dot sights.
- Weather resistance, reliability, and customizable settings are essential features for these optics. Magnifying lenses, objective lenses, and rifle scope reviews cater to various user needs. The market offers a wide range of optics technology, including advanced calibration, wireless connectivity, and data visualization, to optimize performance for long-range shooting and tactical applications. Scope accessories, such as remote settings and target tracking, add value to the market. Overall, the market is poised for continued growth, driven by the increasing demand for advanced optics technology in various industries.
What are the market trends shaping the Riflescope And Red Dot Sight Industry?
- Integration of digital and smart features is the upcoming market trend. The market are experiencing advancements with the integration of digital and smart technologies. These innovations enhance accuracy, convenience, and overall user experience. Modern optics incorporate digital displays, range finders, and ballistic calculators, providing real-time data for improved targeting precision. For example, the ATN X-Sight 4K Pro riflescope showcases these advancements with its Ultra HD sensor technology, ballistic calculator, and night vision mode. Its smart features include Recoil Activated Video (RAV) function, which automatically records footage upon detecting recoil, enabling users to review each shot. Similarly, the Pulsar Thermion 2 combines thermal imaging with a digital display, ensuring clear target visualization in challenging environments like fog, rain, or total darkness.
- Other features include magnification, clarity, brightness, weather resistance, and advanced calibration for long-range shooting and hunting. Additionally, optics technology offers advanced features such as remote settings, wireless connectivity, and data visualization through smart technology and customizable settings. These tactical optics cater to various applications, including shooting sports, target practice, military-grade optics, law enforcement optics, and outdoor recreation. Magnifying lenses, objective lenses, and infrared scopes are also popular choices for their reliability and performance optimization. Rifle scope reviews provide valuable insights into the latest advancements and user experiences.
What challenges does the Riflescope And Red Dot Sight Industry face during its growth?
- Stringent regulations and compliance requirements a key challenges affecting the industry's growth. The market faces stringent regulations and compliance requirements, posing a significant challenge. Advanced optics, including thermal imaging, night vision, and range-finding capabilities, are subject to intricate legal frameworks designed to prevent misuse and ensure national security. In the US, the International Traffic in Arms Regulations (ITAR) governs the export of optics classified as defense articles, such as those with advanced imaging features.
- HD lenses, clarity, magnification, brightness, and weather resistance are essential features driving demand for riflescopes and red dot sights in shooting sports, hunting, armed forces modernization, and anti-terrorist activities. Advanced technology, such as smart scopes, infrared scopes, target tracking, ballistic compensation, and digital imaging, enhances performance optimization. Scope accessories, including remote settings, wireless connectivity, and customizable settings, add value to these optics. The market's growth is fueled by the increasing popularity of long-range shooting, hunting optics, law enforcement optics, and tactical optics. The user interface, advanced features, and reliability of these optics continue to evolve, catering to diverse applications and user preferences.
Exclusive Customer Landscape
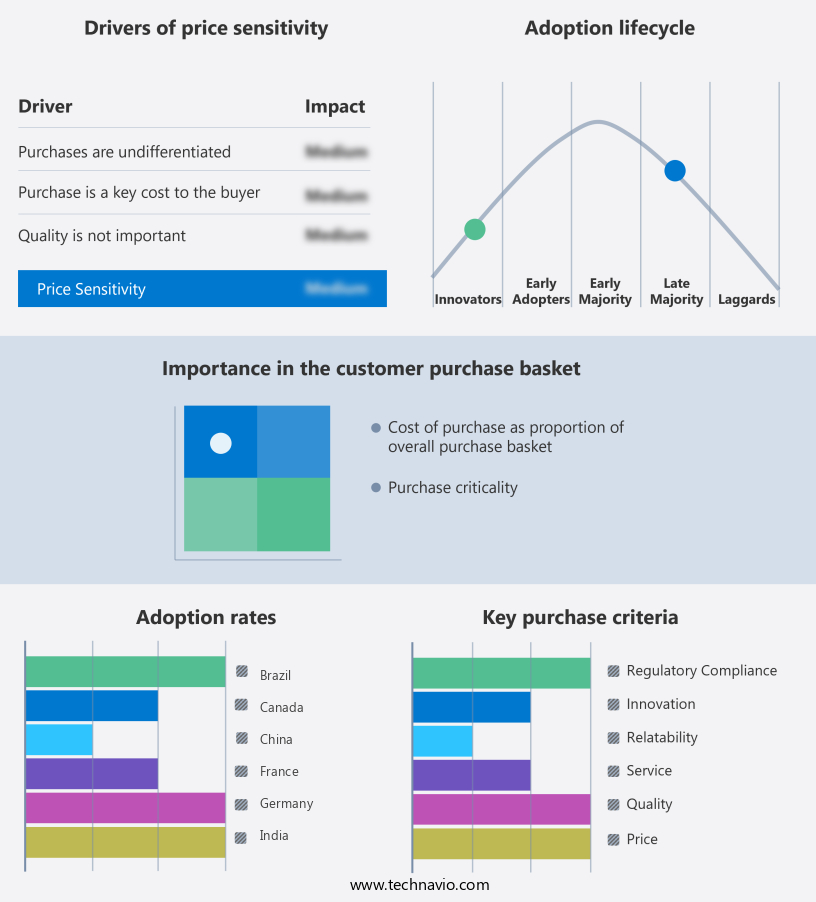
The riflescope and red dot sight market forecasting report includes the adoption lifecycle of the market, covering from the innovator's stage to the laggard's stage. It focuses on adoption rates in different regions based on penetration. Furthermore, the riflescope and red dot sight market report also includes key purchase criteria and drivers of price sensitivity to help companies evaluate and develop their market growth analysis strategies.
Customer Landscape
Key Companies & Market Insights
Companies are implementing various strategies, such as strategic alliances, riflescope and red dot sight market forecast, partnerships, mergers and acquisitions, geographical expansion, and product/service launches, to enhance their presence In the industry.
Aimpoint AB - The company offers riflescope and red dot sight such as Hunter full-tube sights for precision, and compact Acro models for pistols.
The industry research and growth report includes detailed analyses of the competitive landscape of the market and information about key companies, including:
- Athlon Optics
- BARSKA
- Burris Co.
- Bushnell Outdoor Products
- Carl Zeiss AG
- EOTech
- Hawke Optics Ltd.
- Holosun Technologies Inc.
- Leapers
- Leupold and Stevens Inc.
- Nightforce Optics
- Primary Arms LLC
- SIG Sauer Inc.
- Sightmark
- Trijicon Inc.
- TruGlo
- Vortex Optics
Qualitative and quantitative analysis of companies has been conducted to help clients understand the wider business environment as well as the strengths and weaknesses of key industry players. Data is qualitatively analyzed to categorize companies as pure play, category-focused, industry-focused, and diversified; it is quantitatively analyzed to categorize companies as dominant, leading, strong, tentative, and weak.
Research Analyst Overview
The market, specifically riflescopes and red dot sights, continues to experience significant growth due to various factors driving demand. These factors include the modernization of armed forces and the increasing popularity of shooting sports, hunting, and outdoor recreation. Riflescopes, with their magnification capabilities, have long been a staple for those engaging in long-range shooting and tactical applications. The demand for riflescopes is driven by their ability to enhance accuracy and clarity, allowing users to better identify and engage targets. The advancements in optics technology, such as high-definition lenses and T coatings, have further improved the performance of riflescopes, making them an essential tool for various applications.
Red dot sights, on the other hand, have gained popularity due to their intuitive design and ease of use. They provide a wide field of view and allow for quick target acquisition, making them ideal for close-range engagements and dynamic shooting environments. The reliability of red dot sights, combined with their ability to function in various weather conditions, has made them a preferred choice for law enforcement and military personnel. The market for optics is not limited to traditional riflescopes and red dot sights. Advanced technology has led to the development of smart scopes, thermal imaging scopes, and infrared scopes, among others.
In addition, these advanced optics offer features such as target tracking, ballistic compensation, and wireless connectivity, providing users with a more comprehensive and customizable shooting experience. The market for optics is also driven by the growing demand for scope accessories, such as mounts, rings, and covers. These accessories enhance the functionality and durability of optics, making them a necessary investment for serious shooters. The market for optics is highly competitive, with numerous players offering a range of products catering to various applications and budgets. The market is characterized by continuous innovation and advancements in technology, with companies focusing on performance optimization, user interface, and advanced features to differentiate themselves.
|
Market Scope |
|
|
Report Coverage |
Details |
|
Page number |
203 |
|
Base year |
2024 |
|
Historic period |
2019-2023 |
|
Forecast period |
2025-2029 |
|
Growth momentum & CAGR |
Accelerate at a CAGR of 4.7% |
|
Market Growth 2025-2029 |
USD 321.1 million |
|
Market structure |
Fragmented |
|
YoY growth 2024-2025(%) |
4.6 |
|
Key countries |
US, Canada, China, Germany, India, France, Brazil, Japan, Italy, and Russia |
|
Competitive landscape |
Leading Companies, Market Positioning of Companies, Competitive Strategies, and Industry Risks |
What are the Key Data Covered in this Riflescope And Red Dot Sight Market Research and Growth Report?
- CAGR of the Riflescope And Red Dot Sight industry during the forecast period
- Detailed information on factors that will drive the market growth and forecasting between 2025 and 2029
- Precise estimation of the size of the market and its contribution of the industry in focus to the parent market
- Accurate predictions about upcoming growth and trends and changes in consumer behaviour
- Growth of the market across North America, Europe, APAC, South America, and Middle East and Africa
- Thorough analysis of the market's competitive landscape and detailed information about companies
- Comprehensive analysis of factors that will challenge the riflescope and red dot sight market growth of industry companies
We can help! Our analysts can customize this riflescope and red dot sight market research report to meet your requirements.
 RIA -
RIA - 
