
Rope Market Size 2025-2029
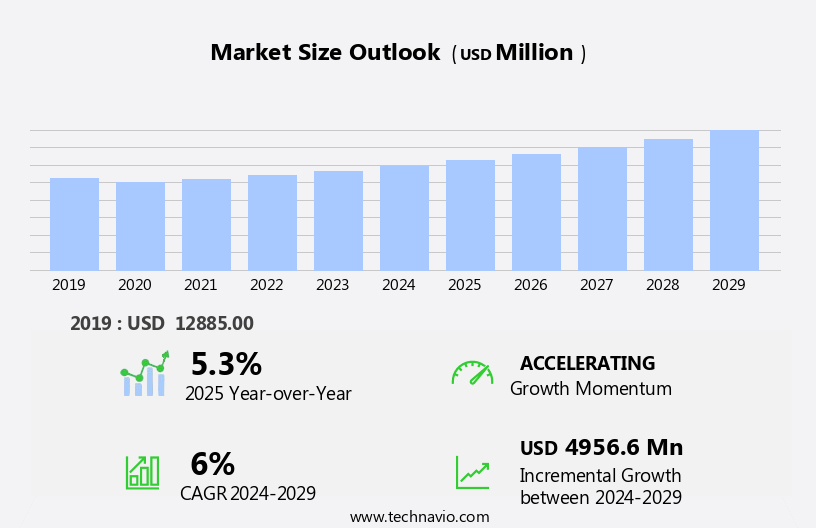
The rope market size is forecast to increase by USD 4.96 billion at a CAGR of 6% between 2024 and 2029.
- The market is experiencing significant growth due to various key trends and factors. One of the primary drivers is the increasing investment in infrastructure projects, leading to a higher demand for ropes in construction and engineering applications. Additionally, new product launches continue to enter the market, offering innovative solutions to meet the evolving needs of consumers. Restoration initiatives in historical sites and outdoor cafes are also boosting demand for high-tensile strength and endurance ropes. However, uncertain macroeconomic conditions pose a challenge to market growth, as economic instability can impact demand and pricing. Overall, the market is expected to continue its expansion, driven by these trends and factors.
What will be the Size of the Rope Market During the Forecast Period?
- The market encompasses a diverse range of loads and materials, including steel wire, nylon, polyester, polypropylene, hemp, and synthetic fibers like polyolefin. This market caters to various industries such as industrial and crane applications, mining, transportation, marine and fisheries, and the nautical sector. In recent years, advancements in technology have led to the emergence of rope robots, enhancing efficiency and safety in hoisting and pulley systems.
- Industrial applications often utilize high-performance steel wire ropes for heavy-duty lifting and hoisting, while synthetic ropes like nylon, polyester, and polypropylene are popular In the maritime and fishing industries for mooring, inland towing, and as hoisting lines. Additionally, waterproof ropes are essential for camping, rock climbing, and other outdoor activities. The use of man-made textile fibers like cotton and various plastic fibers continues to expand, catering to the evolving demands of diverse industries.
How is this Rope Industry segmented and which is the largest segment?
The rope industry research report provides comprehensive data (region-wise segment analysis), with forecasts and estimates in "USD billion" for the period 2025-2029, as well as historical data from 2019-2023 for the following segments.
- Product
- Steel wire
- Synthetic
- Cotton
- Others
- End-user
- Industrial
- Commercial
- Residential
- Geography
- APAC
- China
- India
- Japan
- North America
- Canada
- US
- Europe
- Germany
- UK
- France
- Italy
- Middle East and Africa
- South America
- Brazil
- APAC
By Product Insights
- The steel wire segment is estimated to witness significant growth during the forecast period.
The steel wire rope segment dominates The market due to its superior strength-to-weight ratio, making it an ideal choice for heavy-duty applications in various industries. These ropes are manufactured by winding multiple strands of thin steel wires around a central core. Steel wire ropes are extensively used In the construction sector for hoisting and lifting, particularly in industrial and crane applications. They are also essential In the mining industry for inland towing and drilling. In the marine and fisheries sector, steel wire ropes are employed for mooring and hoisting lines. The oil and gas industry relies on these ropes for exploration and extraction processes.
Furthermore, steel wire ropes offer excellent corrosion resistance, durability, and endurance, making them suitable for harsh environments and extreme conditions, including rain, snow, and UV radiation. The industrial segment, maritime and fishing, commercial, camping, agriculture, adventure sports, logistics, and various other industries utilize steel wire ropes for their high tensile strength and ability to withstand heavy loads.

Get a glance at the Rope Industry report of share of various segments Request Free Sample
The steel wire segment was valued at USD 9.28 billion in 2019 and showed a gradual increase during the forecast period.
Regional Analysis
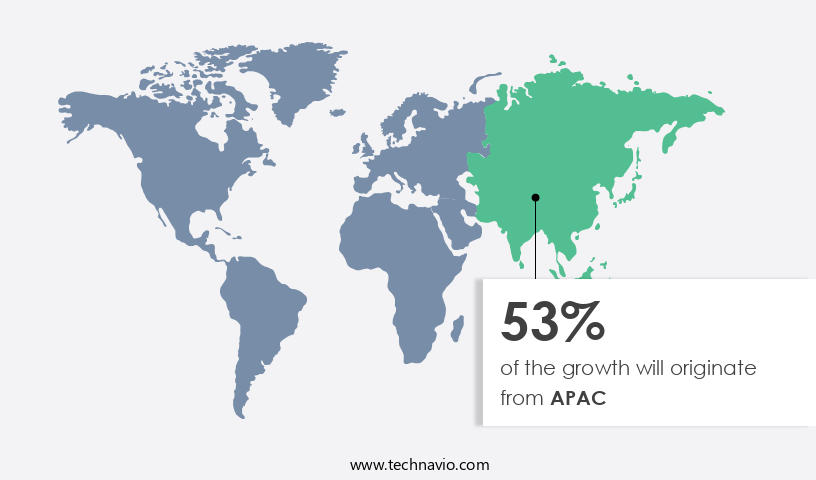
- APAC is estimated to contribute 53% to the growth of the global market during the forecast period.
Technavio's analysts have elaborately explained the regional trends and drivers that shape the market during the forecast period.
For more insights on the market share of various regions, Request Free Sample
The Asia Pacific market is experiencing substantial growth, holding a considerable market share. Key countries, including China, Japan, South Korea, and India, contribute significantly due to a vast end-user base. Rapid industrialization, urbanization, and a strong construction industry drive the region's rope manufacturing. Synthetic ropes, particularly in residential construction, witness increasing demand, making China, South Korea, and India significant exporters. Factors fueling this growth include the industrial segment's expansion in maritime and fishing, transportation, mining, oil and gas, and marine industries. High-performance ropes, such as nylon, polyester, hemp, polypropylene, and steel wire, cater to diverse applications, including mooring, inland towing, hoisting lines, and pulley systems for heavy-duty applications. The market's growth is influenced by factors like corrosion resistance, UV radiation, rain, snow, and waterproof capabilities, ensuring versatility for various industries.
Market Dynamics
Our rope market researchers analyzed the data with 2024 as the base year, along with the key drivers, trends, and challenges. A holistic analysis of drivers will help companies refine their marketing strategies to gain a competitive advantage.
What are the key market drivers leading to the rise In the adoption of Rope Industry?
Increasing investment in infrastructure is the key driver of the market.
- The global construction sector is experiencing a rise in growth due to increasing investments in infrastructure projects worldwide. For instance, China's USD13.1 billion investment In the Beijing International Airport, designed to accommodate 72 million passengers by 2025, is just one example. Governments are also investing heavily In the development of sports infrastructure and complexes, leading to a significant increase in spending on capital-intensive projects. This growth In the construction industry is driving the demand for loads and materials, including rope and cable solutions. Rope robots are increasingly being used in industrial and crane applications, as well as in mining, transportation, marine and fisheries, and oil and gas industries.
- Steel wire ropes, synthetic ropes made from man-made textile fibers and natural fibers, and high-performance ropes made from alloys and high-strength fibers are all in high demand. The industrial segment, including maritime and fishing, commercial segment, camping, rock climbing, agriculture, and adventure sports, is a significant consumer of ropes. Nylon, polyester, hemp, polypropylene, and other durable ropes are used for various applications, including mooring, inland towing, hoisting lines, and suspension. Ropes are also essential in heavy-duty applications in roads, railways, airports, ports, wire ropes for drilling, exploration, and extraction, and raw materials such as steel wires and synthetic fibers.
What are the market trends shaping the Rope Industry?
New product launches is the upcoming market trend.
- The market is experiencing significant growth due to the increasing demand for loads and materials in various sectors, including construction, industrial and crane applications, mining, transportation, marine and fisheries, and oil and gas industries. Innovations in rope technology, such as rope robots and high-performance ropes made from man-made textile fibers like nylon, polyester, and polypropylene, as well as natural fibers like hemp and jute, are driving market expansion. These advanced ropes offer superior tensile strength, endurance, and resistance to corrosion, UV radiation, rain, snow, and water, making them ideal for heavy-duty applications in industries and commercial segments. Additionally, the growing popularity of adventure sports, agriculture, and logistics industries is further fueling the demand for durable ropes.
- The market is expected to witness continued growth due to the launch of new products and the increasing adoption of synthetic ropes in place of traditional steel wire ropes for various applications, such as mooring, inland towing, hoisting lines, and pulley systems. The industrial category, including marine and fishing, marine transportation, nautical and fishing, and outdoor cafes, is a significant contributor to the market's growth. Restoration initiatives and the need for ropes with high tensile strength and corrosion resistance in industries like roads, railways, airports, ports, drilling, exploration, and extraction are also driving market growth. The market is expected to continue its upward trajectory during the forecast period, with a focus on sustainable manufacturing processes and the development of high-strength fibers and alloys.
What challenges does the Rope Industry face during its growth?
Uncertain macroeconomic conditions is a key challenge affecting the industry growth.
- The market encompassing steel wire ropes and synthetic ropes made from man-made textile fibers and natural fibers, plays a crucial role in various industries such as construction, oil and gas, mining, transportation, marine and fisheries, and agriculture. In the industrial segment, rope is utilized extensively in heavy-duty applications, including hoisting lines, mooring, inland towing, and pulley systems. In the commercial segment, ropes are used in maritime and fishing industries, as well as in outdoor cafes and restoration initiatives. Synthetic ropes, including nylon, polyester, hemp, polypropylene, and polyolefin fibers, offer advantages such as durability, corrosion resistance, and UV radiation resistance.
- Steel wire ropes, on the other hand, provide high tensile strength and endurance, making them suitable for lifting, hauling, and suspension applications in roads, railways, airports, ports, wire ropes, drilling, exploration, and extraction. The construction industry's demand for ropes is influenced by macroeconomic factors, including national and regional economic conditions, labor and healthcare costs, access to credit, and other economic indicators. These factors could impact the construction industry's growth and, consequently, the demand for rope. Additionally, ropes are used in various industries, including transportation, marine and fishing, agriculture, adventure sports, and logistics, where they play a vital role in ensuring safety and efficiency.
Exclusive Customer Landscape
The rope market forecasting report includes the adoption lifecycle of the market, covering from the innovator's stage to the laggard's stage. It focuses on adoption rates in different regions based on penetration. Furthermore, the rope market report also includes key purchase criteria and drivers of price sensitivity to help companies evaluate and develop their market growth analysis strategies.

Customer Landscape
Key Companies & Market Insights
Companies are implementing various strategies, such as strategic alliances, rope market forecast, partnerships, mergers and acquisitions, geographical expansion, and product/service launches, to enhance their presence In the industry.
Cortland Ltd.: The company offers ropes such as polyester double-braid, and spun polyester double-braid ropes.
The industry research and growth report includes detailed analyses of the competitive landscape of the market and information about key companies, including:
- BRIDON INTERNATIONAL GmbH
- CSR Inc.
- Donaghys Ltd.
- English Braids Ltd.
- Erin Rope Corp.
- Gottifredi Maffioli Srl
- Hampidjan Group
- Katradis Marine Ropes Ind SA
- Marlow Ropes Ltd.
- Novatec Braids Ltd.
- ROPENET
- Samson Rope Technologies Inc.
- Southern Ropes
- Teufelberger Holding AG
- Touwfabriek Langman B.V.
- Usha Martin Ltd.
- van Beelen Group BV
- WireCo
- Yale Cordage Inc.
Qualitative and quantitative analysis of companies has been conducted to help clients understand the wider business environment as well as the strengths and weaknesses of key industry players. Data is qualitatively analyzed to categorize companies as pure play, category-focused, industry-focused, and diversified; it is quantitatively analyzed to categorize companies as dominant, leading, strong, tentative, and weak.
Research Analyst Overview
The market encompasses a diverse range of applications across various industries, including construction, industrial and crane, mining, transportation, marine and fisheries, and more. This sector caters to the demand for loads and materials that require strong and reliable solutions for lifting, hauling, suspension, and other heavy-duty applications. In the construction industry, ropes play a crucial role in hoisting building materials, securing structures during restoration initiatives, and providing support for suspension systems. The industrial segment, specifically, relies on ropes for heavy-duty lifting, while the maritime and fishing industries utilize them for mooring, inland towing, and hoisting lines. The transportation sector also benefits from ropes in various ways, such as in pulley systems for bridges, roads, railways, and airports.
Moreover, in the oil and gas industry, ropes are essential for drilling and exploration operations, as well as for extraction processes. Synthetic ropes, made from man-made textile fibers like nylon, polyester, and polypropylene, have gained popularity due to their durability and versatility. Natural fibers, such as hemp, jute, and polyolefin fibers, are also used In the production of ropes for various applications. The market for ropes is vast and diverse, catering to numerous industries and applications. The demand for high-performance ropes with corrosion resistance, UV radiation resistance, and waterproof capabilities is on the rise, driven by the need for ropes that can withstand harsh environments and conditions.
Furthermore, tensile strength and endurance are critical factors In the selection of ropes for heavy-duty applications. The industrial category, for instance, requires ropes that can handle significant loads, while the marine and fishing industries demand ropes that can withstand the rigors of the aquatic environment. The use of ropes extends beyond industrial and commercial applications. They are also used in camping, rock climbing, agriculture, adventure sports, and logistics. The demand for ropes In these sectors is driven by the need for reliable and durable solutions for various applications. The market is expected to grow In the coming years, driven by the increasing demand for ropes in various industries and applications.
|
Rope Market Scope |
|
|
Report Coverage |
Details |
|
Page number |
187 |
|
Base year |
2024 |
|
Historic period |
2019-2023 |
|
Forecast period |
2025-2029 |
|
Growth momentum & CAGR |
Accelerate at a CAGR of 6% |
|
Market Growth 2025-2029 |
USD 4.96 billion |
|
Market structure |
Fragmented |
|
YoY growth 2024-2025(%) |
5.3 |
|
Key countries |
US, China, India, Japan, Germany, Canada, UK, France, Italy, and Brazil |
|
Competitive landscape |
Leading Companies, Market Positioning of Companies, Competitive Strategies, and Industry Risks |
What are the Key Data Covered in this Rope Market Research and Growth Report?
- CAGR of the Rope industry during the forecast period
- Detailed information on factors that will drive the Rope market growth and forecasting between 2025 and 2029
- Precise estimation of the size of the market and its contribution of the industry in focus to the parent market
- Accurate predictions about upcoming growth and trends and changes in consumer behaviour
- Growth of the market across APAC, North America, Europe, Middle East and Africa, and South America
- Thorough analysis of the market's competitive landscape and detailed information about companies
- Comprehensive analysis of factors that will challenge the rope market growth of industry companies
We can help! Our analysts can customize this rope market research report to meet your requirements.