Servo Valve Market Size 2024-2028
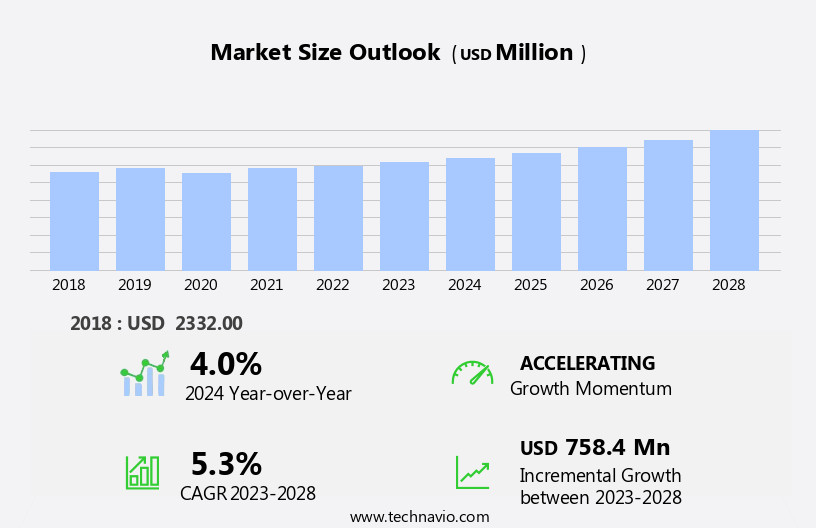
The servo valve market size is forecast to increase by USD 758.4 million at a CAGR of 5.3% between 2023 and 2028.
- The market is experiencing significant growth, driven primarily by increasing investments in the construction sector and the adoption of automation technologies. The construction industry's expansion, particularly in developing regions, is fueling the demand for servo valves due to their precision control capabilities in various applications, such as water and air control in HVAC systems and industrial processes. Moreover, strategic partnerships among market companies are shaping the competitive landscape, with companies collaborating to expand their product offerings, enter new markets, and enhance their technological capabilities.
- However, disruptions in the supply chains of servo valves, caused by geopolitical tensions and raw material shortages, pose challenges to market growth. Companies seeking to capitalize on market opportunities must focus on supply chain resilience and explore alternative sourcing options to mitigate risks. Additionally, investing in research and development to innovate and differentiate offerings will be crucial to staying competitive in this dynamic market.
What will be the Size of the Servo Valve Market during the forecast period?
- The market encompasses directional control valves that utilize servomechanisms for accurate positioning and control in various industrial applications. Servo valves offer high power density, enabling them to generate significant force with small inputs. These valves employ a linkage mechanism that converts electrical input into hydraulic fluid flow, providing continuous variation in force and velocity. The market's growth is driven by the increasing demand for precise control in hydraulic systems, particularly in industries such as automotive, aerospace, and manufacturing. High-performance servo valves, including proportional valves and mechanical servo valves, deliver improved acceleration and directional control, ensuring optimal load motion.
- Servo systems employ closed-loop circuits, which utilize error signals and feedback sensing devices to maintain accurate control. The integration of auxiliary power sources and advanced control elements further enhances the functionality of servo valves, enabling them to meet the evolving needs of modern industrial applications.
How is this Servo Valve Industry segmented?
The servo valve industry research report provides comprehensive data (region-wise segment analysis), with forecasts and estimates in "USD million" for the period 2024-2028, as well as historical data from 2018-2022 for the following segments.
- Type
- Electro hydraulic servo valves
- Mechanical servo valves
- End-user
- Industrial manufacturing
- Aerospace
- Oil and gas industry
- Power
- Others
- Geography
- APAC
- China
- Japan
- Europe
- France
- Germany
- North America
- US
- South America
- Middle East and Africa
- APAC
By Type Insights
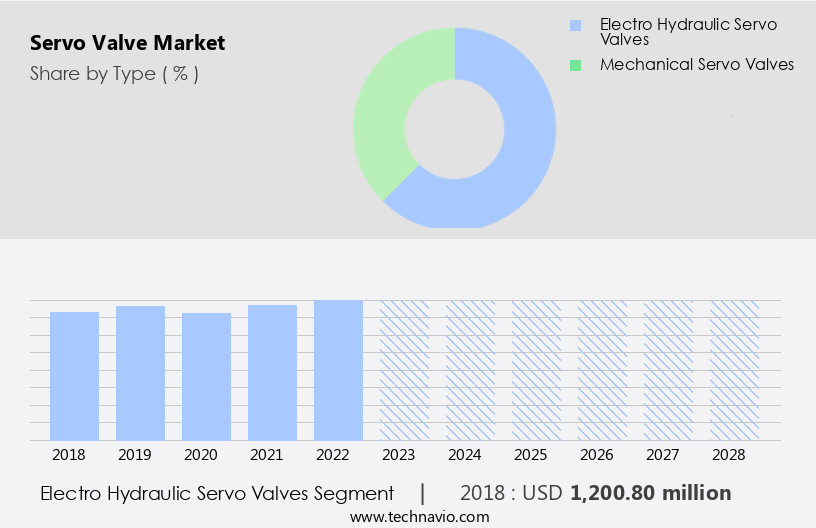
The electro hydraulic servo valves segment is estimated to witness significant growth during the forecast period.
Electro-hydraulic servo valves (EHSVs) are a significant part of the market, recognized for their high precision and dependability in managing fluid flow and mechanical motion. These valves, including those provided by Honeywell, employ an electrical input signal to regulate the flow of gases or liquids, thereby controlling the opening or closing of valves or actuator movement. This mechanism ensures efficient and reliable fluid control in various applications, notably in aviation and engine systems. An EHSV consists of two primary stages. In the initial stage, a torque motor converts the electrical input signal into an electromagnetic force, which moves an armature to control fluid flow, such as pressurized fuel.
In the second stage, a force amplifier, like a sliding sleeve or spool-in-bushing, amplifies the force to generate the desired output variable. The valve spool, often a flapper nozzle, responds to the force amplifier's movement, resulting in accurate control of position, velocity, and volume flow. The electrical control loop and mechanical control loop work in harmony, ensuring high-precision control and minimal error signals. EHSVs are integral to closed-loop hydraulic systems, including hydraulic cylinders and directional control valves, which require continuous variation and fine-tuned control for optimal performance.
Get a glance at the market report of share of various segments Request Free Sample
The Electro hydraulic servo valves segment was valued at USD 1200.80 million in 2018 and showed a gradual increase during the forecast period.
Regional Analysis
APAC is estimated to contribute 44% to the growth of the global market during the forecast period.Technavio’s analysts have elaborately explained the regional trends and drivers that shape the market during the forecast period.
For more insights on the market size of various regions, Request Free Sample
The market is experiencing significant growth, particularly in the Asia Pacific region. Driven by substantial investments in renewable energy and infrastructure development, this market is poised for expansion. For instance, the Asian Development Bank (ADB) and the Government of Mongolia recently inaugurated a 10-megawatt solar photovoltaic power plant in Govi-Altai province. This project, named Serven, is expected to generate approximately 20 million kilowatt-hours of energy annually and reduce carbon dioxide emissions by 15,000 tons per year. Servo valves play a crucial role in hydraulic systems, providing precise control of force, velocity, and position. They utilize a mechanical or electrical input to manipulate a control element, such as a spool, which in turn affects fluid flow.
Proportional valves, with their feedback link and small inputs, offer high-precision control, ensuring accurate output variables. Servo systems employ force amplifiers, such as sliding sleeves or linkages, to amplify the input signal and generate the required force. Hydraulic cylinders convert hydraulic fluid flow into linear motion, making servo valves essential components in various industries, including manufacturing, construction, and transportation.
Market Dynamics
Our researchers analyzed the data with 2023 as the base year, along with the key drivers, trends, and challenges. A holistic analysis of drivers will help companies refine their marketing strategies to gain a competitive advantage.
What are the key market drivers leading to the rise in the adoption of Servo Valve Industry?
- Increasing investments in construction sector is the key driver of the market.
- The market is experiencing notable growth due to increasing investments in infrastructure development and construction activities. For instance, in India, the Union Budget 2024-2025 allocated approximately USD111 million, representing around 3.4% of the country's GDP, for infrastructure and construction projects, marking a 5% increase from the previous year. This investment underscores the government's commitment to urbanization and infrastructure enhancement. In the US, construction spending reached a seasonally adjusted annual rate of USD2,131.9 billion in August 2024, signifying a 4.1% increase from the previous year.
- With a total year-to-date construction spending of USD1,428 billion, the US continues to prioritize infrastructure development. These investments in construction projects are expected to fuel the demand for servo valves in various applications, including water and wastewater treatment, oil and gas, and power generation industries.
What are the market trends shaping the Servo Valve Industry?
- Strategic partnerships among market s is the upcoming market trend.
- The market is experiencing a notable trend towards strategic partnerships, driven by the demand for advanced manufacturing technologies and increased production capabilities. An illustrative instance of this trend is the recent collaboration between a leading engineering technologies firm and a high-performance hydraulic valve manufacturer. In September 2024, Renishaw, an engineering technologies company, partnered with a hydraulic valve manufacturer to supply a cutting-edge metal additive manufacturing system. This partnership aims to enhance the production of servo proportional hydraulic valves at a new technology center in the UK.
- The adoption of advanced laser powder bed fusion (LPBF) systems, such as the RenAM 500Q Ultra, is instrumental in this trend. These systems incorporate innovative technologies that significantly reduce build times while ensuring high-quality output. The integration of LPBF systems in servo valve manufacturing processes is expected to revolutionize the industry by enabling faster production cycles and improved product quality.
What challenges does the Servo Valve Industry face during its growth?
- Disruptions in supply chains of servo valves is a key challenge affecting the industry growth.
- The market is currently confronted with substantial challenges due to disruptions in international supply chains. The Red Sea, a vital trade route connecting Asia, Africa, and Europe, has experienced security concerns since the first attack on an industrial ship in 2023. These security issues have instilled anxiety within the transportation, logistics, and supply chain industries regarding potential interruptions, increased freight costs, extended shipping durations, and the reemergence of the bullwhip effect. The ongoing Israel-Hamas conflict intensifies these challenges, posing a risk of broader disruptions in trade and supply chains.
- In October 2023, Iran-backed Houthi rebels of Yemen heightened tensions by threatening Israeli vessels in the Red Sea and seized a ship belonging to an Israeli businessman, directing it towards the Yemeni coast. These geopolitical instabilities pose significant risks to the market, potentially impacting its growth trajectory.
Exclusive Customer Landscape
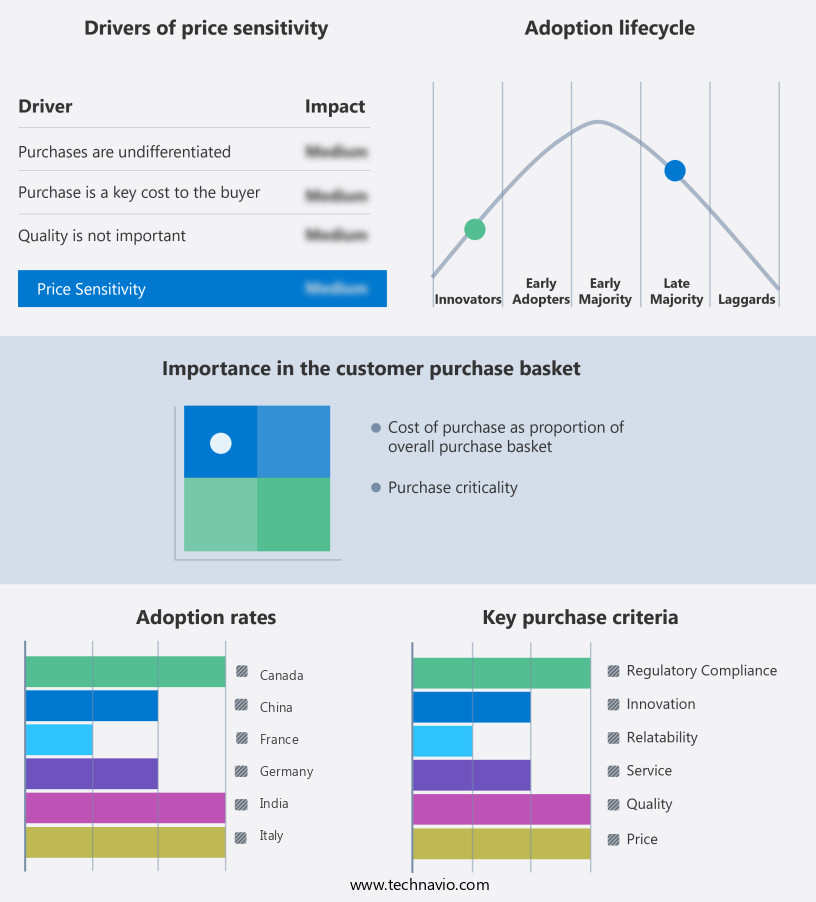
The servo valve market forecasting report includes the adoption lifecycle of the market, covering from the innovator’s stage to the laggard’s stage. It focuses on adoption rates in different regions based on penetration. Furthermore, the servo valve market report also includes key purchase criteria and drivers of price sensitivity to help companies evaluate and develop their market growth analysis strategies.
Customer Landscape
Key Companies & Market Insights
Companies are implementing various strategies, such as strategic alliances, servo valve market forecast, partnerships, mergers and acquisitions, geographical expansion, and product/service launches, to enhance their presence in the industry.
Atos spa - The company specializes in providing advanced servo valve solutions, including the DLHZO-TEB, DLKZOR-TEB, and DHZO-T models. These servo valves offer precise control and efficient performance, catering to various industries and applications. With a commitment to innovation and quality, the company's offerings enhance system functionality and optimize operational efficiency.
The industry research and growth report includes detailed analyses of the competitive landscape of the market and information about key companies, including:
- Atos spa
- Bosch Rexroth AG
- Domin Ltd
- Duplomatic MS S.p.A.
- Eaton Corp plc
- Enfield Technologies
- HAWE Hydraulik SE
- Honeywell International Inc.
- Kawasaki Heavy Industries Ltd.
- Liebherr International AG
- Moog Inc.
- NIRECO Corp
- Oilgear
- Parker Hannifin Corp.
- Schneider Servohydraulics GmbH
- Star Hydraulics Ltd
- Voith GmbH and Co. KGaA
- Woodward Inc.
- YUKEN KOGYO CO LTD
Qualitative and quantitative analysis of companies has been conducted to help clients understand the wider business environment as well as the strengths and weaknesses of key industry players. Data is qualitatively analyzed to categorize companies as pure play, category-focused, industry-focused, and diversified; it is quantitatively analyzed to categorize companies as dominant, leading, strong, tentative, and weak.
Research Analyst Overview
Servo valves are essential components in various industrial automation systems, providing precise control over fluid flow and motion. These valves are distinguished by their ability to respond quickly and accurately to input signals, making them indispensable in applications that require high-performance and high-precision control. One of the key features of servo valves is their high power density. This characteristic enables them to generate significant force with a relatively small size and weight. The high acceleration capabilities of servo valves allow for quick response times, ensuring that the system can adapt to changing conditions in real-time. Proportional valves are a common type of servo valve, which utilize a feedback link to adjust the spool position in response to an error signal.
The spool position is determined by the input signal, and the output variable is the volume flow of hydraulic fluid. The force generated by the valve is amplified by a force amplifier, which enhances the valve's ability to control load motion. Mechanical servo valves operate using a mechanical control loop, which converts electrical input into mechanical motion. The actuator, which can be pneumatic, hydraulic, or electric, translates the electrical input into linear or rotary motion, which in turn moves the valve spool. In contrast, electrohydraulic servo valves use an electrical input to control the flow of hydraulic fluid, creating a closed-loop circuit for accurate control.
The performance characteristics of servo valves are influenced by several factors, including nominal volume flows, spool position, and velocity. Small inputs can result in significant output changes, making servo valves highly sensitive to control signals. The use of a feedback sensing device ensures that the valve maintains accurate position and velocity, even in the presence of external disturbances. Servo valves are employed in a wide range of applications, including hydraulic steering systems, where precise control of fluid flow is essential for maintaining vehicle stability and maneuverability. In these systems, the valve spool position is adjusted based on the error signal generated by a flapper nozzle, which measures the difference between the desired and actual position.
Direct operated valves and pilot operated valves are alternative types of valves used in hydraulic systems. While servo valves offer high-precision control, direct operated valves provide simple on-off control, while pilot operated valves offer a compromise between the two. The hydraulic system's performance depends on various factors, including the type and quality of hydraulic fluid, the design of the hydraulic cylinder, and the configuration of the fluid flow path. A well-designed hydraulic system can deliver high force and precise control, ensuring optimal system performance. In , servo valves are critical components in industrial automation systems, offering high power density, quick response times, and precise control over fluid flow and motion.
The performance characteristics of servo valves are influenced by various factors, including input signals, spool position, velocity, and feedback mechanisms. Servo valves are employed in a wide range of applications, from hydraulic steering systems to continuous valve mechanisms, and their design and configuration play a crucial role in ensuring optimal system performance.
|
Market Scope |
|
|
Report Coverage |
Details |
|
Page number |
211 |
|
Base year |
2023 |
|
Historic period |
2018-2022 |
|
Forecast period |
2024-2028 |
|
Growth momentum & CAGR |
Accelerate at a CAGR of 5.3% |
|
Market growth 2024-2028 |
USD 758.4 million |
|
Market structure |
Fragmented |
|
YoY growth 2023-2024(%) |
4.0 |
|
Key countries |
US, China, Japan, Germany, and France |
|
Competitive landscape |
Leading Companies, Market Positioning of Companies, Competitive Strategies, and Industry Risks |
What are the Key Data Covered in this Servo Valve Market Research and Growth Report?
- CAGR of the Servo Valve industry during the forecast period
- Detailed information on factors that will drive the growth and forecasting between 2024 and 2028
- Precise estimation of the size of the market and its contribution of the industry in focus to the parent market
- Accurate predictions about upcoming growth and trends and changes in consumer behaviour
- Growth of the market across APAC, Europe, North America, South America, and Middle East and Africa
- Thorough analysis of the market’s competitive landscape and detailed information about companies
- Comprehensive analysis of factors that will challenge the servo valve market growth of industry companies
We can help! Our analysts can customize this servo valve market research report to meet your requirements.


