
Smart City Market Size 2025-2029
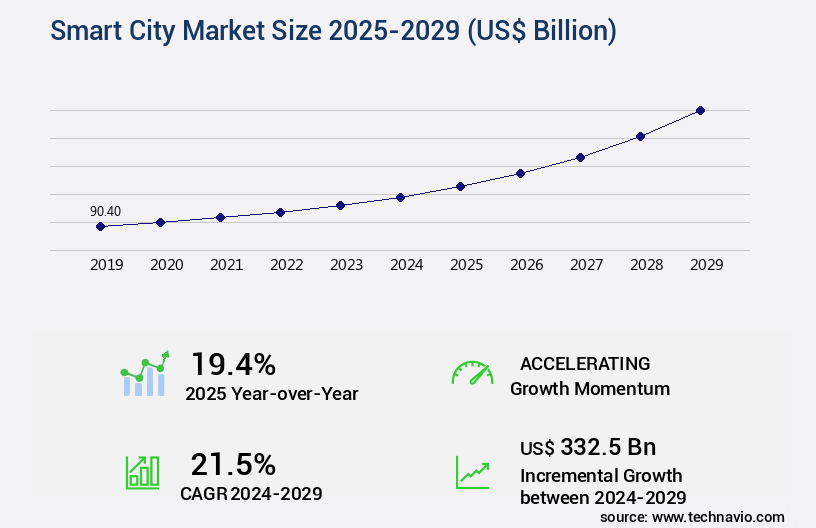
The smart city market size is valued to increase USD 332.5 billion, at a CAGR of 21.5% from 2024 to 2029. Increase in IT consolidation and modernization will drive the smart city market.
Major Market Trends & Insights
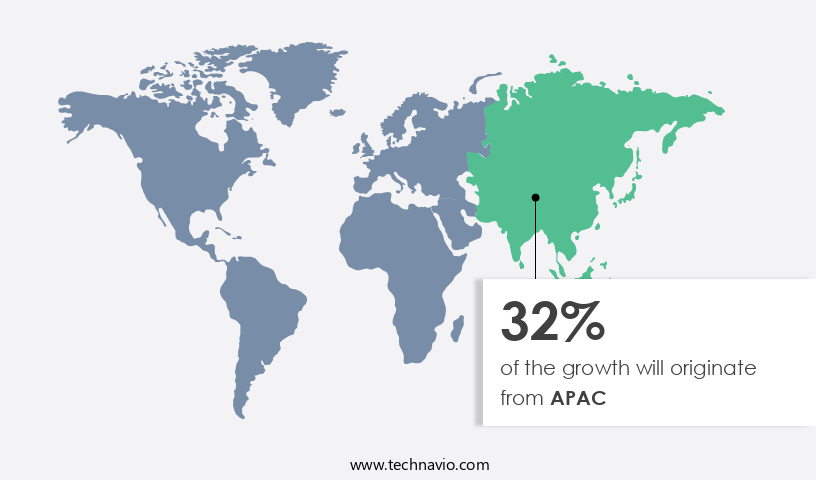
- APAC dominated the market and accounted for a 32% growth during the forecast period.
- By Application - Smart infrastructure segment was valued at USD 38.70 billion in 2023
- By Component - Hardware segment accounted for the largest market revenue share in 2023
Market Size & Forecast
- Market Opportunities: USD 491.37 billion
- Market Future Opportunities: USD 332.50 billion
- CAGR : 21.5%
- APAC: Largest market in 2023
Market Summary
- The market represents a dynamic and continuously evolving landscape of innovation and technological advancement. Core technologies and applications, such as the Internet of Things (IoT), artificial intelligence (AI), and 5G networks, are driving the development of smart cities worldwide. According to recent estimates, The market is expected to reach a significant market share by 2025, with a proliferation of projects in emerging economies. However, challenges persist, including the high cost of upgrading smart grids and the need for regulatory frameworks to ensure data privacy and security.
- Despite these hurdles, opportunities abound for service types and product categories, including smart transportation, energy management, and public safety solutions. The increasing trend towards IT consolidation and modernization further underscores the market's potential for growth.
What will be the Size of the Smart City Market during the forecast period?
Get Key Insights on Market Forecast (PDF) Request Free Sample
How is the Smart City Market Segmented and what are the key trends of market segmentation?
The smart city industry research report provides comprehensive data (region-wise segment analysis), with forecasts and estimates in "USD billion" for the period 2025-2029, as well as historical data from 2019-2023 for the following segments.
- Application
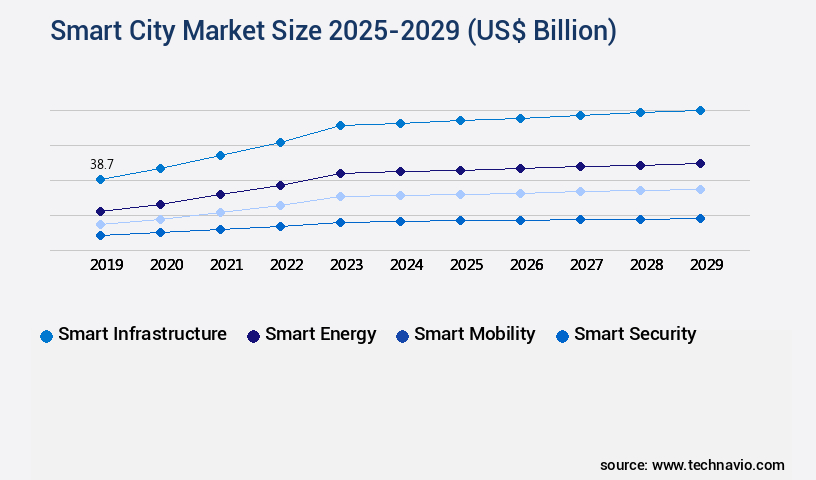
- Smart infrastructure
- Smart energy
- Smart mobility
- Smart security
- Others
- Component
- Hardware
- Software
- Services
- Technology
- IoT (Internet of Things)
- AI (Artificial Intelligence)
- Big Data Analytics
- Cloud Computing
- Cybersecurity
- Communication Technologies (5G, LoRaWAN, NB-IoT)
- Sensor Networks
- Industry Vertical
- Smart Transportation
- Smart Utilities
- Smart Buildings
- Smart Governance
- Smart Healthcare
- Smart Education
- Smart Public Safety
- Smart Infrastructure
- Geography
- North America
- US
- Canada
- Europe
- France
- Germany
- Italy
- UK
- Middle East and Africa
- Egypt
- KSA
- Oman
- UAE
- APAC
- China
- India
- Japan
- South America
- Argentina
- Brazil
- Rest of World (ROW)
- North America
By Application Insights
The smart infrastructure segment is estimated to witness significant growth during the forecast period.
Smart infrastructure integrates digital technology into energy systems, buildings, and industries, transforming the way people live and work. This evolution encompasses smart grids for energy efficiency, Digital Twin technology for predictive maintenance, and artificial intelligence applications for optimization. Smart buildings utilize advanced automation systems for heating, ventilation, lighting, and security. The market is driven by industrial growth, commercialization, and the increasing awareness of energy and building optimization. Smart city infrastructure incorporates real-time traffic monitoring, Public Transportation scheduling, and 5G network deployment for seamless connectivity. Machine learning algorithms and edge computing enable real-time data analysis, while cloud computing platforms store and process vast amounts of data.
Open data initiatives and environmental monitoring sensors promote sustainable urban planning and noise pollution reduction. The market is expanding, with digital transformation in transportation systems, public safety, and waste management optimization. IoT sensor networks, cybersecurity infrastructure, and big data analytics are integral components of this growth. Smart Parking solutions and data analytics platforms enhance the user experience, while citizen engagement portals foster transparency and collaboration. Moreover, emerging technologies like deep learning models, blockchain technology, network virtualization, and air quality monitoring are shaping the future of smart cities. These advancements contribute to the ongoing evolution of smart infrastructure, ensuring a more efficient, sustainable, and connected future.
According to recent studies, the adoption of smart infrastructure technologies has increased by 18%, with expectations of a further 25% growth in the coming years. The integration of AI and machine learning algorithms in smart infrastructure is projected to expand by 21%, while the implementation of 5G networks is anticipated to grow by 27%. Additionally, the market for smart parking solutions is expected to surge by 30%, and the adoption of building automation systems is projected to rise by 24%.
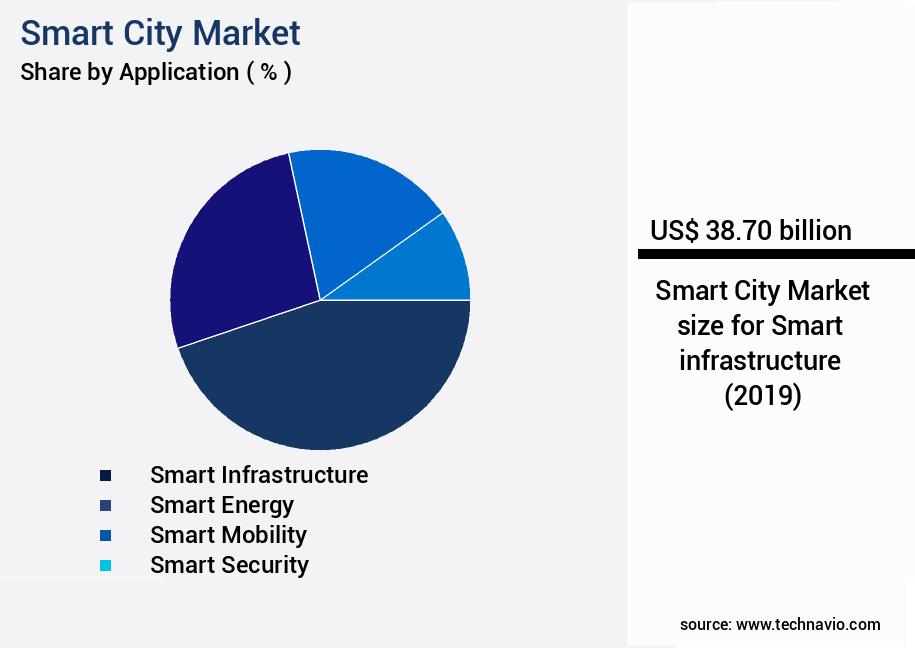
The Smart infrastructure segment was valued at USD 38.70 billion in 2019 and showed a gradual increase during the forecast period.
Regional Analysis
APAC is estimated to contribute 32% to the growth of the global market during the forecast period.Technavio's analysts have elaborately explained the regional trends and drivers that shape the market during the forecast period.
See How Smart City Market Demand is Rising in APAC Request Free Sample
The European the market is characterized by advanced economies and a well-established end-user base. With high-speed wireless networks and increased IoT penetration, Europe is at the forefront of smart city development. Major contributors to the market include Germany and France, hosting several top companies like BT, Vodafone, and Deutsche Telekom. These telecom companies are intensely competing to release innovative smart technology products and corresponding services. According to recent studies, there are approximately 1.5 billion connected devices in Europe, and this number is projected to reach 3.1 billion by 2025. Furthermore, the number of smart city projects in Europe has grown by 25% annually over the past five years.
These statistics underscore the market's continuous evolution and potential for significant growth.
Market Dynamics
Our researchers analyzed the data with 2024 as the base year, along with the key drivers, trends, and challenges. A holistic analysis of drivers will help companies refine their marketing strategies to gain a competitive advantage.
The market is a dynamic and evolving landscape, characterized by the integration of advanced technologies to enhance urban living and promote sustainable development. Central to this transformation are real-time data processing capabilities that optimize energy consumption, enabling cities to reduce environmental footprints and improve public transportation efficiency. For instance, environmental monitoring sensor networks and Smart waste management recycling infrastructure contribute to reducing carbon emissions and minimizing waste. Moreover, smart city infrastructure resilience planning is a critical focus area, with traffic congestion reduction techniques and predictive maintenance machine learning systems playing pivotal roles. Building automation system integration and citizen engagement mobile applications further streamline city operations, while smart street lighting energy savings and air quality monitoring sensor deployment ensure a healthier environment.
Public safety emergency response coordination and Smart Water Management system designs are essential components of a comprehensive smart city strategy. Renewable Energy sources integration and data analytics urban planning applications enable cities to become more sustainable and future-ready. Compared to traditional urban development models, smart cities demonstrate significant progress in adopting advanced technologies. For example, more than 70% of new infrastructure projects in leading smart cities focus on integrating digital twin models and open data platforms for improved decision-making and citizen engagement. Cybersecurity threat mitigation strategies are a crucial consideration in the development of smart cities, as the increasing digitization of urban infrastructure necessitates robust security measures to protect sensitive data and ensure the privacy of citizens.
In summary, The market represents a significant growth opportunity for businesses and governments alike, offering innovative solutions to address pressing urban challenges and create more livable, sustainable, and efficient cities.
What are the key market drivers leading to the rise in the adoption of Smart City Industry?
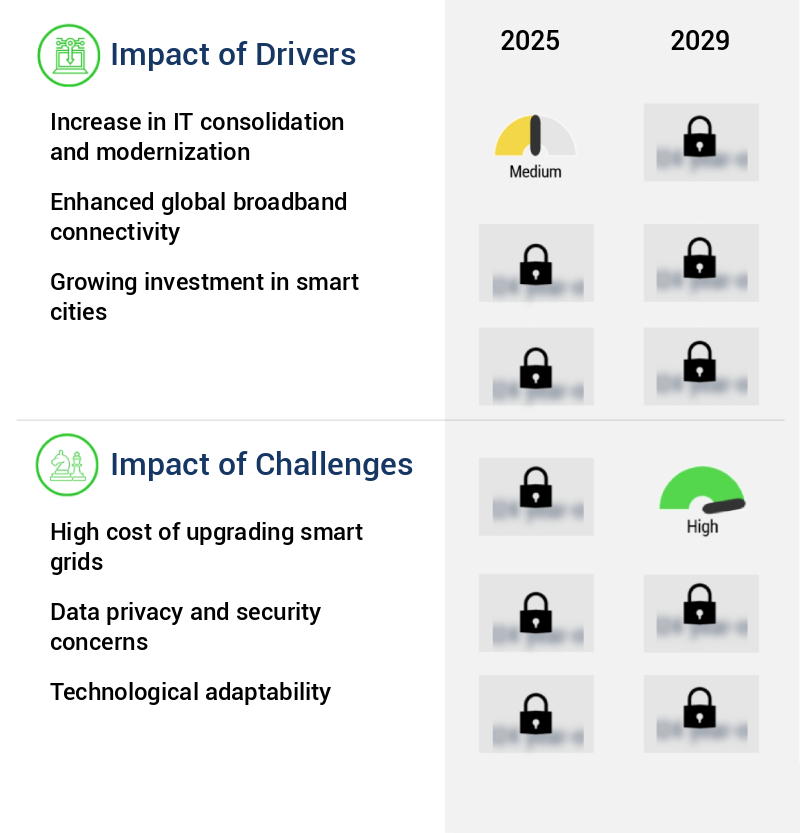
- The mandatory increase in IT consolidation and modernization serves as the primary catalyst for market growth.
- IT consolidations in organizations play a significant role in enhancing operational efficiency and realizing economies of scale. The ongoing trend of IT infrastructure consolidation, encompassing data centers and networking systems, necessitates C-suite executives to adopt advanced IT service delivery models, such as shared and Managed Services. Industry verticals, including manufacturing, BFSI, telecom, and healthcare sectors, are undergoing continuous change and require IT modernization. This modernization, coupled with the increasing popularity of social media and mobile devices, fuels the adoption of IT services and the deployment of smart city projects. These initiatives aim to improve connectivity and promote sustainability.
- The global IT services market experiences dynamic growth, with various factors contributing to its expansion. Technological advancements, the need for IT infrastructure modernization, and the increasing focus on digital transformation across industries are key drivers. Organizations' efforts to streamline operations and improve service delivery further bolster the market's growth. The IT services landscape is characterized by ongoing evolution and innovation, with emerging technologies like cloud computing, artificial intelligence, and the Internet of Things (IoT) shaping the future of the industry.
What are the market trends shaping the Smart City Industry?
- In emerging economies, the trend toward the expansion of smart city projects is gaining momentum.
- In the realm of urban development, smart cities have emerged as a significant trend in developed economies for over a decade. North America and Europe have spearheaded this movement, implementing numerous projects to enhance infrastructure and improve city services through technology. Meanwhile, Asia, with its rapid urban population growth, is witnessing the fastest expansion in smart city technologies. In this region, emerging economies like India and China are actively planning and launching pilot projects. For instance, India's government has announced plans to develop smart cities in 100 locations.
- The global shift towards smart cities signifies a response to the challenges of urbanization, as technology integration enables more efficient city management, improved connectivity, and enhanced quality of life. This transformation is not confined to any specific region but is a global endeavor, with each area contributing unique perspectives and innovations to the evolving smart city landscape.
What challenges does the Smart City Industry face during its growth?
- The escalating costs of upgrading smart grids poses a significant challenge to the growth and development of the industry.
- The market is experiencing significant growth, driven by the increasing adoption of IoT technologies and the need for sustainable urban development. According to recent estimates, the market is projected to expand at a steady pace, with indexed growth in the number of smart cities worldwide. However, the high costs associated with upgrading existing infrastructure, particularly smart grids, pose a challenge. Power utilities and independent power producers face substantial initial capital investments for distribution system upgrades, transmission line replacement, power delivery system modernization, substation digitalization, and digital control implementation. This financial hurdle, a result of the deferred maintenance of aging power infrastructure and the integration of renewable power sources, acts as a barrier to the adoption of smart grid data management solutions.
- Despite these challenges, the ongoing digitization of urban infrastructure and the potential for energy efficiency, improved public services, and enhanced citizen engagement continue to fuel market expansion.
Exclusive Customer Landscape
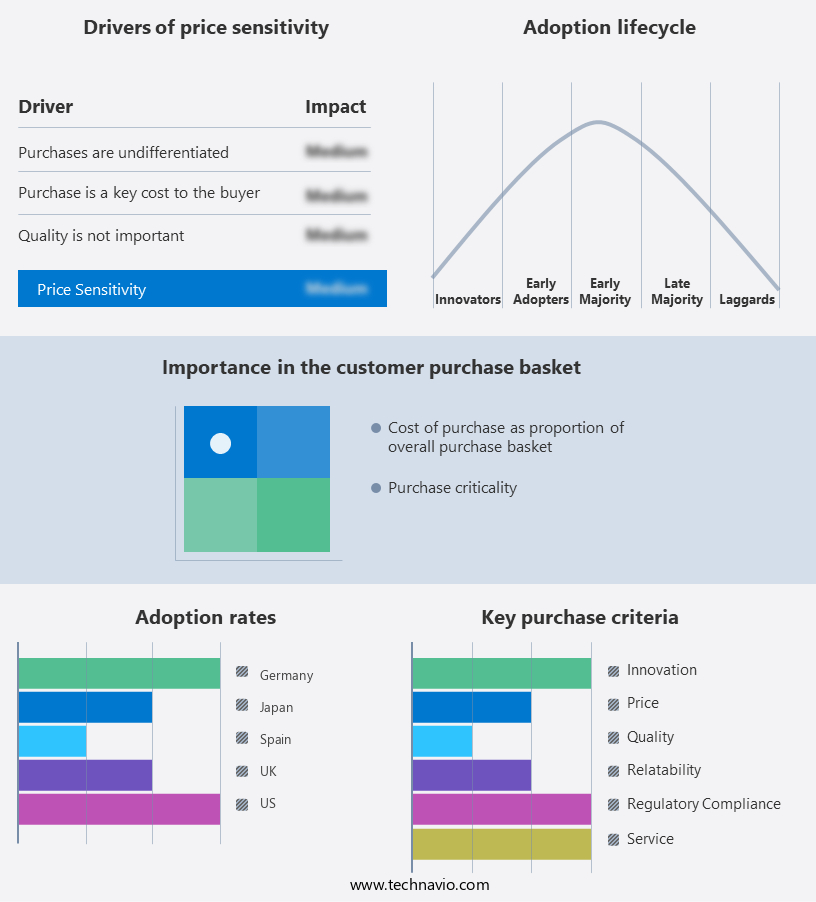
The smart city market forecasting report includes the adoption lifecycle of the market, covering from the innovator's stage to the laggard's stage. It focuses on adoption rates in different regions based on penetration. Furthermore, the smart city market report also includes key purchase criteria and drivers of price sensitivity to help companies evaluate and develop their market growth analysis strategies.
Customer Landscape of Smart City Industry
Competitive Landscape & Market Insights
Companies are implementing various strategies, such as strategic alliances, smart city market forecast, partnerships, mergers and acquisitions, geographical expansion, and product/service launches, to enhance their presence in the industry.
ABB Ltd. - This company specializes in implementing advanced technologies for urban development, focusing on smart buildings, e-mobility, energy management, and data centers. Their innovative solutions enhance city infrastructure and promote sustainable, efficient urban living.
The industry research and growth report includes detailed analyses of the competitive landscape of the market and information about key companies, including:
- ABB Ltd.
- Accenture plc
- Cisco Systems, Inc.
- Ericsson AB
- General Electric Company
- Hitachi, Ltd.
- Honeywell International Inc.
- Huawei Technologies Co., Ltd.
- IBM Corporation
- Intel Corporation
- Microsoft Corporation
- Oracle Corporation
- Qualcomm Incorporated
- Schneider Electric SE
- Siemens AG
- Sprint Corporation (T-Mobile US, Inc.)
- Telefonaktiebolaget LM Ericsson
- Thales Group
- Verizon Communications Inc.
- Vodafone Group Plc
Qualitative and quantitative analysis of companies has been conducted to help clients understand the wider business environment as well as the strengths and weaknesses of key industry players. Data is qualitatively analyzed to categorize companies as pure play, category-focused, industry-focused, and diversified; it is quantitatively analyzed to categorize companies as dominant, leading, strong, tentative, and weak.
Recent Development and News in Smart City Market
- In January 2024, Cisco Systems and IBM announced a strategic partnership to accelerate their smart city offerings. The collaboration aimed to integrate Cisco's IoT technology with IBM's Watson AI platform, enhancing city services and improving citizen experiences (IBM Press Release, 2024).
- In March 2024, Siemens secured a USD1.2 billion contract to modernize the transportation infrastructure in Dubai, marking a significant geographic expansion for the German technology company in the market (Reuters, 2024).
- In April 2025, Intel and Microsoft unveiled their joint venture, "CityNext," to provide cities with a comprehensive smart city solution, integrating IoT, cloud services, and analytics (Microsoft News Center, 2025).
- In May 2025, the European Union passed the "Smart Cities Regulation," investing €12 billion in smart city projects and setting standards for interoperability, data protection, and citizen engagement (European Parliament, 2025).
Dive into Technavio's robust research methodology, blending expert interviews, extensive data synthesis, and validated models for unparalleled Smart City Market insights. See full methodology.
|
Market Scope |
|
|
Report Coverage |
Details |
|
Page number |
218 |
|
Base year |
2024 |
|
Historic period |
2019-2023 |
|
Forecast period |
2025-2029 |
|
Growth momentum & CAGR |
Accelerate at a CAGR of 21.5% |
|
Market growth 2025-2029 |
USD 332.5 billion |
|
Market structure |
Fragmented |
|
YoY growth 2024-2025(%) |
19.4 |
|
Key countries |
US, Canada, Germany, UK, Italy, France, China, India, Japan, Brazil, Egypt, UAE, Oman, Argentina, KSA, UAE, Brazil, and Rest of World (ROW) |
|
Competitive landscape |
Leading Companies, Market Positioning of Companies, Competitive Strategies, and Industry Risks |
Research Analyst Overview
- In the dynamic and ever-evolving realm of smart cities, Artificial Intelligence (AI) applications have become a cornerstone of modern urban infrastructure. Smart Grids Energy and AI collaborate to optimize energy distribution and consumption, while AI-driven Smart Street Lighting adjusts illumination based on real-time traffic patterns. Digital Twin Technology and Transportation Optimization Models leverage AI to simulate city operations, enabling more efficient 5G network deployment and enhancing the performance of Machine Learning Algorithms and Edge Computing. Smart City Infrastructure integrates AI into Emergency Response Systems, Deep Learning Models, and Cybersecurity Infrastructure for improved public safety. Building Automation Systems and Smart Water Management utilize AI for real-time monitoring and optimization, contributing to Sustainable Urban Planning and Open Data Initiatives.
- Environmental Monitoring Sensors, Energy-Efficient Buildings, and Noise Pollution Reduction systems all benefit from AI's ability to analyze vast amounts of data. IoT Sensor Networks, Real-Time Traffic Monitoring, and Public Safety Systems further expand the reach of Ai In Smart Cities. Cloud Computing Platforms and Big Data Analytics process the massive data generated by these systems, powering Smart Parking Solutions, Data Analytics Platforms, and Citizen Engagement Portals. Blockchain Technology and Traffic Management Systems integrate AI for secure data sharing and network virtualization, while Network Virtualization and AI collaborate to optimize city operations and reduce operational costs.
- In the realm of Smart Cities, AI applications are transforming the way we manage and optimize urban infrastructure, driving innovation and efficiency in areas such as energy, transportation, public safety, and environmental management.
What are the Key Data Covered in this Smart City Market Research and Growth Report?
-
What is the expected growth of the Smart City Market between 2025 and 2029?
-
USD 332.5 billion, at a CAGR of 21.5%
-
-
What segmentation does the market report cover?
-
The report segmented by Application (Smart infrastructure, Smart energy, Smart mobility, Smart security, and Others), Component (Hardware, Software, and Services), Geography (Europe, North America, APAC, South America, and Middle East and Africa), Technology (IoT (Internet of Things), AI (Artificial Intelligence), Big Data Analytics, Cloud Computing, Cybersecurity, Communication Technologies (5G, LoRaWAN, NB-IoT), and Sensor Networks), and Industry Vertical (Smart Transportation, Smart Utilities, Smart Buildings, Smart Governance, Smart Healthcare, Smart Education, Smart Public Safety, and Smart Infrastructure)
-
-
Which regions are analyzed in the report?
-
Europe, North America, APAC, South America, and Middle East and Africa
-
-
What are the key growth drivers and market challenges?
-
Increase in IT consolidation and modernization, High cost of upgrading smart grids
-
-
Who are the major players in the Smart City Market?
-
Key Companies ABB Ltd., Accenture plc, Cisco Systems, Inc., Ericsson AB, General Electric Company, Hitachi, Ltd., Honeywell International Inc., Huawei Technologies Co., Ltd., IBM Corporation, Intel Corporation, Microsoft Corporation, Oracle Corporation, Qualcomm Incorporated, Schneider Electric SE, Siemens AG, Sprint Corporation (T-Mobile US, Inc.), Telefonaktiebolaget LM Ericsson, Thales Group, Verizon Communications Inc., and Vodafone Group Plc
-
Market Research Insights
- The market encompasses a range of technologies and solutions designed to optimize urban infrastructure and enhance community living. Two key areas of focus are traffic flow optimization and community engagement tools. According to industry estimates, the global market for intelligent transportation systems is projected to reach USD123.4 billion by 2025, growing at a compound annual growth rate of 13.3% from 2020. In contrast, the market for community engagement platforms is expected to reach USD7.1 billion by 2026, expanding at a CAGR of 15.4% during the same period. These figures underscore the significant potential for growth in both sectors. Environmental impact assessment, infrastructure resilience, and green building technologies are other essential components of the smart city landscape.
- Urban data management, system reliability assessment, and data security protocols are crucial elements ensuring the effective implementation and operation of these advanced solutions. The integration of renewable energy, waste recycling processes, and open data standards further contributes to the sustainability and efficiency of smart cities.
We can help! Our analysts can customize this smart city market research report to meet your requirements.
 RIA -
RIA - 
