
Smart Water Management Market Size 2025-2029
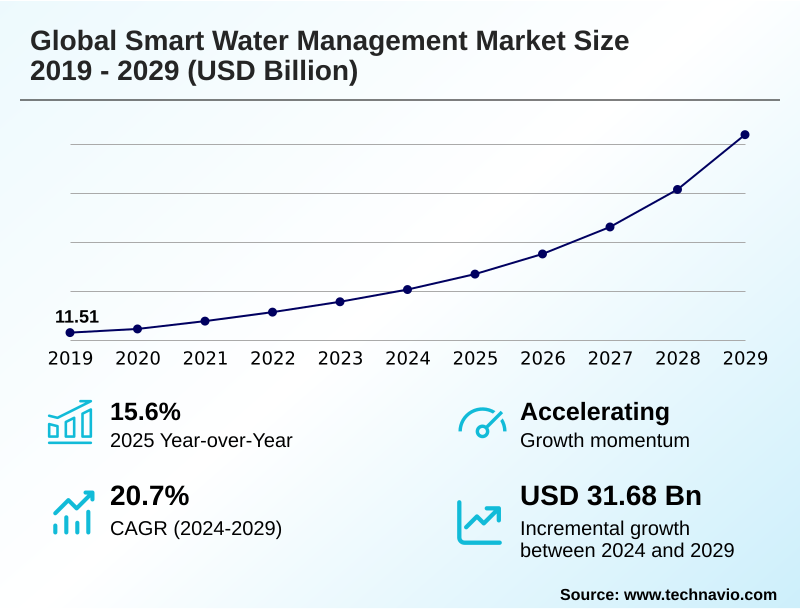
The smart water management market size is valued to increase by USD 31.68 billion, at a CAGR of 20.7% from 2024 to 2029. Growing demand for smart water management in agriculture sector will drive the smart water management market.
Major Market Trends & Insights
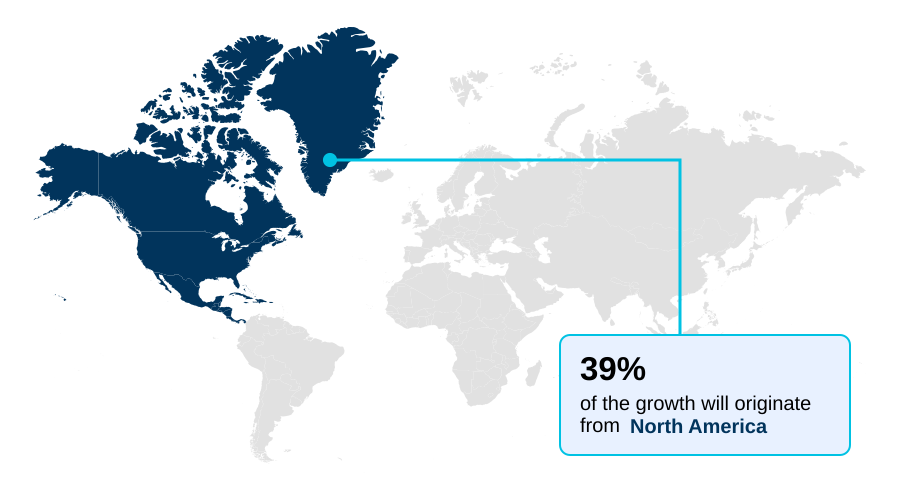
- North America dominated the market and accounted for a 38.8% growth during the forecast period.
- By End-user - Commercial and industrial segment was valued at USD 12.27 billion in 2023
- By Product - Solutions segment accounted for the largest market revenue share in 2023
Market Size & Forecast
- Market Opportunities: USD 40.49 billion
- Market Future Opportunities: USD 31.68 billion
- CAGR from 2024 to 2029 : 20.7%
Market Summary
- The smart water management market is characterized by a significant shift toward digital transformation, driven by global pressures like water scarcity, urbanization, and aging infrastructure. Adopting digital water solutions is no longer optional but essential for ensuring urban water resilience and sustainability.
- This evolution is powered by the convergence of operational technology security with information technology, integrating IoT-enabled sensors and cloud-based data management to create intelligent, responsive networks. For instance, a municipal utility can deploy predictive maintenance algorithms on its SCADA systems integration data to forecast potential pipe failures, reducing non-revenue water reduction and avoiding costly emergency repairs.
- This data-driven approach, supported by real-time monitoring and advanced metering infrastructure, allows for proactive asset performance management and optimized resource allocation optimization. While implementation costs and cybersecurity for water utilities pose challenges, the push for enhanced service reliability enhancement and regulatory compliance continues to fuel market expansion.
- This transition from reactive to predictive operations marks a fundamental change in how water resources are managed globally.
What will be the Size of the Smart Water Management Market during the forecast period?
Get Key Insights on Market Forecast (PDF) Get Free Sample
How is the Smart Water Management Market Segmented?
The smart water management industry research report provides comprehensive data (region-wise segment analysis), with forecasts and estimates in "USD million" for the period 2025-2029, as well as historical data from 2019-2023 for the following segments.
- End-user
- Commercial and industrial
- Residential
- Product
- Solutions
- Hardware
- Services
- Technology
- IoT
- Big data and analytics
- Cloud computing
- AI
- Geography
- North America
- US
- Canada
- Mexico
- Europe
- UK
- France
- Germany
- APAC
- China
- India
- Japan
- South America
- Brazil
- Argentina
- Colombia
- Middle East and Africa
- Saudi Arabia
- UAE
- South Africa
- Rest of World (ROW)
- North America
By End-user Insights
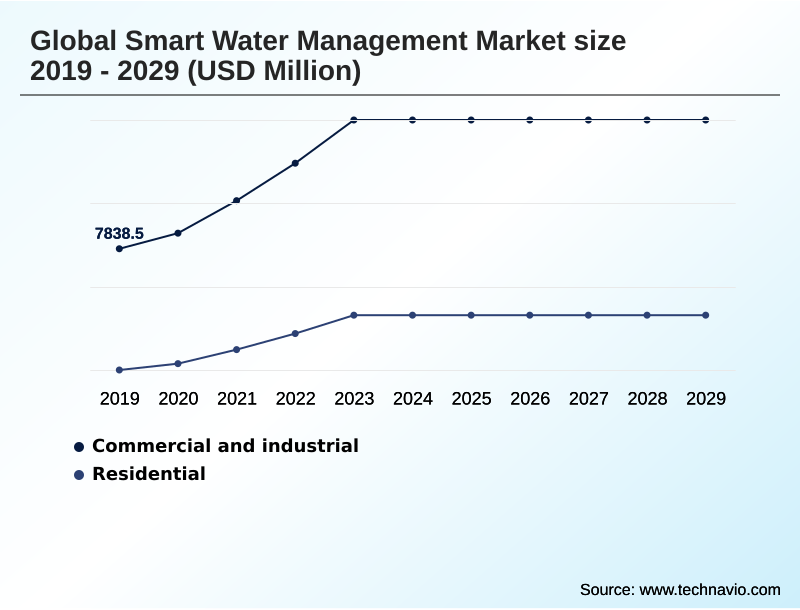
The commercial and industrial segment is estimated to witness significant growth during the forecast period.
The commercial and industrial segment is increasingly adopting sophisticated systems for data-driven decision making to meet stringent environmental stewardship goals. These entities leverage centralized control platforms and edge computing in water to achieve significant operational efficiency improvement.
By implementing precise water quality monitoring and demand forecasting, facilities can optimize consumption and ensure regulatory compliance reporting.
Advanced water balance analysis and automated billing systems enable a granular understanding of usage patterns, supporting targeted water conservation programs and water footprint reduction.
This proactive approach, driven by robust asset performance management, is redefining resource management across retail, healthcare, and manufacturing, with some facilities reporting a 15% improvement in leak detection accuracy.
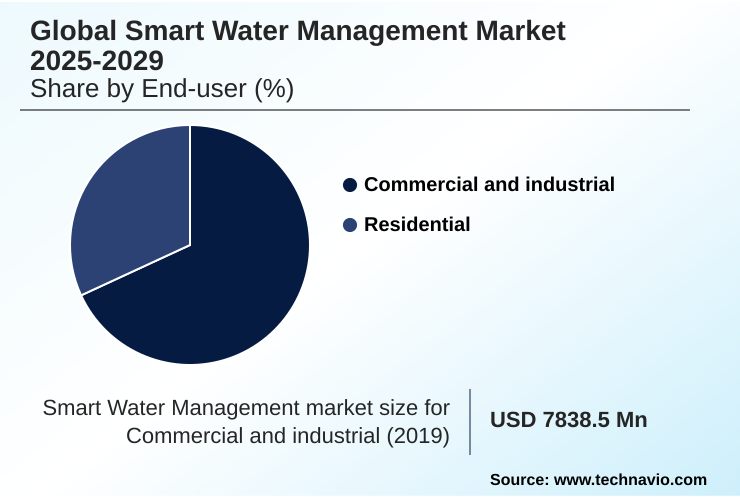
The Commercial and industrial segment was valued at USD 12.27 billion in 2023 and showed a gradual increase during the forecast period.
Regional Analysis
North America is estimated to contribute 38.8% to the growth of the global market during the forecast period.Technavio’s analysts have elaborately explained the regional trends and drivers that shape the market during the forecast period.
See How Smart Water Management Market Demand is Rising in North America Get Free Sample
Geographically, the market landscape is led by North America, which accounts for nearly 39% of the incremental growth, driven by aggressive aging infrastructure replacement programs and smart city water initiatives.
Utilities in this region are prioritizing water grid modernization through significant capital improvement planning, deploying smart metering solutions that provide real-time data collection on consumption. This enables superior integrated water resource management.
In contrast, Europe focuses on regulatory-driven adoption for urban water resilience, using real-time monitoring and advanced GIS mapping.
The integration of SCADA systems integration with flow rate sensors is becoming standard, with some municipalities achieving a 25% improvement in network visibility. Meanwhile, APAC is emerging as a high-growth area, adopting decentralized water systems to address rapid urbanization.
Market Dynamics
Our researchers analyzed the data with 2024 as the base year, along with the key drivers, trends, and challenges. A holistic analysis of drivers will help companies refine their marketing strategies to gain a competitive advantage.
- Strategic implementation across the global smart water management market 2025-2029 hinges on leveraging advanced technologies to solve critical operational challenges. The use of IoT sensors for pipeline monitoring provides unprecedented visibility into distribution networks, which is a core component of modern water infrastructure.
- When coupled with AI in predictive water analytics, utilities can move from reactive repairs to proactive asset management. A primary business objective is reducing non-revenue water costs, which is directly addressed by deploying smart metering for urban utilities. These systems feed data into cloud platforms for water data, enabling comprehensive analysis and billing.
- For network operators, GIS integration for network visibility is crucial, as it overlays real-time data onto geographic maps, while real-time water quality alerts ensure public safety and regulatory compliance. The effectiveness of automated leak detection technology has improved significantly, with some systems demonstrating a 40% faster detection time compared to manual methods.
- This operational efficiency is further enhanced by SCADA systems for process control and demand forecasting for water distribution, which help balance supply and demand. Effective asset performance management software extends the life of critical components. As networks become more connected, addressing cybersecurity in water infrastructure is paramount.
- Advanced techniques like creating a digital twin for hydraulic modeling allow for simulation and scenario planning without impacting live operations. In agriculture, smart irrigation for agriculture optimizes water use for crop production. Ultimately, advanced analytics for water utilities and the remote monitoring of water assets empower decision-makers.
- This includes optimizing chemical dosing in treatment processes and ensuring seamless data integration for water management, supported by mobile solutions for field operators to streamline onsite tasks.
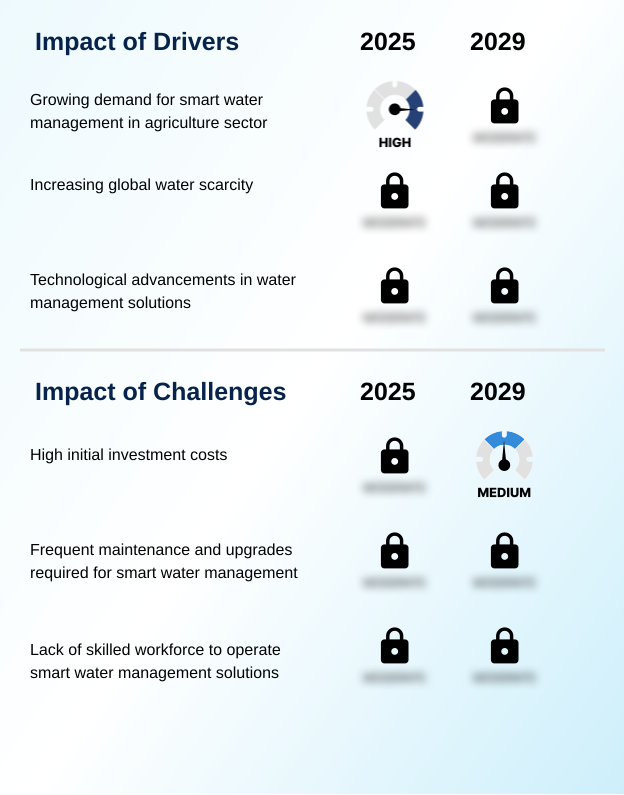
What are the key market drivers leading to the rise in the adoption of Smart Water Management Industry?
- Growing demand for smart water management solutions within the agriculture sector serves as a key driver for market growth.
- A primary driver is the intense focus on non-revenue water reduction and resource allocation optimization, prompted by both economic and environmental pressures. The implementation of advanced metering infrastructure allows utilities to reduce unaccounted-for-water by an average of 18%.
- This investment in sustainable water infrastructure is critical for aging infrastructure replacement programs.
- Furthermore, the water-energy nexus is compelling operators to pursue wastewater treatment optimization and energy consumption optimization, with some plants cutting energy use by 25% through automated control systems. In agriculture, the demand for precision agriculture irrigation drives adoption.
- These efforts are underpinned by circular economy principles and the need for accurate regulatory compliance reporting, making leak detection systems an essential technology.
What are the market trends shaping the Smart Water Management Industry?
- The integration of IoT is a significant upcoming trend in smart water management. This shift enables advanced monitoring and data-driven optimization of water resources.
- A key trend is the adoption of the digital twin for water networks, which uses hydraulic modeling and network modeling to simulate operations and test scenarios, improving planning accuracy by over 30%. This approach supports proactive maintenance scheduling and comprehensive asset lifecycle management.
- The deployment of IoT-enabled sensors within these cyber-physical systems enables anomaly detection in real-time, which is crucial for service reliability enhancement. Predictive maintenance algorithms analyze this data to identify potential failures before they occur, reducing unplanned downtime by up to 40%.
- This shift towards digital water solutions and remote operational control is also enabling the effective management of decentralized water systems in remote or newly developed areas.
What challenges does the Smart Water Management Industry face during its growth?
- The high initial investment costs associated with implementation represent a key challenge affecting industry growth.
- Significant challenges persist, particularly around operational technology security and the high upfront costs associated with large-scale deployment, which often require public-private partnerships to fund capital improvement planning. Ensuring robust cybersecurity for water utilities is a non-negotiable aspect of adopting cloud-based data management and connected data analytics platforms.
- The complexity of integrating new systems, such as those for acoustic leak detection or pressure monitoring, with legacy infrastructure can delay projects. Moreover, a skilled labor gap impacts the ability to manage mobile workforce management tools and perform remote diagnostics effectively.
- While smart irrigation controllers and stakeholder engagement platforms that provide customer consumption insights improve end-user adoption, their deployment at scale remains a hurdle, with full integration sometimes taking 2-3 years longer than initially projected.
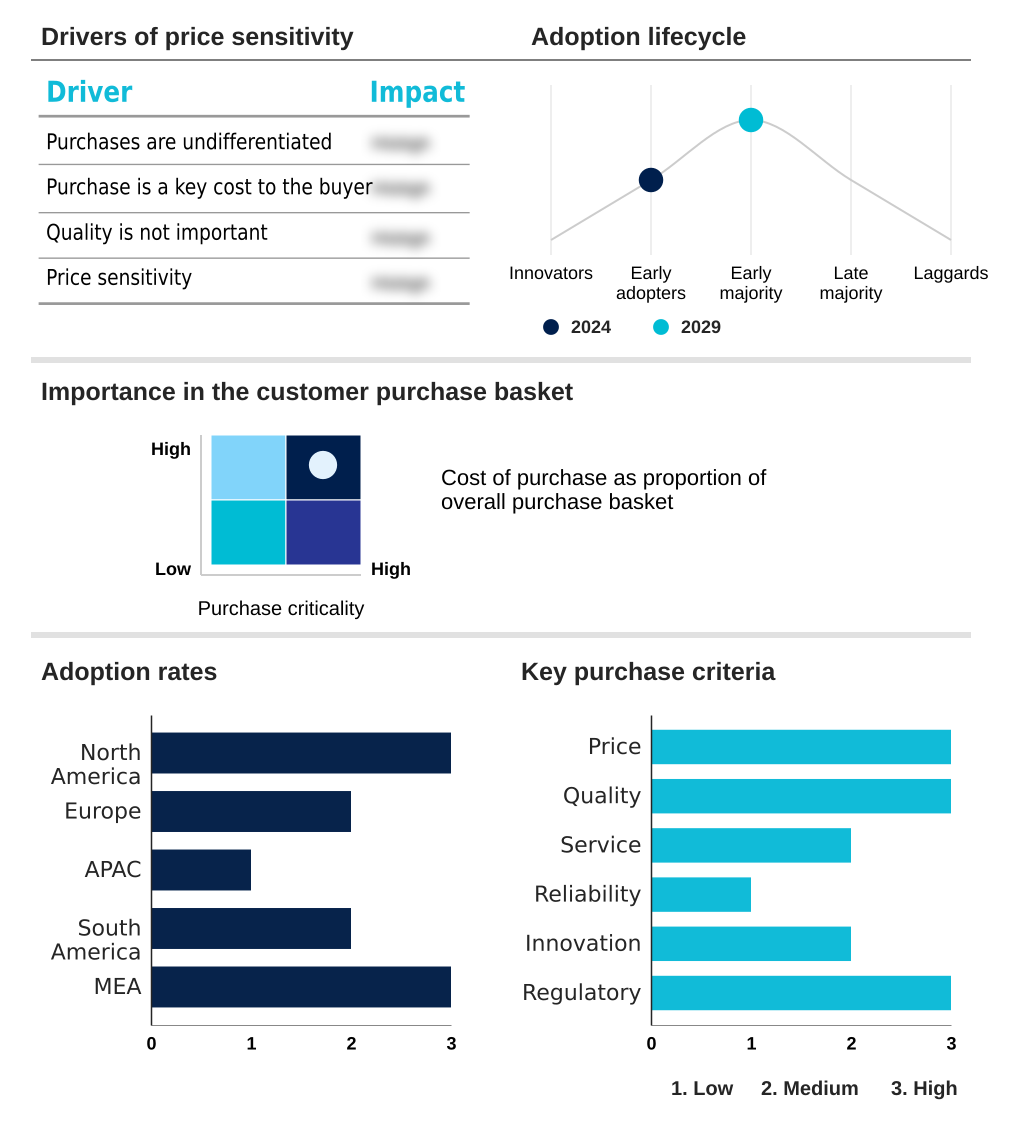
Exclusive Technavio Analysis on Customer Landscape
The smart water management market forecasting report includes the adoption lifecycle of the market, covering from the innovator’s stage to the laggard’s stage. It focuses on adoption rates in different regions based on penetration. Furthermore, the smart water management market report also includes key purchase criteria and drivers of price sensitivity to help companies evaluate and develop their market growth analysis strategies.
Customer Landscape of Smart Water Management Industry
Competitive Landscape
Companies are implementing various strategies, such as strategic alliances, smart water management market forecast, partnerships, mergers and acquisitions, geographical expansion, and product/service launches, to enhance their presence in the industry.
ABB Ltd. - Automated, electrified, and digitized solutions optimize water and wastewater infrastructure, enhancing plant control, operational efficiency, and sustainable resource management.
The industry research and growth report includes detailed analyses of the competitive landscape of the market and information about key companies, including:
- ABB Ltd.
- Aquamatix Ltd.
- Badger Meter Inc.
- Cisco Systems Inc.
- General Electric Co.
- Honeywell International Inc.
- HydroPoint Data Systems Inc.
- IBM Corp.
- Itron Inc.
- Landis Gyr AG
- Oracle Corp.
- Schneider Electric SE
- Siemens AG
- SUEZ SA
- TAKADU LTD.
Qualitative and quantitative analysis of companies has been conducted to help clients understand the wider business environment as well as the strengths and weaknesses of key industry players. Data is qualitatively analyzed to categorize companies as pure play, category-focused, industry-focused, and diversified; it is quantitatively analyzed to categorize companies as dominant, leading, strong, tentative, and weak.
Recent Development and News in Smart water management market
- In May 2025, Siemens AG announced the launch of its Aqua-Verse platform, a suite of AI-driven analytics tools designed to optimize energy consumption in wastewater treatment plants by up to 15%, according to company reports.
- In March 2025, Itron Inc. and Cisco Systems Inc. formed a strategic alliance to integrate Itron's smart metering technology with Cisco's secure IoT networking infrastructure, aiming to provide utilities a unified, end-to-end solution for grid modernization.
- In December 2024, Schneider Electric SE completed its acquisition of HydroPoint Data Systems Inc., a specialist in smart irrigation control, to strengthen its portfolio of water conservation solutions for commercial and residential applications.
- In September 2024, SUEZ SA secured a multi-year contract with a major European municipality to deploy a city-wide smart water network, a project supported by a new government initiative promoting digital transformation in public utilities to combat water scarcity.
Dive into Technavio’s robust research methodology, blending expert interviews, extensive data synthesis, and validated models for unparalleled Smart Water Management Market insights. See full methodology.
| Market Scope | |
|---|---|
| Page number | 288 |
| Base year | 2024 |
| Historic period | 2019-2023 |
| Forecast period | 2025-2029 |
| Growth momentum & CAGR | Accelerate at a CAGR of 20.7% |
| Market growth 2025-2029 | USD 31684.4 million |
| Market structure | Fragmented |
| YoY growth 2024-2025(%) | 15.6% |
| Key countries | US, Canada, Mexico, UK, France, Germany, Italy, The Netherlands, Spain, China, India, Japan, South Korea, Australia, Indonesia, Brazil, Argentina, Colombia, Saudi Arabia, UAE, South Africa, Israel and Turkey |
| Competitive landscape | Leading Companies, Market Positioning of Companies, Competitive Strategies, and Industry Risks |
Research Analyst Overview
- The market is defined by a fundamental transition toward intelligent infrastructure, driven by the need for enhanced operational oversight. The deployment of IoT-enabled sensors facilitates real-time data collection and real-time monitoring, which are foundational to modern digital water solutions.
- This data flows into data analytics platforms that utilize predictive maintenance algorithms and hydraulic modeling to improve demand forecasting and asset performance management.
- For boardroom consideration, the integration of these technologies directly impacts capital expenditure planning; water grid modernization projects that incorporate advanced metering infrastructure and acoustic leak detection can defer major capital works by demonstrating a 20% extension in asset lifespan. Core operational tools include SCADA systems integration for process control and GIS mapping for network visualization.
- The goal of non-revenue water reduction is achieved through precise water balance analysis and leak detection systems. Efficiency is further gained through wastewater treatment optimization and energy consumption optimization, managed via centralized control platforms.
- Technologies like smart irrigation controllers, automated billing systems, flow rate sensors, and pressure monitoring extend these benefits to end-users and specific applications, while edge computing in water ensures rapid, localized decision-making. Ensuring operational technology security across these cyber-physical systems is a critical and ongoing priority for maintaining system integrity and public trust.
What are the Key Data Covered in this Smart Water Management Market Research and Growth Report?
-
What is the expected growth of the Smart Water Management Market between 2025 and 2029?
-
USD 31.68 billion, at a CAGR of 20.7%
-
-
What segmentation does the market report cover?
-
The report is segmented by End-user (Commercial and industrial, and Residential), Product (Solutions, Hardware, and Services), Technology (IoT, Big data and analytics, Cloud computing, and AI) and Geography (North America, Europe, APAC, South America, Middle East and Africa)
-
-
Which regions are analyzed in the report?
-
North America, Europe, APAC, South America and Middle East and Africa
-
-
What are the key growth drivers and market challenges?
-
Growing demand for smart water management in agriculture sector, High initial investment costs
-
-
Who are the major players in the Smart Water Management Market?
-
ABB Ltd., Aquamatix Ltd., Badger Meter Inc., Cisco Systems Inc., General Electric Co., Honeywell International Inc., HydroPoint Data Systems Inc., IBM Corp., Itron Inc., Landis Gyr AG, Oracle Corp., Schneider Electric SE, Siemens AG, SUEZ SA and TAKADU LTD.
-
Market Research Insights
- The dynamics of the market are shaped by a strategic push toward sustainable water infrastructure and resilient infrastructure planning. Public-private partnerships are accelerating the adoption of advanced technologies, with projects demonstrating up to a 20% reduction in water loss through proactive management.
- Data-driven decision making is central to this shift, enabling utilities to improve operational efficiency improvement by 15% compared to legacy systems. As urbanization pressure mitigation becomes a priority, cities are implementing comprehensive climate adaptation strategies and water conservation programs.
- These initiatives leverage customer consumption insights to enhance stakeholder engagement platforms, fostering a more collaborative approach to resource management and achieving long-term environmental stewardship goals.
We can help! Our analysts can customize this smart water management market research report to meet your requirements.
 RIA -
RIA - 
