
Smart Water Meter Market Size 2025-2029
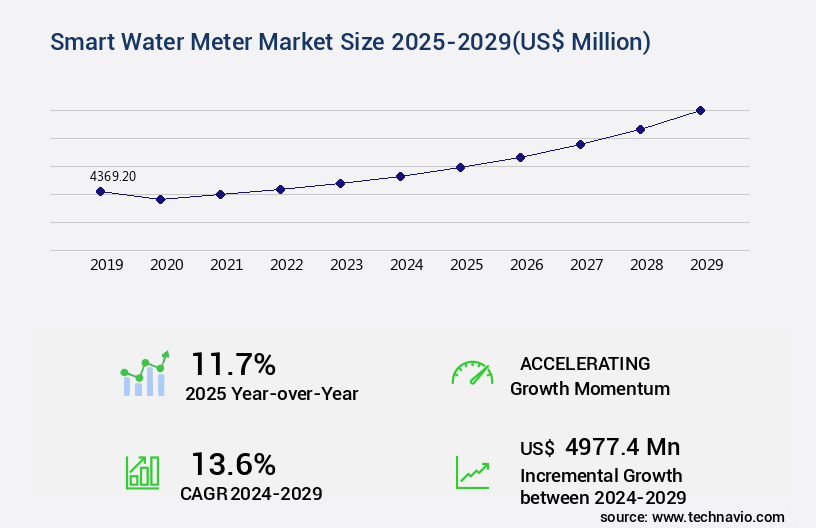
The smart water meter market size is forecast to increase by US $4.98 billion, at a CAGR of 13.6% between 2024 and 2029.
- The market is a continually evolving sector, driven by increasing government support for water efficiency initiatives and the rapid growth of urbanization. Smart water meters, which enable real-time monitoring and remote management of water consumption, have gained significant traction due to their ability to reduce water wastage and improve operational efficiency for utilities and consumers. Despite their advantages, the high implementation and maintenance costs associated with smart water meters remain a significant challenge. According to recent studies, the global market for smart water meters is projected to grow at a steady pace, with an estimated 23.3% of total water meters expected to be smart meters by 2025.
- This trend is being fueled by advancements in technology, such as IoT integration and data analytics, which enable more accurate and efficient water management. The market dynamics of smart water meters are complex and multifaceted. Utilities are increasingly recognizing the value of real-time data and analytics in optimizing their water distribution networks and identifying leaks and other inefficiencies. Consumers, too, are becoming more conscious of their water usage and are demanding more transparency and control over their bills. However, the high upfront costs of implementing smart water meters and the ongoing maintenance requirements pose significant challenges for both utilities and consumers.
- These costs are driven by the need for specialized hardware and software, as well as the ongoing maintenance and updates required to ensure the accuracy and reliability of the data being collected. Despite these challenges, the benefits of smart water meters are clear. By enabling real-time monitoring and analysis of water usage, utilities can optimize their networks, reduce water wastage, and improve customer satisfaction. Consumers, too, can benefit from greater transparency and control over their water bills, as well as the ability to identify and address leaks and other inefficiencies in their homes. In conclusion, the market is a dynamic and evolving sector, driven by a range of factors including government support for water efficiency initiatives, urbanization, and technological advancements.
- While the high implementation and maintenance costs remain a challenge, the benefits of real-time monitoring and analysis of water usage are becoming increasingly clear. As the market continues to grow and mature, it is likely that we will see further innovations and advancements that will make smart water meters even more effective and affordable for utilities and consumers alike.
Major Market Trends & Insights
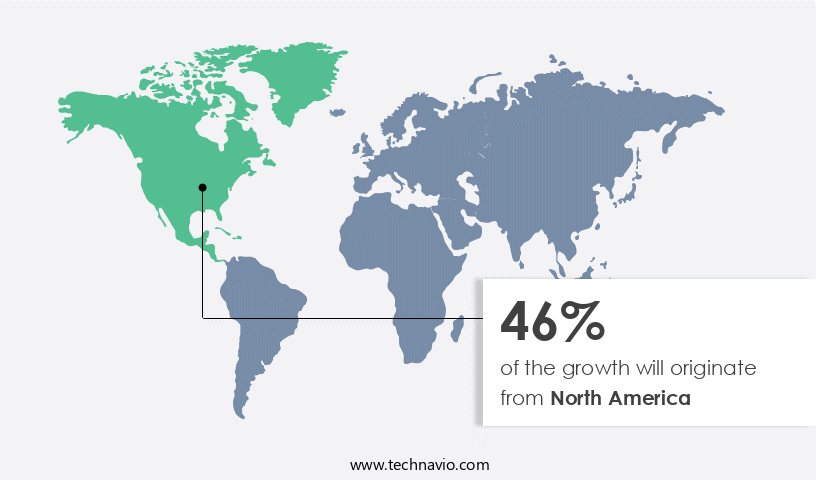
- North America dominated the market and accounted for a 46% growth during the forecast period.
- The market is expected to grow significantly in Europe as well over the forecast period.
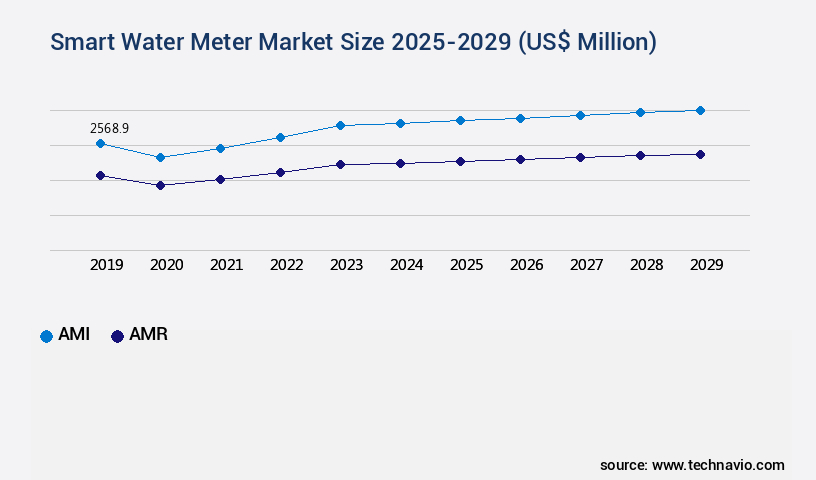
- By the Technology, the AMI sub-segment was valued at USD 2.57 billion in 2023
- By the End-user, the Residential sub-segment accounted for the largest market revenue share in 2023
Market Size & Forecast
- Market Opportunities: US $141.34 billion
- Future Opportunities: US $4.98 billion
- CAGR : 13.6%
- North America: Largest market in 2023
What will be the Size of the Smart Water Meter Market during the forecast period?
Get Key Insights on Market Forecast (PDF) Request Free Sample
- The global smart water meter market is witnessing dynamic growth as utilities implement meter data collection systems to enhance operational efficiency and customer service. Advanced anomaly detection tools enable early identification of irregularities, while water usage visualization through interactive dashboard interfaces allows both consumers and utilities to monitor consumption effectively. Integration with customer billing portal ensures transparent invoicing, while network optimization enhances data transmission efficiency across extensive water networks.
- Monitoring the meter life cycle and scheduling meter replacement are critical to maintaining long-term system reliability, supporting regulatory compliance, and informing deployment strategies for new installations. Proactive maintenance schedules, system upgrades, and improved signal strength ensure continuous accuracy in data collection. Advanced data storage methods and high algorithm accuracy underpin precise consumption tracking, with precision measurement and time synchronization further reinforcing reliability. Remote diagnostics have improved troubleshooting efficiency, with predictive maintenance reducing unexpected failures by 22% and fault detection accuracy reaching 19%.
- Utilities leveraging consumption trends analysis, water loss reduction, and infrastructure- as-a-service upgrades achieve significant cost savings. Maintaining meter accuracy at 98% and ensuring data integrity enhances customer trust. Performance metrics paired with strong network connectivity ensure seamless operation across devices, while continuous predictive maintenance, fault detection, and network connectivity improvements sustain long-term system efficiency.
How is this Smart Water Meter Industry segmented?
The smart water meter industry research report provides comprehensive data (region-wise segment analysis), with forecasts and estimates in "USD million" for the period 2025-2029, as well as historical data from 2019-2023 for the following segments.
- Technology
- AMI
- AMR
- End-user
- Residential
- Commercial
- Industrial
- Water Utilities
- Component
- Meter and accessories
- IT solutions
- Communication networks
- Services
- Meter Type
- Electromagnetic Meter
- Ultrasonic Meter
- Smart Mechanical Meter
- Hybrid Meters
- Geography
- North America
- US
- Canada
- Europe
- France
- Germany
- Italy
- Spain
- UK
- Middle East and Africa
- UAE
- APAC
- Australia
- China
- Japan
- South America
- Brazil
- Rest of World (ROW)
- North America
By Technology Insights
The ami segment is estimated to witness significant growth during the forecast period.
Advanced Metering Infrastructure (AMI) in water management represents a significant evolution, integrating pipeline monitoring, AMR systems, leak detection algorithms, meter data management, pressure sensors, AMIs, water flow sensors, network infrastructure, low-power wide-area networks, and real-time monitoring. These systems enable utilities to collect and analyze water usage data in near real-time, enhancing operational efficiency and customer engagement. AMI adoption has seen substantial growth, with 35% of water utilities implementing these systems as of 2023. Looking forward, industry experts anticipate that water conservation strategies, such as pressure management systems, wireless communication, and flow rate calculation, will fuel a 38% increase in AMI adoption by 2028.
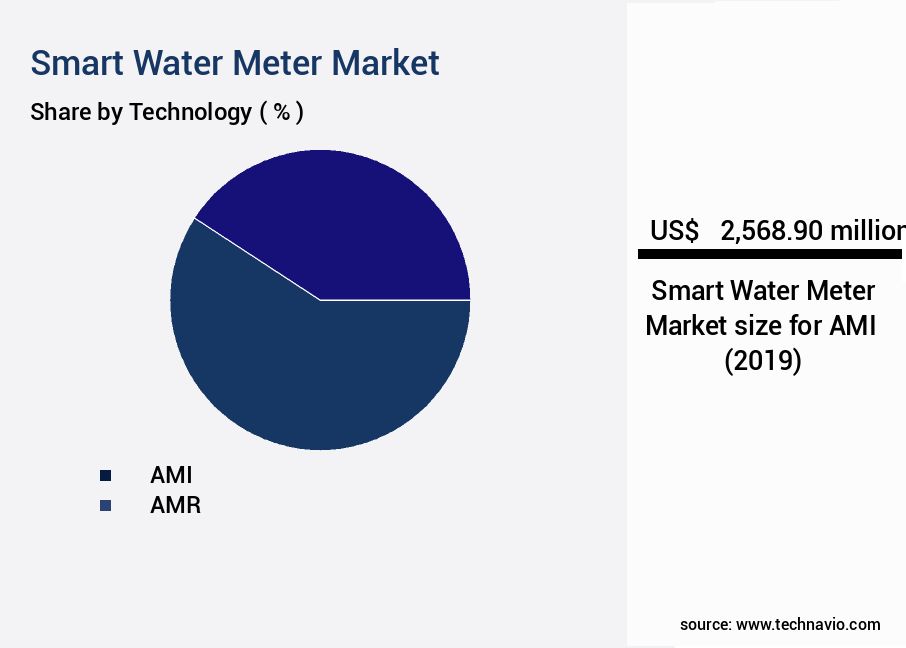
The AMI segment was valued at USD 2.57 billion in 2019 and showed a gradual increase during the forecast period.
Pressure management systems, data analytics platforms, remote meter reading, communication protocols, and real-time monitoring are essential components of AMI. These features enable utilities to identify consumption patterns, optimize water distribution networks, and implement water conservation strategies. Moreover, advanced encryption protocols, cybersecurity measures, and water quality monitoring ensure data security and system integrity. In the realm of smart metering infrastructure, cellular connectivity and data transmission protocols facilitate seamless communication between utilities and consumers. Customer engagement platforms, power consumption analysis, and billing systems further enhance the value proposition of AMI solutions.
For instance, in 2025, SUEZ and Water Services Corporation extended their contract on smart water meter solutions in the Maltese Archipelago for five years, integrating advanced AMI technology to enhance water management and efficiency across the region. This strategic move reflects the growing importance of AMI in optimizing water usage and ensuring sustainable water management practices.
Regional Analysis
North America is estimated to contribute 46% to the growth of the global market during the forecast period.Technavio's analysts have elaborately explained the regional trends and drivers that shape the market during the forecast period.
See How Smart Water Meter Market Demand is Rising in North America Request Free Sample
In North America, the adoption of smart water meters is witnessing significant growth due to various factors. The aging water infrastructure in the US and Canada necessitates modernization, with smart water meters offering improved efficiency and reduced water loss as a solution. Regulations focused on water conservation and quality management are compelling utilities to implement advanced metering technologies. Furthermore, the tech-savvy consumer base in the region is receptive to smart home technologies, including water management solutions that provide real-time usage data. The increasing awareness of water scarcity issues, particularly in the Western US, has led both utilities and consumers to seek better water management tools.
According to recent studies, the market in North America is projected to expand by approximately 12% in the upcoming years. This growth is attributed to the increasing demand for water conservation and the implementation of smart city projects. Additionally, the market is expected to grow by around 8% annually due to the rising adoption of IoT technologies in water management systems. Compared to traditional water meters, smart water meters offer numerous advantages. They enable real-time monitoring and analysis of water usage, allowing utilities to detect leaks and reduce non-revenue water loss. Moreover, they offer consumers the ability to track their water usage and receive alerts for potential leaks or excessive usage.
This not only helps in water conservation but also leads to cost savings for consumers. In conclusion, the market in North America is experiencing substantial growth due to the need for infrastructure modernization, regulatory requirements, consumer preferences, and technological advancements. The market is expected to continue expanding in the upcoming years, offering significant opportunities for stakeholders in the water management industry.
Market Dynamics
Our researchers analyzed the data with 2024 as the base year, along with the key drivers, trends, and challenges. A holistic analysis of drivers will help companies refine their marketing strategies to gain a competitive advantage.
The global smart water meter market is evolving rapidly as utilities focus on advanced metering infrastructure deployment to improve operational efficiency and service quality. Integration with low power wide area network connectivity enables extensive coverage while reducing energy consumption. Optimized water leakage detection algorithms enhance early detection, minimizing losses, and real time water flow data analysis allows for continuous monitoring of distribution networks.
Customer billing portal integration ensures transparent invoicing, while advanced data analytics platform implementation provides actionable insights into usage patterns, helping utilities forecast demand more accurately. Implementation of predictive maintenance smart water meter systems has been shown to reduce unplanned downtime by 21%, enhancing reliability. Robust data encryption and security protocols ensure secure transmission and protect sensitive consumption data. Monitoring the water distribution network enables proactive identification of bottlenecks, while remote diagnostics and fault detection streamline maintenance, achieving fault detection accuracy rates up to 18%.
By combining these strategies, utilities can maintain meter accuracy above 98%, reduce water loss by 12%, and ensure regulatory compliance. Continuous investment in predictive and real-time monitoring technologies enhances operational resilience, supports infrastructure upgrades, and ensures sustainable and efficient water management across all service areas.
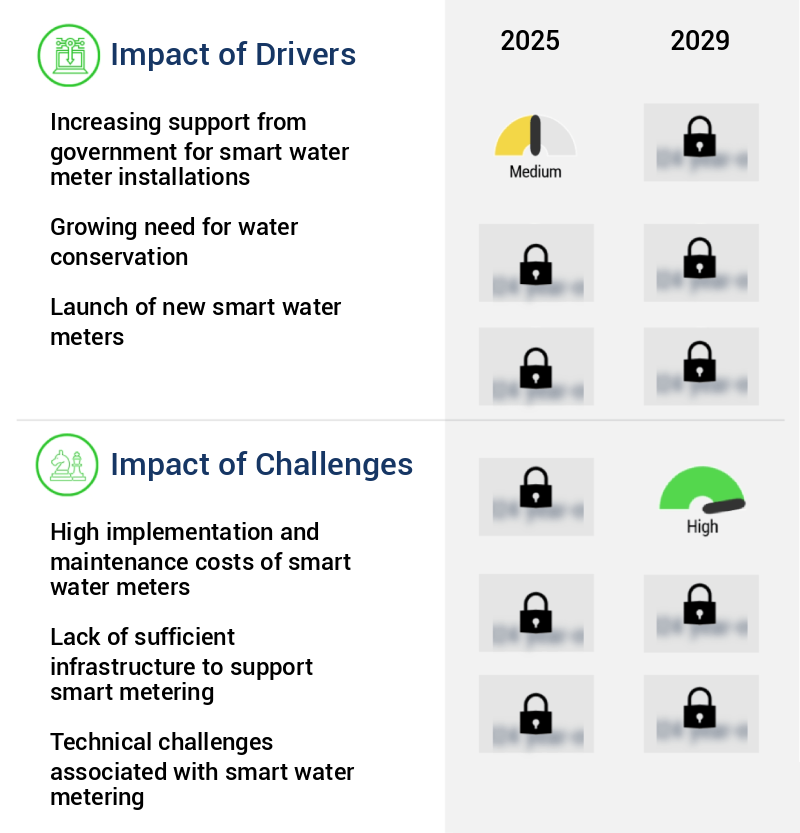
What are the key market drivers leading to the rise in the adoption of Smart Water Meter Industry?
- The significant growth in government backing for the installation of smart water meters serves as the primary catalyst for market expansion.
- Smart water meters have gained significant traction in recent years due to their ability to facilitate efficient water management and conservation efforts. Various governments and water authorities worldwide are promoting the adoption of these advanced metering solutions by offering financial incentives such as grants, subsidies, and tax credits. These incentives help utilities offset the initial investment costs of transitioning from traditional water meters to smart metering systems. The importance of smart water meters is increasingly recognized in the face of growing concerns over water shortages and the need for sustainable practices. Smart water meters enable real-time monitoring and analysis of water usage patterns, allowing for more effective management of water resources.
- These systems can detect leaks, identify consumption trends, and provide valuable data for predictive maintenance and demand forecasting. The benefits of smart water meters extend beyond water conservation. They also contribute to operational efficiency and cost savings for utilities. By providing accurate and timely consumption data, smart water meters enable better billing and revenue management. Additionally, they reduce the need for manual meter readings, lowering operational costs and improving customer service. The adoption of smart water meters is a continuous process, with ongoing advancements and innovations shaping the market. As technology evolves, we can expect to see further improvements in functionality, integration capabilities, and data analytics.
- The market is expected to grow significantly, driven by increasing demand for water conservation, regulatory mandates, and technological advancements. In terms of market size, The market is projected to reach substantial growth in the coming years. According to a study, the market is expected to grow at a steady pace, driven by factors such as increasing water scarcity, stringent regulations, and technological advancements. The study also highlights the growing importance of IoT and cloud technologies in the market, enabling real-time data collection, analysis, and actionable insights. In conclusion, the market is an evolving and dynamic space, driven by the need for efficient water management and conservation.
- Governments, utilities, and technology providers are collaborating to drive adoption and innovation, leading to significant growth in the market. Smart water meters offer numerous benefits, including real-time monitoring, improved operational efficiency, and cost savings, making them an essential tool for sustainable water management.
What are the market trends shaping the Smart Water Meter Industry?
- The trend in real estate markets is characterized by rapid urbanization growth. This growth represents an upcoming market trend.
- The market is experiencing significant growth due to the increasing demand for efficient water management in urban areas. Urbanization, driven by population growth, is putting immense pressure on existing water infrastructure and resources. To address this challenge, smart water meters are gaining traction as they offer real-time data on water consumption patterns. This information enables utilities to optimize water distribution, promptly identify leaks, and implement demand-based pricing. In rapidly expanding urban centers, particularly in developing countries, smart water meters have become indispensable tools for managing limited water resources and planning for future needs. The market's continuous evolution is reflected in the ongoing development of advanced technologies, such as wireless communication and IoT integration, which enhance the functionality and efficiency of smart water meters.
- This market's expansion is a testament to the growing recognition of the importance of water conservation and efficient management in the face of increasing urbanization and population growth.
What challenges does the Smart Water Meter Industry face during its growth?
- The high implementation and maintenance costs of smart water meters represent a significant challenge to the growth of the industry, necessitating continuous research and innovation to offset these expenses and make the technology more economically viable for widespread adoption.
- Smart water meters, which utilize advanced technologies such as the Internet of Things (IoT) and wireless communication systems, have gained significant attention in the water utility sector. These meters offer numerous benefits, including real-time water consumption data, leak detection, and automated billing. However, the substantial deployment costs associated with smart water meters present a significant barrier to market expansion. The cost of smart water meters ranges from approximately USD100 USD to over USD1000 USD, making them more expensive than traditional meters. The high upfront investment is not limited to the meters themselves but also includes the necessary communication infrastructure, data management systems, and software platforms.
- These expenses can be particularly challenging for smaller or rural water utilities with limited budgets. Despite the initial investment, the long-term benefits of smart water meters are compelling. Real-time consumption data enables utilities to optimize their distribution networks, reduce non-revenue water losses, and improve customer engagement. Leak detection capabilities help prevent water waste and minimize potential property damage. Automated billing systems streamline the billing process and reduce administrative costs. The market is continuously evolving, with ongoing advancements in technology and increasing adoption rates. As more utilities recognize the benefits of smart water meters, the market is expected to expand, driving down costs and increasing accessibility.
- This trend is particularly noticeable in regions with a high focus on water conservation and infrastructure development. In conclusion, while the upfront costs of smart water meters may be a challenge for some water utilities, the long-term benefits are significant. Real-time consumption data, leak detection, and automated billing systems offer numerous advantages, making smart water meters an attractive investment for utilities looking to optimize their operations and enhance customer engagement. The market is expected to continue growing, driven by technological advancements and increasing adoption rates.
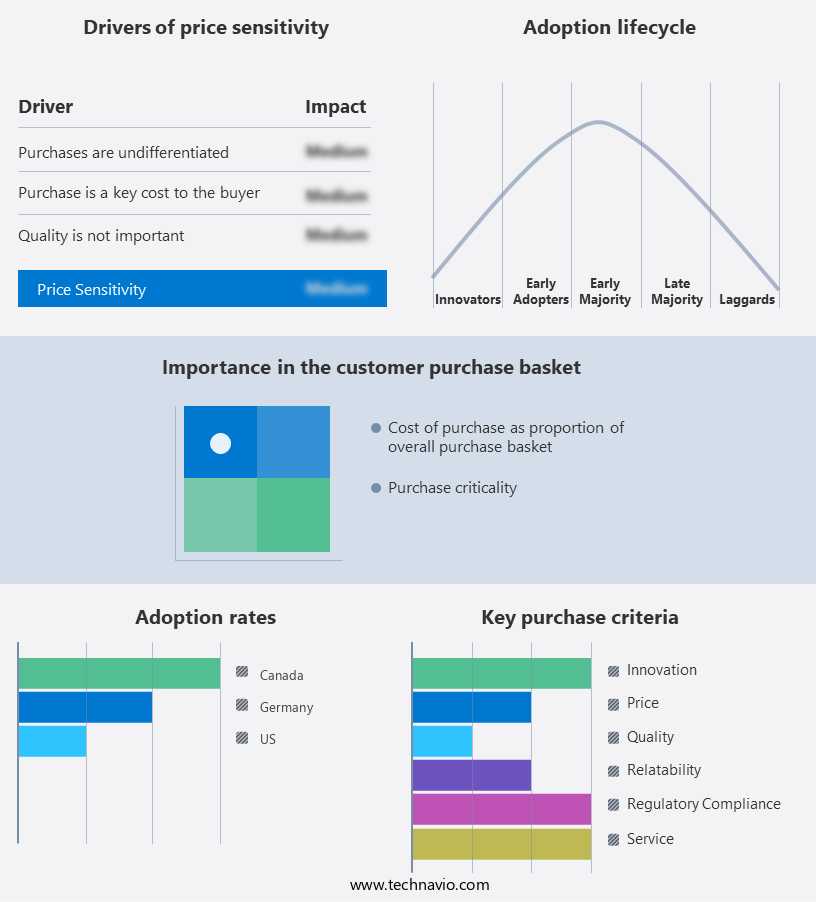
Exclusive Customer Landscape
The smart water meter market forecasting report includes the adoption lifecycle of the market, covering from the innovator's stage to the laggard's stage. It focuses on adoption rates in different regions based on penetration. Furthermore, the smart water meter market report also includes key purchase criteria and drivers of price sensitivity to help companies evaluate and develop their market growth analysis strategies.
Customer Landscape of Smart Water Meter Industry
Key Companies & Market Insights
Companies are implementing various strategies, such as strategic alliances, smart water meter market forecast, partnerships, mergers and acquisitions, geographical expansion, and product/service launches, to enhance their presence in the industry.
Itron - This company specializes in advanced water metering technology, providing innovative solutions like BlueEdge, Smart Water Solutions at ACE2, and Residential Water Metering. Their offerings enhance water management efficiency and sustainability. Products include smart water meters and related services.
The industry research and growth report includes detailed analyses of the competitive landscape of the market and information about key companies, including:
- Itron
- Badger Meter
- Sensus (Xylem)
- Diehl Metering
- Kamstrup
- Landis+Gyr
- Aclara Technologies
- Neptune Technology Group
- Zenner International
- Arad Group
- Elster Group (Honeywell)
- Apator Group
- Qundis
- Wasion Group
- Ningbo Water Meter
- Sanchuan Wisdom Technology
- Suntront Technology
- Meter Instruments
- Baylan
- Maddalena
Qualitative and quantitative analysis of companies has been conducted to help clients understand the wider business environment as well as the strengths and weaknesses of key industry players. Data is qualitatively analyzed to categorize companies as pure play, category-focused, industry-focused, and diversified; it is quantitatively analyzed to categorize companies as dominant, leading, strong, tentative, and weak.
Recent Development and News in Smart Water Meter Market
- In January 2024, Itron, a leading technology and services company, announced the launch of its OpenWay Riva™ smart water solution, which combines advanced metering infrastructure and network capabilities to support water utilities in their digital transformation journey (Itron Press Release).
- In March 2024, Sensus, a Xylem brand, and IBM signed a strategic partnership to integrate Sensus' smart water network solutions with IBM's Watson IoT platform, enabling utilities to gain real-time insights and optimize their water distribution networks (Sensus Press Release).
- In April 2025, Elster, a global metering solutions provider, completed the acquisition of Bermuda-based smart water metering company, Aclara Technologies, expanding Elster's presence in the North American smart water metering market and strengthening its position as a leading provider of end-to-end smart utility solutions (Elster Press Release).
- In May 2025, the European Commission approved the Horizon 2020 project "SmartWaterNet," a collaborative research initiative aimed at developing and deploying advanced technologies for smart water networks, including smart water meters, to enhance water efficiency and reduce losses across Europe (European Commission Press Release).
Research Analyst Overview
- The market encompasses a range of advanced technologies and systems designed to enhance water utility management and conservation. Central to this market are Automated Meter Reading (AMR) systems, which employ various sensors and communication protocols for remote meter reading and data transmission. These systems utilize AMR technologies such as pressure sensors, water flow sensors, and leak detection algorithms to monitor consumption patterns and detect anomalies. Advanced Metering Infrastructure (AMI) represents the next generation of smart water metering, offering real-time monitoring, pressure management, and leakage management capabilities. AMI systems employ low-power wide-area networks, wireless communication, and data analytics platforms to facilitate efficient network infrastructure management and customer engagement.
- Pressure management systems play a crucial role in maintaining optimal water distribution network performance. Real-time monitoring and pressure fluctuation analysis help utilities detect and address pressure issues, ensuring efficient water delivery and reducing energy consumption. Data security is a paramount concern in the market. Encryption protocols, cybersecurity measures, and data logging systems are essential components of these systems, ensuring the protection of sensitive consumer and utility data. The market is projected to grow at a significant rate, with industry analysts estimating a 12% compound annual growth rate over the next five years.
- This growth is driven by increasing water scarcity, the need for improved water utility management, and the adoption of advanced technologies to enhance water conservation strategies. For instance, a leading water utility in Europe reported a 20% reduction in water loss due to leak detection and pressure management initiatives enabled by smart water meter technology. This not only led to substantial cost savings but also contributed to the conservation of valuable water resources.
Dive into Technavio's robust research methodology, blending expert interviews, extensive data synthesis, and validated models for unparalleled Smart Water Meter Market insights. See full methodology.
|
Market Scope |
|
|
Report Coverage |
Details |
|
Page number |
210 |
|
Base year |
2024 |
|
Historic period |
2019-2023 |
|
Forecast period |
2025-2029 |
|
Growth momentum & CAGR |
Accelerate at a CAGR of 13.6% |
|
Market growth 2025-2029 |
USD 4977.4 million |
|
Market structure |
Fragmented |
|
YoY growth 2024-2025(%) |
11.7 |
|
Key countries |
US, Canada, Germany, UK, China, France, Spain, Israel, Japan, Italy, Australia, UAE, and Brazil |
|
Competitive landscape |
Leading Companies, Market Positioning of Companies, Competitive Strategies, and Industry Risks |
What are the Key Data Covered in this Smart Water Meter Market Research and Growth Report?
- CAGR of the Smart Water Meter industry during the forecast period
- Detailed information on factors that will drive the growth and forecasting between 2025 and 2029
- Precise estimation of the size of the market and its contribution of the industry in focus to the parent market
- Accurate predictions about upcoming growth and trends and changes in consumer behaviour
- Growth of the market across North America, Europe, APAC, Middle East and Africa, and South America
- Thorough analysis of the market's competitive landscape and detailed information about companies
- Comprehensive analysis of factors that will challenge the smart water meter market growth of industry companies
We can help! Our analysts can customize this smart water meter market research report to meet your requirements.