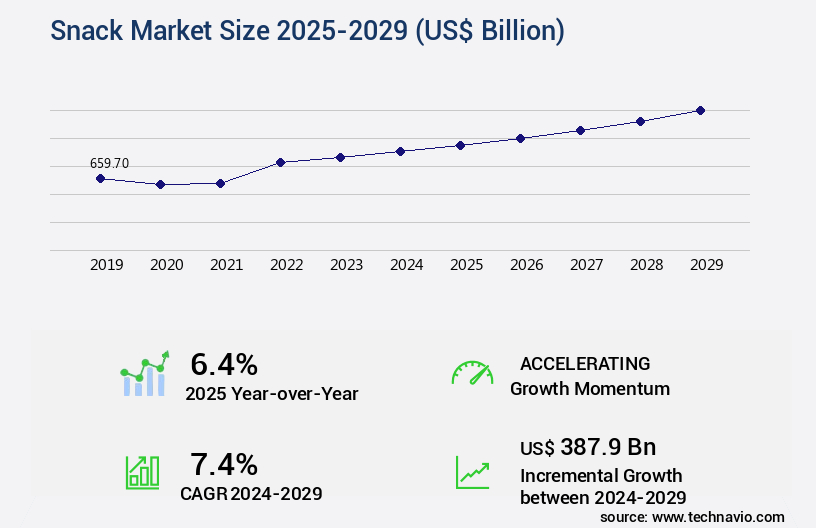
Snack Market Size 2025-2029
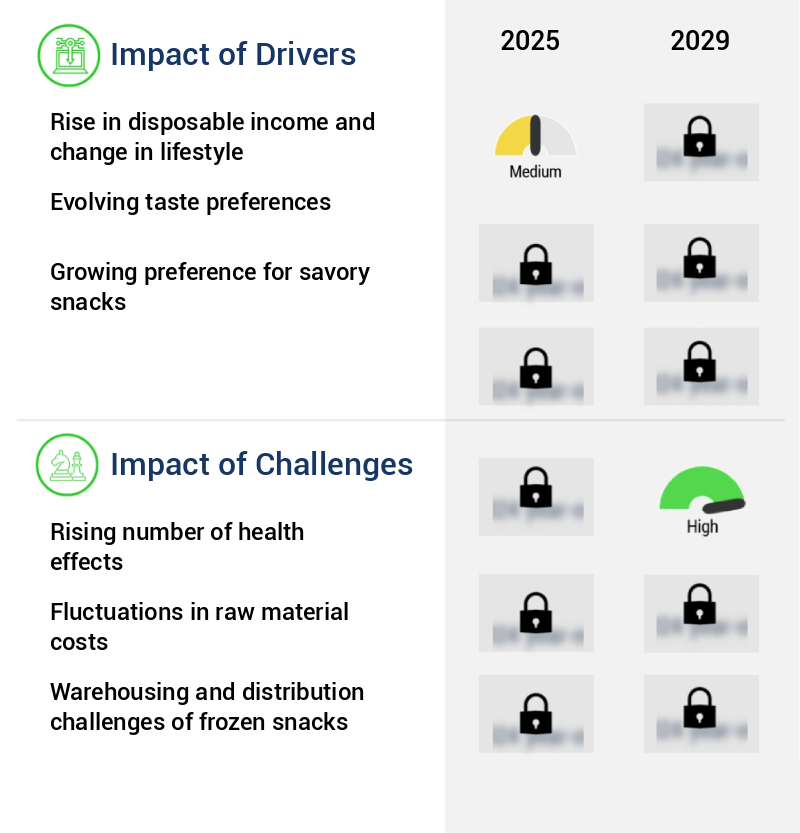
The snack market size is valued to increase USD 387.9 billion, at a CAGR of 7.4% from 2024 to 2029. Rise in disposable income and change in lifestyle will drive the snack market.
Major Market Trends & Insights
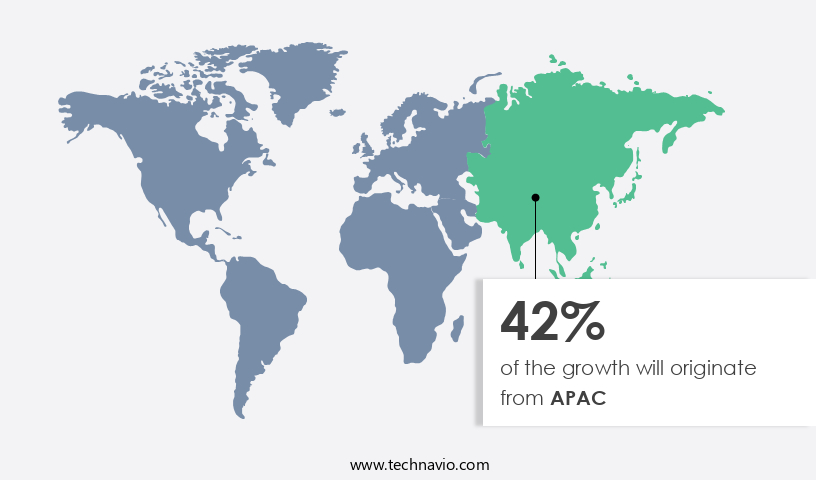
- APAC dominated the market and accounted for a 42% growth during the forecast period.
- By Product - Bakery products segment was valued at USD 383.70 billion in 2023
- By Distribution Channel - Offline segment accounted for the largest market revenue share in 2023
Market Size & Forecast
- Market Opportunities: USD 96.26 billion
- Market Future Opportunities: USD 387.90 billion
- CAGR from 2024 to 2029: 7.4%
Market Summary
- The market has witnessed significant expansion in recent years, fueled by increasing disposable income and shifting consumer preferences. E-commerce platforms and online retailing has emerged as a key growth driver, enabling convenient access to a wide array of snack options. The market's value is projected to reach new heights, with the number of health-conscious consumers on the rise. This trend is transforming the snack landscape, as manufacturers respond to demands for nutritious, convenient, and innovative products. Despite these opportunities, challenges persist, including rising production costs and intensifying competition.
- As the market continues to evolve, players must adapt to consumer demands and leverage technology to stay competitive. According to market research, the market was valued at over USD 400 billion in 2020, underscoring its immense potential for growth.
What will be the Size of the Snack Market during the forecast period?

Get Key Insights on Market Forecast (PDF) Request Free Sample
How is the Snack Market Segmented?
The snack industry research report provides comprehensive data (region-wise segment analysis), with forecasts and estimates in "USD billion" for the period 2025-2029, as well as historical data from 2019-2023 for the following segments.
- Product
- Bakery products
- Chocolate
- Savory snacks
- Frozen snacks
- Others
- Distribution Channel
- Packaging
- Bags and pouches
- Boxes
- Cans
- Jars
- Others
- Nature
- Conventional
- Organic
- Gluten-Free
- Vegan
- Reduced Fat/Sugar/Salt
- Flavor
- Salty
- Sweet
- Spicy
- Savory
- Tangy
- Unflavored
- Geography
- North America
- Europe
- Middle East and Africa
- APAC
- South America
- Rest of World (ROW)
By Product Insights
The bakery products segment is estimated to witness significant growth during the forecast period.
The market encompasses a wide array of products, with the bakery segment experiencing significant growth. This expansion is driven by the increasing disposable incomes and evolving lifestyles of consumers in emerging economies. Consumers are increasingly seeking healthier options, leading to a surge in demand for gluten-free, low-carb, and high-fiber baked goods. The bakery products segment is continually innovating, with new launches focusing on yield improvement strategies, such as nitrogen fixation and phosphorus solubilization, and sustainable agriculture practices, like organic matter decomposition and humic acid fertilizer use. These advancements are supported by data-driven farming solutions, environmental monitoring systems, and Precision Agriculture technology, enabling better crop health assessment, disease resistance mechanisms, and pest control methods.

Request Free Sample
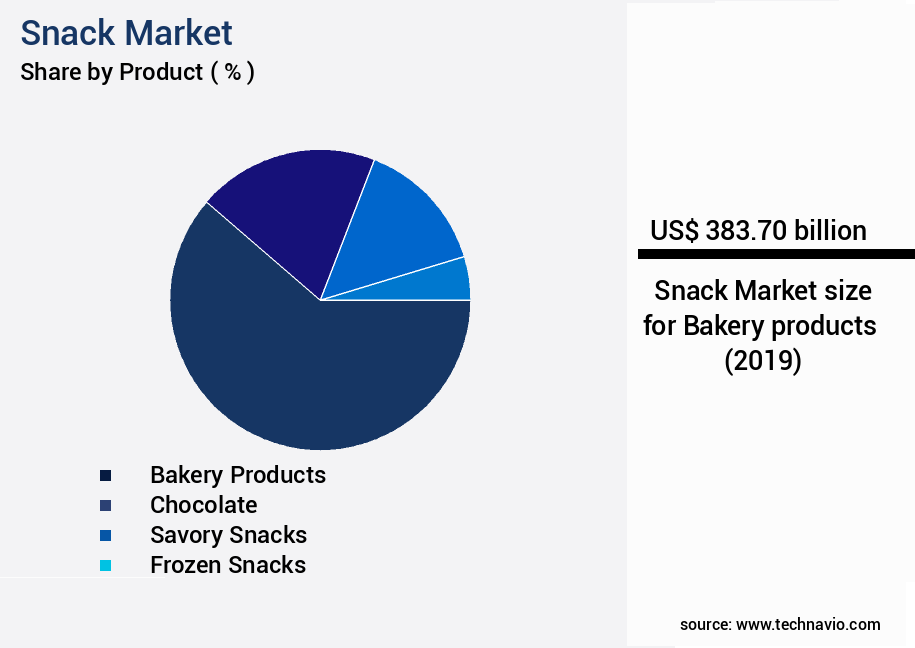
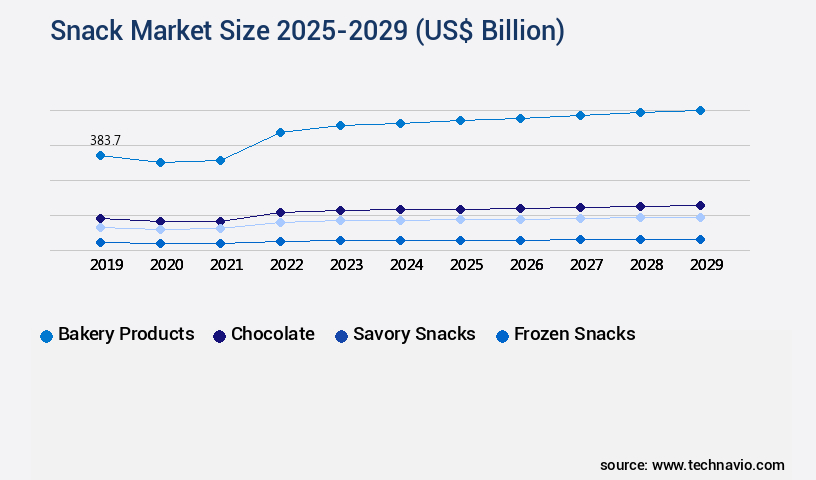
The Bakery products segment was valued at USD 383.70 billion in 2019 and showed a gradual increase during the forecast period.
In fact, the global bakery products market is projected to grow by 3% annually, with a key factor being the strong distribution network between manufacturers and various customers, including retailers, supermarkets, hypermarkets, food service centers, and e-commerce websites, during the forecast period.

Request Free Sample
Regional Analysis
APAC is estimated to contribute 42% to the growth of the global market during the forecast period.Technavio's analysts have elaborately explained the regional trends and drivers that shape the market during the forecast period.

See How Snack Market Demand is Rising in APAC Request Free Sample
The market is experiencing significant expansion in response to the burgeoning food retail sector, particularly in developing nations within the Asia Pacific (APAC) region. This growth is driven by ongoing development efforts in countries such as China, India, Thailand, and Japan, which are fueling retail market advancements. Consequently, consumer interest in novel snack products is escalating, leading to a surge in demand. Packaged snacks, with their convenience and ready-to-eat (RTE) attributes, are among the top categories experiencing growth.
In China, for instance, snacking has emerged as a popular alternative to traditional meals, further boosting the demand for snacks.
Market Dynamics
Our researchers analyzed the data with 2024 as the base year, along with the key drivers, trends, and challenges. A holistic analysis of drivers will help companies refine their marketing strategies to gain a competitive advantage.
The market is experiencing robust growth, driven by consumers' increasing preference for convenient, on-the-go food options. This trend is particularly pronounced in emerging economies, where urbanization and changing lifestyles are fueling demand. However, the industry's growth trajectory is not without challenges. Sustainability is a major concern, with farmers and food processors seeking ways to improve nutrient uptake efficiency in crops, impact microbial communities on soil health, and optimize water use efficiency in agriculture. Innovations in agriculture are playing a crucial role in addressing these challenges. For instance, the application of precision agriculture technologies, such as drones and data analytics, is enabling farmers to measure soil health using remote sensing and assess crop quality using advanced techniques.
Sustainable practices, like sustainable practices for yield enhancement, are also gaining traction, with farmers adopting techniques like sustainable irrigation, crop rotation, and cover cropping to improve soil fertility and reduce the use of synthetic fertilizers and pesticides. Moreover, the role of plant hormones in stress tolerance and the effectiveness of biofertilizers on crop growth are areas of active research. The integration of agroforestry in farming systems is another promising approach, as it promotes biodiversity and helps manage abiotic stresses through soil amendment. The benefits of organic matter in soil carbon sequestration are also being recognized, with farmers increasingly focusing on reducing their carbon footprint.
Despite these advancements, the market faces significant challenges, particularly in the context of climate change. Developing climate-resilient agricultural practices is a priority, as extreme weather events and changing climate patterns threaten crop yields and food security. In this regard, assessing the impact of climate change on agriculture and implementing strategies for reducing pesticide use in farming are key areas of focus. Adoption rates of precision agriculture technologies in developed regions are nearly double those in developing regions, underscoring the need for targeted investments and capacity building efforts. Furthermore, the role of government policies and public-private partnerships in promoting sustainable agriculture and driving innovation cannot be overstated.
By working together, stakeholders can create a more resilient and sustainable market that meets the evolving needs of consumers while minimizing its environmental footprint.

What are the key market drivers leading to the rise in the adoption of Snack Industry?
- The primary factors driving market growth are the increase in disposable income and resulting shifts in consumer lifestyle.
- Disposable income has witnessed a significant rise globally, as reported by various statistical bodies. In the US, for instance, the US Bureau of Economic Analysis (BEA) indicates a USD 37.7 billion (0.2%) increase in disposable personal income in June 2024. This trend is not limited to developed economies alone; the Organization for Economic Co-operation and Development (OECD) reports an increase in household disposable income across all member countries since 2021.
- Factors contributing to this expansion include the rise in dual household income, per capita income, and a robust employment rate. The escalating disposable income is projected to amplify consumer spending and purchasing power, thereby impacting businesses across sectors.
What are the market trends shaping the Snack Industry?
- Online retailing is experiencing significant growth and is emerging as the next market trend.
- The global e-commerce market's expansion is primarily driven by the increasing internet penetration and the convenience it offers to consumers. This shift in shopping behavior has opened new opportunities for snack suppliers to expand their sales, reach broader markets, and enhance customer relationships. Manufacturers and distributors can leverage online platforms to boost product visibility and explore prospects in emerging markets. The preference for online shopping continues to grow, with consumers drawn to the ease of product discovery, appealing offers, and competitive pricing.
- This trend is not limited to developed markets; developing regions are also witnessing a surge in online shopping adoption. The e-commerce landscape is dynamic, with ongoing market activities and evolving patterns shaping the industry's future.
What challenges does the Snack Industry face during its growth?
- The escalating health concerns posing significant risks to workers and consumers represent a major challenge to the industry's growth trajectory.
- The cheese market experiences ongoing dynamics driven by various factors, including health concerns related to high-calorie intake. Cheese, a rich source of essential nutrients, contains high levels of saturated fat, which can increase cholesterol levels. Elevated cholesterol poses risks for heart disease. Moreover, cheese is high in sodium, contributing to maintaining water balance in cells. However, excessive sodium consumption can lead to high blood pressure and associated health issues, including kidney disease, heart disease, and osteoporosis. Despite these health implications, cheese remains a significant contributor to caloric intake.
- Consumers' likelihood of acquiring weight from high-calorie foods hinders market growth. The cheese industry continues to evolve, with innovations in production methods and product offerings catering to diverse consumer preferences and health-conscious trends.
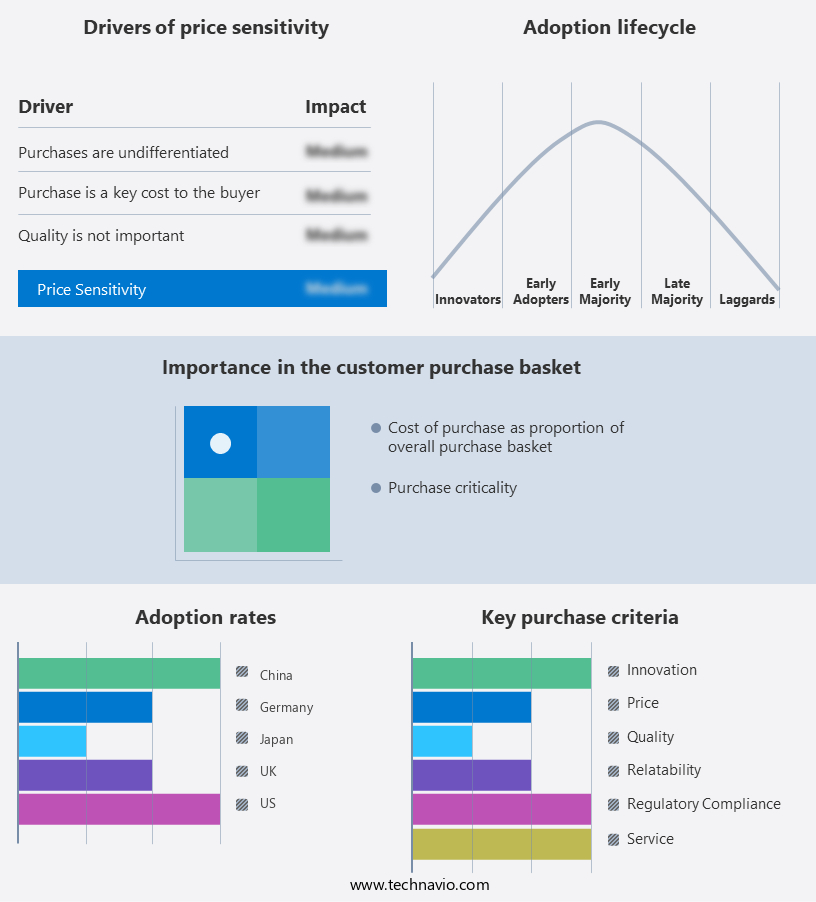
Exclusive Technavio Analysis on Customer Landscape
The snack market forecasting report includes the adoption lifecycle of the market, covering from the innovator's stage to the laggard's stage. It focuses on adoption rates in different regions based on penetration. Furthermore, the snack market report also includes key purchase criteria and drivers of price sensitivity to help companies evaluate and develop their market growth analysis strategies.

Customer Landscape of Snack Industry
Competitive Landscape
Companies are implementing various strategies, such as strategic alliances, snack market forecast, partnerships, mergers and acquisitions, geographical expansion, and product/service launches, to enhance their presence in the industry.
Agthia Group PJSC - This company specializes in providing a range of savory snacks, including poppy and garlic flatbreads, and sandwich spreads.
The industry research and growth report includes detailed analyses of the competitive landscape of the market and information about key companies, including:
- Agthia Group PJSC
- B and G Foods Inc.
- Calbee Inc.
- Conagra Brands Inc.
- Cooperatie Koninklijke Cosun UA
- Deco Food Service
- Ferrero International S.A.
- General Mills Inc.
- Happytizers Pvt Ltd
- Harvest Almond Snacks
- Hormel Foods Corp.
- J and J Snack Foods Corp.
- Kind LLC
- McCain Foods Ltd.
- Mondelez International Inc.
- Nestle SA
- NutriAsia Inc.
- PepsiCo Inc.
- Popcorn Shed Ltd.
- Rich Products Corp.
- Sargento Foods Inc.
- The Hain Celestial Group Inc.
- The Hershey Co.
- The Kraft Heinz Co.
- Tyson Foods Inc.
Qualitative and quantitative analysis of companies has been conducted to help clients understand the wider business environment as well as the strengths and weaknesses of key industry players. Data is qualitatively analyzed to categorize companies as pure play, category-focused, industry-focused, and diversified; it is quantitatively analyzed to categorize companies as dominant, leading, strong, tentative, and weak.
Recent Development and News in Snack Market
- In January 2024, Quaker Oats, a leading snack manufacturer, introduced a new line of gluten-free, plant-based protein snacks, called "Quaker Protein Bites," in response to the growing consumer demand for healthier snack options (Quaker Oats Press Release).
- In March 2024, PepsiCo and Nestlé, two snack industry giants, announced a strategic partnership to expand their reach in the market by combining their complementary product portfolios and distribution networks (PepsiCo Press Release).
- In May 2024, Frito-Lay, a subsidiary of PepsiCo, completed the acquisition of the South American snack business of Grupo Bimbo, marking Frito-Lay's entry into the South American market and expanding its global footprint (Frito-Lay Press Release).
- In April 2025, the European Commission approved the acquisition of Hershey's European chocolate business by Ferrero, subject to certain conditions, paving the way for Ferrero's expansion into the European chocolate market and increasing competition in the snack industry (European Commission Press Release).
Dive into Technavio's robust research methodology, blending expert interviews, extensive data synthesis, and validated models for unparalleled Snack Market insights. See full methodology.
Market Scope
|
Report Coverage
|
Details
|
Page number
|
237
|
Base year
|
2024
|
Historic period
|
2019-2023 |
Forecast period
|
2025-2029
|
Growth momentum & CAGR
|
Accelerate at a CAGR of 7.4%
|
Market growth 2025-2029
|
USD 387.9 billion
|
Market structure
|
Fragmented
|
YoY growth 2024-2025(%)
|
6.4
|
Key countries
|
US, Canada, Germany, UK, Italy, France, China, India, Japan, Brazil, Egypt, UAE, Oman, Argentina, KSA, UAE, Brazil, and Rest of World (ROW)
|
Competitive landscape
|
Leading Companies, Market Positioning of Companies, Competitive Strategies, and Industry Risks
|
Request Free Sample
Research Analyst Overview
- Amidst the dynamic landscape of consumer preferences and evolving production methods, the market continues to thrive, offering a rich tapestry of innovation and growth. Soil microbial communities play a pivotal role in this realm, with health indicators serving as crucial benchmarks for optimizing crop yields. Data-driven farming solutions are revolutionizing the sector, integrating advanced technologies like precision agriculture and environmental monitoring systems to enhance nutrient uptake efficiency and improve crop health assessment. Weed management practices and yield improvement strategies, such as nitrogen fixation and phosphorus solubilization, are essential components of sustainable agriculture. Vegetable production techniques, underpinned by expertise in plant hormone modulation and root development enhancers, contribute significantly to the market's growth.
- Sustainable agriculture practices, including humic acid fertilizer and crop stress tolerance mechanisms, are gaining traction, driven by consumer demand for eco-friendly options. Post-harvest preservation techniques, like potassium availability and water use efficiency, ensure optimal product quality and longevity. Biotic stress management, achieved through microbial inoculants and disease resistance mechanisms, bolsters crop resilience. Enhanced photosynthesis rates and pest control methods further fortify the sector's robustness. The market's continuous evolution is marked by a staggering 20% increase in the adoption of precision agriculture technology over the past five years. This growth underscores the industry's commitment to innovation and its ability to adapt to consumer demands and production challenges.
- The sector's future promises a myriad of opportunities, from abiotic stress mitigation and enzyme activity levels to fruit quality parameters and soil nutrient cycling.
What are the Key Data Covered in this Snack Market Research and Growth Report?
-
What is the expected growth of the Snack Market between 2025 and 2029?
-
What segmentation does the market report cover?
-
The report is segmented by Product (Bakery products, Chocolate, Savory snacks, Frozen snacks, and Others), Distribution Channel (Offline and Online), Packaging (Bags and pouches, Boxes, Cans, Jars, and Others), Geography (APAC, Europe, North America, South America, and Middle East and Africa), Nature (Conventional, Organic, Gluten-Free, Vegan, and Reduced Fat/Sugar/Salt), and Flavor (Salty, Sweet, Spicy, Savory, Tangy, and Unflavored)
-
Which regions are analyzed in the report?
-
APAC, Europe, North America, South America, and Middle East and Africa
-
What are the key growth drivers and market challenges?
-
Who are the major players in the Snack Market?
-
Agthia Group PJSC, B and G Foods Inc., Calbee Inc., Conagra Brands Inc., Cooperatie Koninklijke Cosun UA, Deco Food Service, Ferrero International S.A., General Mills Inc., Happytizers Pvt Ltd, Harvest Almond Snacks, Hormel Foods Corp., J and J Snack Foods Corp., Kind LLC, McCain Foods Ltd., Mondelez International Inc., Nestle SA, NutriAsia Inc., PepsiCo Inc., Popcorn Shed Ltd., Rich Products Corp., Sargento Foods Inc., The Hain Celestial Group Inc., The Hershey Co., The Kraft Heinz Co., and Tyson Foods Inc.
Market Research Insights
- The market continues to evolve, driven by consumer preferences for convenient, nutritious, and sustainable options. According to recent estimates, the global snack food market size was valued at USD 425 billion in 2020, projected to reach USD 608 billion by 2027. Quality assessment tools play a crucial role in maintaining the standard of snack production, ensuring consumer safety and satisfaction. For instance, soil carbon sequestration and crop yield maximization techniques contribute significantly to agricultural productivity, reducing the environmental impact of snack production. Integrated pest management, resource-efficient farming, and Precision Farming methods are employed to minimize the use of synthetic fertilizers and pesticides, aligning with the trend towards sustainable food production.
- Water conservation methods and soil amendment strategies are essential for maintaining the health of crops and reducing the environmental footprint of snack production. Yield monitoring systems and variable rate technology enable farmers to optimize their use of resources, contributing to resource-efficient farming practices. Climate-smart agriculture, precision fertilizer placement, and integrated nutrient management further enhance the efficiency of snack production, ensuring a consistent supply of high-quality raw materials. Data analytics platforms and GIS mapping techniques facilitate the implementation of these strategies, providing valuable insights into crop health, resource utilization, and market trends. Biofertilizer application and organic farming practices are also gaining popularity, as they offer sustainable alternatives to synthetic fertilizers and contribute to nutrient use efficiency.
- Cover cropping techniques and remote sensing applications further support sustainable snack production, ensuring the long-term viability of the industry.
We can help! Our analysts can customize this snack market research report to meet your requirements.
Get in touch
1 Executive Summary
- 1.1 Market overview
- Executive Summary - Chart on Market Overview
- Executive Summary - Data Table on Market Overview
- Executive Summary - Chart on Global Market Characteristics
- Executive Summary - Chart on Market by Geography
- Executive Summary - Chart on Market Segmentation by Product
- Executive Summary - Chart on Market Segmentation by Distribution Channel
- Executive Summary - Chart on Market Segmentation by Packaging
- Executive Summary - Chart on Incremental Growth
- Executive Summary - Data Table on Incremental Growth
- Executive Summary - Chart on Company Market Positioning
2 Technavio Analysis
- 2.1 Analysis of price sensitivity, lifecycle, customer purchase basket, adoption rates, and purchase criteria
- Analysis of price sensitivity, lifecycle, customer purchase basket, adoption rates, and purchase criteria
- 2.2 Criticality of inputs and Factors of differentiation
- Overview on criticality of inputs and factors of differentiation
- 2.3 Factors of disruption
- Overview on factors of disruption
- 2.4 Impact of drivers and challenges
- Impact of drivers and challenges in 2024 and 2029
3 Market Landscape
- 3.1 Market ecosystem
- Parent Market
- Data Table on - Parent Market
- 3.2 Market characteristics
- Market characteristics analysis
4 Market Sizing
- 4.1 Market definition
- Offerings of companies included in the market definition
- 4.2 Market segment analysis
- 4.4 Market outlook: Forecast for 2024-2029
- Chart on Global - Market size and forecast 2024-2029 ($ billion)
- Data Table on Global - Market size and forecast 2024-2029 ($ billion)
- Chart on Global Market: Year-over-year growth 2024-2029 (%)
- Data Table on Global Market: Year-over-year growth 2024-2029 (%)
5 Historic Market Size
- 5.1 Global Snack Market 2019 - 2023
- Historic Market Size - Data Table on Global Snack Market 2019 - 2023 ($ billion)
- 5.2 Product segment analysis 2019 - 2023
- Historic Market Size - Product Segment 2019 - 2023 ($ billion)
- 5.3 Distribution Channel segment analysis 2019 - 2023
- Historic Market Size - Distribution Channel Segment 2019 - 2023 ($ billion)
- 5.4 Packaging segment analysis 2019 - 2023
- Historic Market Size - Packaging Segment 2019 - 2023 ($ billion)
- 5.5 Geography segment analysis 2019 - 2023
- Historic Market Size - Geography Segment 2019 - 2023 ($ billion)
- 5.6 Country segment analysis 2019 - 2023
- Historic Market Size - Country Segment 2019 - 2023 ($ billion)
6 Qualitative Analysis
- 6.1 AI Impact on Global Snack Market
7 Five Forces Analysis
- 7.1 Five forces summary
- Five forces analysis - Comparison between 2024 and 2029
- 7.2 Bargaining power of buyers
- Bargaining power of buyers - Impact of key factors 2024 and 2029
- 7.3 Bargaining power of suppliers
- Bargaining power of suppliers - Impact of key factors in 2024 and 2029
- 7.4 Threat of new entrants
- Threat of new entrants - Impact of key factors in 2024 and 2029
- 7.5 Threat of substitutes
- Threat of substitutes - Impact of key factors in 2024 and 2029
- 7.6 Threat of rivalry
- Threat of rivalry - Impact of key factors in 2024 and 2029
- 7.7 Market condition
- Chart on Market condition - Five forces 2024 and 2029
8 Market Segmentation by Product
- 8.1 Market segments
- Chart on Product - Market share (2024-2029) (%)
- Data Table on Product - Market share (2024-2029) (%)
- 8.2 Comparison by Product
- Chart on Comparison by Product
- Data Table on Comparison by Product
- 8.3 Bakery products - Market size and forecast (2024-2029)
- Chart on Bakery products - Market size and forecast (2024-2029) ($ billion)
- Data Table on Bakery products - Market size and forecast (2024-2029) ($ billion)
- Chart on Bakery products - Year-over-year growth (2024-2029) (%)
- Data Table on Bakery products - Year-over-year growth (2024-2029) (%)
- 8.4 Chocolate - Market size and forecast (2024-2029)
- Chart on Chocolate - Market size and forecast (2024-2029) ($ billion)
- Data Table on Chocolate - Market size and forecast (2024-2029) ($ billion)
- Chart on Chocolate - Year-over-year growth (2024-2029) (%)
- Data Table on Chocolate - Year-over-year growth (2024-2029) (%)
- 8.5 Savory snacks - Market size and forecast (2024-2029)
- Chart on Savory snacks - Market size and forecast (2024-2029) ($ billion)
- Data Table on Savory snacks - Market size and forecast (2024-2029) ($ billion)
- Chart on Savory snacks - Year-over-year growth (2024-2029) (%)
- Data Table on Savory snacks - Year-over-year growth (2024-2029) (%)
- 8.6 Frozen snacks - Market size and forecast (2024-2029)
- Chart on Frozen snacks - Market size and forecast (2024-2029) ($ billion)
- Data Table on Frozen snacks - Market size and forecast (2024-2029) ($ billion)
- Chart on Frozen snacks - Year-over-year growth (2024-2029) (%)
- Data Table on Frozen snacks - Year-over-year growth (2024-2029) (%)
- 8.7 Others - Market size and forecast (2024-2029)
- Chart on Others - Market size and forecast (2024-2029) ($ billion)
- Data Table on Others - Market size and forecast (2024-2029) ($ billion)
- Chart on Others - Year-over-year growth (2024-2029) (%)
- Data Table on Others - Year-over-year growth (2024-2029) (%)
- 8.8 Market opportunity by Product
- Market opportunity by Product ($ billion)
- Data Table on Market opportunity by Product ($ billion)
9 Market Segmentation by Distribution Channel
- 9.1 Market segments
- Chart on Distribution Channel - Market share (2024-2029) (%)
- Data Table on Distribution Channel - Market share (2024-2029) (%)
- 9.2 Comparison by Distribution Channel
- Chart on Comparison by Distribution Channel
- Data Table on Comparison by Distribution Channel
- 9.3 Offline - Market size and forecast (2024-2029)
- Chart on Offline - Market size and forecast (2024-2029) ($ billion)
- Data Table on Offline - Market size and forecast (2024-2029) ($ billion)
- Chart on Offline - Year-over-year growth (2024-2029) (%)
- Data Table on Offline - Year-over-year growth (2024-2029) (%)
- 9.4 Online - Market size and forecast (2024-2029)
- Chart on Online - Market size and forecast (2024-2029) ($ billion)
- Data Table on Online - Market size and forecast (2024-2029) ($ billion)
- Chart on Online - Year-over-year growth (2024-2029) (%)
- Data Table on Online - Year-over-year growth (2024-2029) (%)
- 9.5 Market opportunity by Distribution Channel
- Market opportunity by Distribution Channel ($ billion)
- Data Table on Market opportunity by Distribution Channel ($ billion)
10 Market Segmentation by Packaging
- 10.1 Market segments
- Chart on Packaging - Market share (2024-2029) (%)
- Data Table on Packaging - Market share (2024-2029) (%)
- 10.2 Comparison by Packaging
- Chart on Comparison by Packaging
- Data Table on Comparison by Packaging
- 10.3 Bags and pouches - Market size and forecast (2024-2029)
- Chart on Bags and pouches - Market size and forecast (2024-2029) ($ billion)
- Data Table on Bags and pouches - Market size and forecast (2024-2029) ($ billion)
- Chart on Bags and pouches - Year-over-year growth (2024-2029) (%)
- Data Table on Bags and pouches - Year-over-year growth (2024-2029) (%)
- 10.4 Boxes - Market size and forecast (2024-2029)
- Chart on Boxes - Market size and forecast (2024-2029) ($ billion)
- Data Table on Boxes - Market size and forecast (2024-2029) ($ billion)
- Chart on Boxes - Year-over-year growth (2024-2029) (%)
- Data Table on Boxes - Year-over-year growth (2024-2029) (%)
- 10.5 Cans - Market size and forecast (2024-2029)
- Chart on Cans - Market size and forecast (2024-2029) ($ billion)
- Data Table on Cans - Market size and forecast (2024-2029) ($ billion)
- Chart on Cans - Year-over-year growth (2024-2029) (%)
- Data Table on Cans - Year-over-year growth (2024-2029) (%)
- 10.6 Jars - Market size and forecast (2024-2029)
- Chart on Jars - Market size and forecast (2024-2029) ($ billion)
- Data Table on Jars - Market size and forecast (2024-2029) ($ billion)
- Chart on Jars - Year-over-year growth (2024-2029) (%)
- Data Table on Jars - Year-over-year growth (2024-2029) (%)
- 10.7 Others - Market size and forecast (2024-2029)
- Chart on Others - Market size and forecast (2024-2029) ($ billion)
- Data Table on Others - Market size and forecast (2024-2029) ($ billion)
- Chart on Others - Year-over-year growth (2024-2029) (%)
- Data Table on Others - Year-over-year growth (2024-2029) (%)
- 10.8 Market opportunity by Packaging
- Market opportunity by Packaging ($ billion)
- Data Table on Market opportunity by Packaging ($ billion)
11 Market Segmentation by Nature
- 11.1 Market segments
- Chart on Nature - Market share (2024-2029) (%)
- Data Table on Nature - Market share (2024-2029) (%)
- 11.2 Comparison by Nature
- Chart on Comparison by Nature
- Data Table on Comparison by Nature
- 11.3 Conventional - Market size and forecast (2024-2029)
- Chart on Conventional - Market size and forecast (2024-2029) ($ billion)
- Data Table on Conventional - Market size and forecast (2024-2029) ($ billion)
- Chart on Conventional - Year-over-year growth (2024-2029) (%)
- Data Table on Conventional - Year-over-year growth (2024-2029) (%)
- 11.4 Organic - Market size and forecast (2024-2029)
- Chart on Organic - Market size and forecast (2024-2029) ($ billion)
- Data Table on Organic - Market size and forecast (2024-2029) ($ billion)
- Chart on Organic - Year-over-year growth (2024-2029) (%)
- Data Table on Organic - Year-over-year growth (2024-2029) (%)
- 11.5 Gluten-Free - Market size and forecast (2024-2029)
- Chart on Gluten-Free - Market size and forecast (2024-2029) ($ billion)
- Data Table on Gluten-Free - Market size and forecast (2024-2029) ($ billion)
- Chart on Gluten-Free - Year-over-year growth (2024-2029) (%)
- Data Table on Gluten-Free - Year-over-year growth (2024-2029) (%)
- 11.6 Vegan - Market size and forecast (2024-2029)
- Chart on Vegan - Market size and forecast (2024-2029) ($ billion)
- Data Table on Vegan - Market size and forecast (2024-2029) ($ billion)
- Chart on Vegan - Year-over-year growth (2024-2029) (%)
- Data Table on Vegan - Year-over-year growth (2024-2029) (%)
- 11.7 Reduced Fat/Sugar/Salt - Market size and forecast (2024-2029)
- Chart on Reduced Fat/Sugar/Salt - Market size and forecast (2024-2029) ($ billion)
- Data Table on Reduced Fat/Sugar/Salt - Market size and forecast (2024-2029) ($ billion)
- Chart on Reduced Fat/Sugar/Salt - Year-over-year growth (2024-2029) (%)
- Data Table on Reduced Fat/Sugar/Salt - Year-over-year growth (2024-2029) (%)
- 11.8 Market opportunity by Nature
- Market opportunity by Nature ($ billion)
- Data Table on Market opportunity by Nature ($ billion)
12 Market Segmentation by Flavor
- 12.1 Market segments
- Chart on Flavor - Market share (2024-2029) (%)
- Data Table on Flavor - Market share (2024-2029) (%)
- 12.2 Comparison by Flavor
- Chart on Comparison by Flavor
- Data Table on Comparison by Flavor
- 12.3 Salty - Market size and forecast (2024-2029)
- Chart on Salty - Market size and forecast (2024-2029) ($ billion)
- Data Table on Salty - Market size and forecast (2024-2029) ($ billion)
- Chart on Salty - Year-over-year growth (2024-2029) (%)
- Data Table on Salty - Year-over-year growth (2024-2029) (%)
- 12.4 Sweet - Market size and forecast (2024-2029)
- Chart on Sweet - Market size and forecast (2024-2029) ($ billion)
- Data Table on Sweet - Market size and forecast (2024-2029) ($ billion)
- Chart on Sweet - Year-over-year growth (2024-2029) (%)
- Data Table on Sweet - Year-over-year growth (2024-2029) (%)
- 12.5 Spicy - Market size and forecast (2024-2029)
- Chart on Spicy - Market size and forecast (2024-2029) ($ billion)
- Data Table on Spicy - Market size and forecast (2024-2029) ($ billion)
- Chart on Spicy - Year-over-year growth (2024-2029) (%)
- Data Table on Spicy - Year-over-year growth (2024-2029) (%)
- 12.6 Savory - Market size and forecast (2024-2029)
- Chart on Savory - Market size and forecast (2024-2029) ($ billion)
- Data Table on Savory - Market size and forecast (2024-2029) ($ billion)
- Chart on Savory - Year-over-year growth (2024-2029) (%)
- Data Table on Savory - Year-over-year growth (2024-2029) (%)
- 12.7 Tangy - Market size and forecast (2024-2029)
- Chart on Tangy - Market size and forecast (2024-2029) ($ billion)
- Data Table on Tangy - Market size and forecast (2024-2029) ($ billion)
- Chart on Tangy - Year-over-year growth (2024-2029) (%)
- Data Table on Tangy - Year-over-year growth (2024-2029) (%)
- 12.8 Unflavored - Market size and forecast (2024-2029)
- Chart on Unflavored - Market size and forecast (2024-2029) ($ billion)
- Data Table on Unflavored - Market size and forecast (2024-2029) ($ billion)
- Chart on Unflavored - Year-over-year growth (2024-2029) (%)
- Data Table on Unflavored - Year-over-year growth (2024-2029) (%)
- 12.9 Market opportunity by Flavor
- Market opportunity by Flavor ($ billion)
- Data Table on Market opportunity by Flavor ($ billion)
13 Customer Landscape
- 13.1 Customer landscape overview
- Analysis of price sensitivity, lifecycle, customer purchase basket, adoption rates, and purchase criteria
14 Geographic Landscape
- 14.1 Geographic segmentation
- Chart on Market share by geography 2024-2029 (%)
- Data Table on Market share by geography 2024-2029 (%)
- 14.2 Geographic comparison
- Chart on Geographic comparison
- Data Table on Geographic comparison
- 14.3 APAC - Market size and forecast 2024-2029
- Chart on APAC - Market size and forecast 2024-2029 ($ billion)
- Data Table on APAC - Market size and forecast 2024-2029 ($ billion)
- Chart on APAC - Year-over-year growth 2024-2029 (%)
- Data Table on APAC - Year-over-year growth 2024-2029 (%)
- 14.4 Europe - Market size and forecast 2024-2029
- Chart on Europe - Market size and forecast 2024-2029 ($ billion)
- Data Table on Europe - Market size and forecast 2024-2029 ($ billion)
- Chart on Europe - Year-over-year growth 2024-2029 (%)
- Data Table on Europe - Year-over-year growth 2024-2029 (%)
- 14.5 North America - Market size and forecast 2024-2029
- Chart on North America - Market size and forecast 2024-2029 ($ billion)
- Data Table on North America - Market size and forecast 2024-2029 ($ billion)
- Chart on North America - Year-over-year growth 2024-2029 (%)
- Data Table on North America - Year-over-year growth 2024-2029 (%)
- 14.6 South America - Market size and forecast 2024-2029
- Chart on South America - Market size and forecast 2024-2029 ($ billion)
- Data Table on South America - Market size and forecast 2024-2029 ($ billion)
- Chart on South America - Year-over-year growth 2024-2029 (%)
- Data Table on South America - Year-over-year growth 2024-2029 (%)
- 14.7 Middle East and Africa - Market size and forecast 2024-2029
- Chart on Middle East and Africa - Market size and forecast 2024-2029 ($ billion)
- Data Table on Middle East and Africa - Market size and forecast 2024-2029 ($ billion)
- Chart on Middle East and Africa - Year-over-year growth 2024-2029 (%)
- Data Table on Middle East and Africa - Year-over-year growth 2024-2029 (%)
- 14.8 US - Market size and forecast 2024-2029
- Chart on US - Market size and forecast 2024-2029 ($ billion)
- Data Table on US - Market size and forecast 2024-2029 ($ billion)
- Chart on US - Year-over-year growth 2024-2029 (%)
- Data Table on US - Year-over-year growth 2024-2029 (%)
- 14.9 China - Market size and forecast 2024-2029
- Chart on China - Market size and forecast 2024-2029 ($ billion)
- Data Table on China - Market size and forecast 2024-2029 ($ billion)
- Chart on China - Year-over-year growth 2024-2029 (%)
- Data Table on China - Year-over-year growth 2024-2029 (%)
- 14.10 Japan - Market size and forecast 2024-2029
- Chart on Japan - Market size and forecast 2024-2029 ($ billion)
- Data Table on Japan - Market size and forecast 2024-2029 ($ billion)
- Chart on Japan - Year-over-year growth 2024-2029 (%)
- Data Table on Japan - Year-over-year growth 2024-2029 (%)
- 14.11 India - Market size and forecast 2024-2029
- Chart on India - Market size and forecast 2024-2029 ($ billion)
- Data Table on India - Market size and forecast 2024-2029 ($ billion)
- Chart on India - Year-over-year growth 2024-2029 (%)
- Data Table on India - Year-over-year growth 2024-2029 (%)
- 14.12 UK - Market size and forecast 2024-2029
- Chart on UK - Market size and forecast 2024-2029 ($ billion)
- Data Table on UK - Market size and forecast 2024-2029 ($ billion)
- Chart on UK - Year-over-year growth 2024-2029 (%)
- Data Table on UK - Year-over-year growth 2024-2029 (%)
- 14.13 Germany - Market size and forecast 2024-2029
- Chart on Germany - Market size and forecast 2024-2029 ($ billion)
- Data Table on Germany - Market size and forecast 2024-2029 ($ billion)
- Chart on Germany - Year-over-year growth 2024-2029 (%)
- Data Table on Germany - Year-over-year growth 2024-2029 (%)
- 14.14 South Korea - Market size and forecast 2024-2029
- Chart on South Korea - Market size and forecast 2024-2029 ($ billion)
- Data Table on South Korea - Market size and forecast 2024-2029 ($ billion)
- Chart on South Korea - Year-over-year growth 2024-2029 (%)
- Data Table on South Korea - Year-over-year growth 2024-2029 (%)
- 14.15 Canada - Market size and forecast 2024-2029
- Chart on Canada - Market size and forecast 2024-2029 ($ billion)
- Data Table on Canada - Market size and forecast 2024-2029 ($ billion)
- Chart on Canada - Year-over-year growth 2024-2029 (%)
- Data Table on Canada - Year-over-year growth 2024-2029 (%)
- 14.16 France - Market size and forecast 2024-2029
- Chart on France - Market size and forecast 2024-2029 ($ billion)
- Data Table on France - Market size and forecast 2024-2029 ($ billion)
- Chart on France - Year-over-year growth 2024-2029 (%)
- Data Table on France - Year-over-year growth 2024-2029 (%)
- 14.17 Italy - Market size and forecast 2024-2029
- Chart on Italy - Market size and forecast 2024-2029 ($ billion)
- Data Table on Italy - Market size and forecast 2024-2029 ($ billion)
- Chart on Italy - Year-over-year growth 2024-2029 (%)
- Data Table on Italy - Year-over-year growth 2024-2029 (%)
- 14.18 Market opportunity by geography
- Market opportunity by geography ($ billion)
- Data Tables on Market opportunity by geography ($ billion)
- 14.19 Brazil - Market size and forecast (2024-2029)
- Chart on Brazil - Market size and forecast (2024-2029) ($ billion)
- Data Table on Brazil - Market size and forecast (2024-2029) ($ billion)
- Chart on Brazil - Year-over-year growth (2024-2029) (%)
- Data Table on Brazil - Year-over-year growth (2024-2029) (%)
- 14.20 Egypt - Market size and forecast (2024-2029)
- Chart on Egypt - Market size and forecast (2024-2029) ($ billion)
- Data Table on Egypt - Market size and forecast (2024-2029) ($ billion)
- Chart on Egypt - Year-over-year growth (2024-2029) (%)
- Data Table on Egypt - Year-over-year growth (2024-2029) (%)
- 14.21 UAE - Market size and forecast (2024-2029)
- Chart on UAE - Market size and forecast (2024-2029) ($ billion)
- Data Table on UAE - Market size and forecast (2024-2029) ($ billion)
- Chart on UAE - Year-over-year growth (2024-2029) (%)
- Data Table on UAE - Year-over-year growth (2024-2029) (%)
- 14.22 Oman - Market size and forecast (2024-2029)
- Chart on Oman - Market size and forecast (2024-2029) ($ billion)
- Data Table on Oman - Market size and forecast (2024-2029) ($ billion)
- Chart on Oman - Year-over-year growth (2024-2029) (%)
- Data Table on Oman - Year-over-year growth (2024-2029) (%)
- 14.23 Argentina - Market size and forecast (2024-2029)
- Chart on Argentina - Market size and forecast (2024-2029) ($ billion)
- Data Table on Argentina - Market size and forecast (2024-2029) ($ billion)
- Chart on Argentina - Year-over-year growth (2024-2029) (%)
- Data Table on Argentina - Year-over-year growth (2024-2029) (%)
- 14.24 KSA - Market size and forecast (2024-2029)
- Chart on KSA - Market size and forecast (2024-2029) ($ billion)
- Data Table on KSA - Market size and forecast (2024-2029) ($ billion)
- Chart on KSA - Year-over-year growth (2024-2029) (%)
- Data Table on KSA - Year-over-year growth (2024-2029) (%)
- 14.25 Rest of World (ROW) - Market size and forecast (2024-2029)
- Chart on Rest of World (ROW) - Market size and forecast (2024-2029) ($ billion)
- Data Table on Rest of World (ROW) - Market size and forecast (2024-2029) ($ billion)
- Chart on Rest of World (ROW) - Year-over-year growth (2024-2029) (%)
- Data Table on Rest of World (ROW) - Year-over-year growth (2024-2029) (%)
15 Drivers, Challenges, and Opportunity/Restraints
- 15.3 Impact of drivers and challenges
- Impact of drivers and challenges in 2024 and 2029
- 15.4 Market opportunities/restraints
16 Competitive Landscape
- 16.2 Competitive Landscape
- Overview on criticality of inputs and factors of differentiation
- 16.3 Landscape disruption
- Overview on factors of disruption
- 16.4 Industry risks
- Impact of key risks on business
17 Competitive Analysis
- 17.2 Company ranking index
- 17.3 Market positioning of companies
- Matrix on companies position and classification
- 17.4 B and G Foods Inc.
- B and G Foods Inc. - Overview
- B and G Foods Inc. - Product / Service
- B and G Foods Inc. - Key offerings
- SWOT
- 17.5 Calbee Inc.
- Calbee Inc. - Overview
- Calbee Inc. - Product / Service
- Calbee Inc. - Key offerings
- SWOT
- 17.6 Conagra Brands Inc.
- Conagra Brands Inc. - Overview
- Conagra Brands Inc. - Business segments
- Conagra Brands Inc. - Key news
- Conagra Brands Inc. - Key offerings
- Conagra Brands Inc. - Segment focus
- SWOT
- 17.7 Ferrero International S.A.
- Ferrero International S.A. - Overview
- Ferrero International S.A. - Product / Service
- Ferrero International S.A. - Key news
- Ferrero International S.A. - Key offerings
- SWOT
- 17.8 General Mills Inc.
- General Mills Inc. - Overview
- General Mills Inc. - Business segments
- General Mills Inc. - Key news
- General Mills Inc. - Key offerings
- General Mills Inc. - Segment focus
- SWOT
- 17.9 Hormel Foods Corp.
- Hormel Foods Corp. - Overview
- Hormel Foods Corp. - Business segments
- Hormel Foods Corp. - Key news
- Hormel Foods Corp. - Key offerings
- Hormel Foods Corp. - Segment focus
- SWOT
- 17.10 J and J Snack Foods Corp.
- J and J Snack Foods Corp. - Overview
- J and J Snack Foods Corp. - Business segments
- J and J Snack Foods Corp. - Key offerings
- J and J Snack Foods Corp. - Segment focus
- SWOT
- 17.11 McCain Foods Ltd.
- McCain Foods Ltd. - Overview
- McCain Foods Ltd. - Product / Service
- McCain Foods Ltd. - Key offerings
- SWOT
- 17.12 Mondelez International Inc.
- Mondelez International Inc. - Overview
- Mondelez International Inc. - Business segments
- Mondelez International Inc. - Key news
- Mondelez International Inc. - Key offerings
- Mondelez International Inc. - Segment focus
- SWOT
- 17.13 Nestle SA
- Nestle SA - Overview
- Nestle SA - Business segments
- Nestle SA - Key news
- Nestle SA - Key offerings
- Nestle SA - Segment focus
- SWOT
- 17.14 PepsiCo Inc.
- PepsiCo Inc. - Overview
- PepsiCo Inc. - Business segments
- PepsiCo Inc. - Key news
- PepsiCo Inc. - Key offerings
- PepsiCo Inc. - Segment focus
- SWOT
- 17.15 Rich Products Corp.
- Rich Products Corp. - Overview
- Rich Products Corp. - Product / Service
- Rich Products Corp. - Key offerings
- SWOT
- 17.16 Sargento Foods Inc.
- Sargento Foods Inc. - Overview
- Sargento Foods Inc. - Product / Service
- Sargento Foods Inc. - Key offerings
- SWOT
- 17.17 The Kraft Heinz Co.
- The Kraft Heinz Co. - Overview
- The Kraft Heinz Co. - Business segments
- The Kraft Heinz Co. - Key news
- The Kraft Heinz Co. - Key offerings
- The Kraft Heinz Co. - Segment focus
- SWOT
- 17.18 Tyson Foods Inc.
- Tyson Foods Inc. - Overview
- Tyson Foods Inc. - Business segments
- Tyson Foods Inc. - Key news
- Tyson Foods Inc. - Key offerings
- Tyson Foods Inc. - Segment focus
- SWOT
18 Appendix
- 18.2 Inclusions and exclusions checklist
- Inclusions checklist
- Exclusions checklist
- 18.3 Currency conversion rates for US$
- Currency conversion rates for US$
- 18.4 Research methodology
- 18.7 Validation techniques employed for market sizing
- Validation techniques employed for market sizing
- 18.9 360 degree market analysis
- 360 degree market analysis
- 18.10 List of abbreviations