Sodium Chlorite Market Analysis, Size, and Forecast 2025-2029: APAC (China, India, and Japan), North America (US, Canada, and Mexico), Europe (Germany, UK, and France), South America (Brazil and Argentina), Middle East and Africa (South Africa, Saudi Arabia, and UAE), and Rest of World (ROW)

Sodium Chlorite Market Analysis, Size, and Forecast 2025-2029:
APAC (China, India, and Japan), North America (US, Canada, and Mexico), Europe (Germany, UK, and France), South America (Brazil and Argentina), Middle East and Africa (South Africa, Saudi Arabia, and UAE), and Rest of World (ROW)

Published: Dec 2025 284 Pages SKU: IRTNTR73892

Market Overview at a Glance

$89.6 Mn
Market Opportunity
5.6%
CAGR 2024 - 2029
46.9%
APAC Growth
$152.7 Mn
Water treatment segment 2023

Sodium Chlorite Market Size 2025-2029

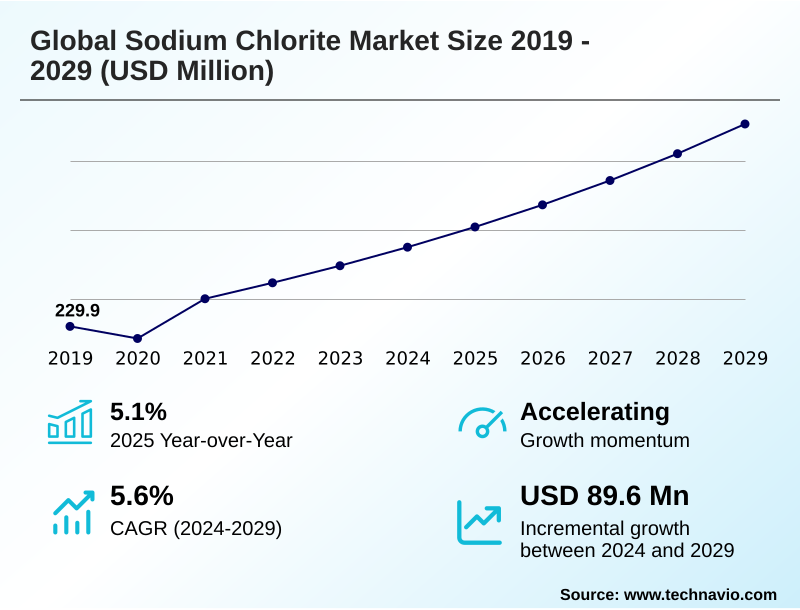
The sodium chlorite market size is valued to increase by USD 89.6 million, at a CAGR of 5.6% from 2024 to 2029. Heightened demand for water treatment and purification propels market growth will drive the sodium chlorite market.

Major Market Trends & Insights

  • APAC dominated the market and accounted for a 46.9% growth during the forecast period.
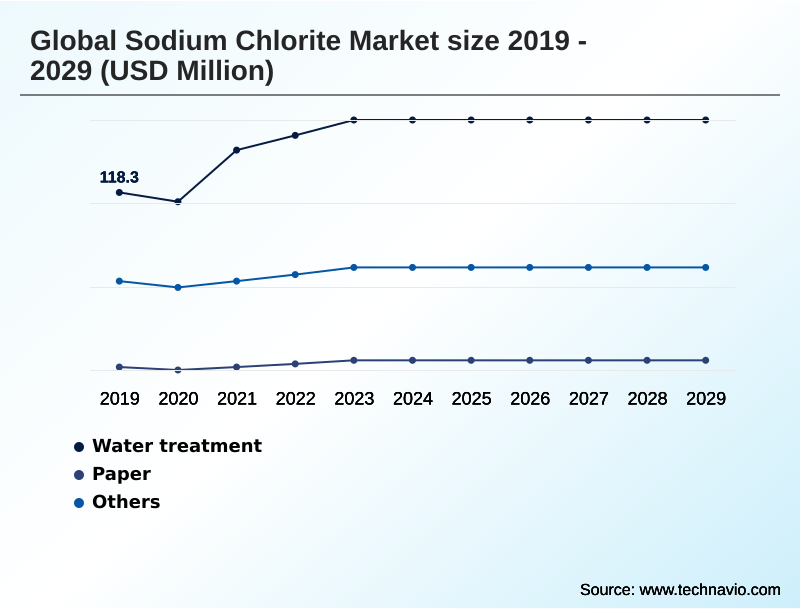
  • By Application - Water treatment segment was valued at USD 152.7 million in 2023
  • By Grade Type - Industrial grade segment accounted for the largest market revenue share in 2023

Market Size & Forecast

  • Market Opportunities: USD 147.2 million
  • Market Future Opportunities: USD 89.6 million
  • CAGR from 2024 to 2029 : 5.6%

Market Summary

  • The sodium chlorite market is fundamentally shaped by its critical role as a precursor for chlorine dioxide, a powerful disinfectant and bleaching agent. Growth is closely tied to the global emphasis on water quality, driving demand in municipal and industrial water treatment for its superior biocidal efficacy against a broad spectrum of pathogens.
  • Simultaneously, the pulp and paper industry relies on it for elemental chlorine free bleaching processes that meet modern environmental standards. A key dynamic involves navigating stringent regulations surrounding disinfection byproduct control and hazardous material handling.
  • For instance, a paper mill might implement an advanced chlorine dioxide generation system to optimize its pulp bleaching chemical usage, achieving a higher brightness standard while reducing effluent treatment loads, thereby balancing operational efficiency with environmental compliance.
  • This interplay between industrial necessity, regulatory pressure, and the push for sustainable practices defines the market's trajectory, compelling continuous innovation in high purity sodium chlorite formulations and application technologies.

What will be the Size of the Sodium Chlorite Market during the forecast period?

Get Key Insights on Market Forecast (PDF) Request Free Sample

How is the Sodium Chlorite Market Segmented?

The sodium chlorite industry research report provides comprehensive data (region-wise segment analysis), with forecasts and estimates in "USD million" for the period 2025-2029, as well as historical data from 2019-2023 for the following segments.

  • Application
    • Water treatment
    • Paper
    • Others
  • Grade type
    • Industrial grade
    • Food grade
    • Pharmaceutical grade
  • Raw material
    • Sodium hydroxide
    • Hydrogen peroxide
    • Chlorine dioxide
  • Geography
    • APAC
      • China
      • India
      • Japan
    • North America
      • US
      • Canada
      • Mexico
    • Europe
      • Germany
      • UK
      • France
    • South America
      • Brazil
      • Argentina
    • Middle East and Africa
      • South Africa
      • Saudi Arabia
      • UAE
    • Rest of World (ROW)

By Application Insights

The water treatment segment is estimated to witness significant growth during the forecast period.

The water treatment segment leverages sodium chlorite for its potent oxidizing agent properties, particularly for on-site chemical generation of chlorine dioxide.

Demand is driven by the need to manage public health risks in water systems, where it functions as an effective algaecide for cooling towers and aids in legionella control in plumbing.

The use of high purity sodium chlorite is critical in applications requiring direct food contact surface sanitizer capabilities or as a disinfectant for the beverage industry. Formulations are also developed for corrosion inhibitor formulation.

The effectiveness of these solutions has led to utilities reporting up to a 15% reduction in certain microbial contaminants compared to legacy treatments, reinforcing its importance for odor control in wastewater and ensuring safe water distribution.

Request Free Sample

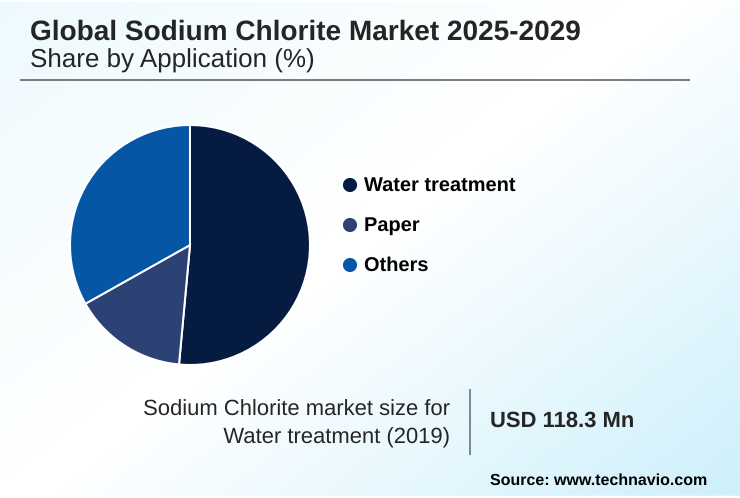
The Water treatment segment was valued at USD 152.7 million in 2023 and showed a gradual increase during the forecast period.

Request Free Sample

Regional Analysis

APAC is estimated to contribute 46.9% to the growth of the global market during the forecast period.Technavio’s analysts have elaborately explained the regional trends and drivers that shape the market during the forecast period.

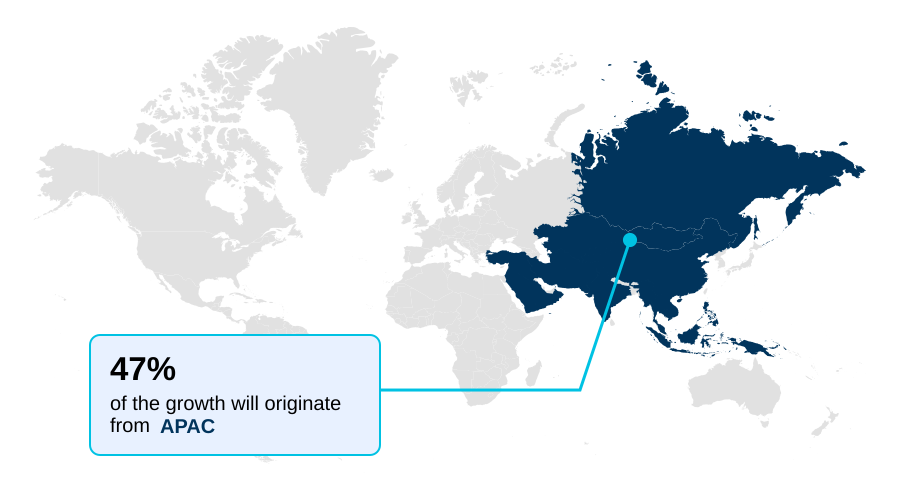
See How Sodium Chlorite Market Demand is Rising in APAC Request Free Sample

The Asia-Pacific region, accounting for over 46% of incremental market growth, is central to the global landscape. This dominance is driven by extensive industrial activity, particularly in textile finishing process applications and the demand for elemental chlorine free bleaching.

The use of aqueous sodium chlorite solution as a bactericide formulation is widespread in the region's rapidly expanding food processing sanitation sector.

Key applications such as its role as a leather processing chemical and for TOC reduction in water treatment systems are also significant.

For example, industrial facilities in the region have achieved an 18% improvement in wastewater deodorizer efficiency by adopting stabilized chlorine dioxide systems for biofilm removal from surfaces, showcasing the drive for operational and environmental performance improvements.

Market Dynamics

Our researchers analyzed the data with 2024 as the base year, along with the key drivers, trends, and challenges. A holistic analysis of drivers will help companies refine their marketing strategies to gain a competitive advantage.

  • The global sodium chlorite market is shaped by a diverse range of specific applications and grades. The use of sodium chlorite for municipal water treatment remains a primary driver, where its role as a disinfectant precursor is critical for public health. In parallel, industrial grade sodium chlorite for paper manufacturing enables cleaner bleaching processes.
  • Understanding sodium chlorite as a disinfectant precursor is key to its adoption across industries. The demand for both food grade sodium chlorite uses and pharmaceutical grade sodium chlorite applications is growing, driven by stricter hygiene and safety standards. Consequently, adherence to sodium chlorite handling and safety protocols is paramount.
  • Businesses are increasingly evaluating the cost-effectiveness of chlorine dioxide generation, often making a direct comparison between sodium chlorite versus sodium hypochlorite, where the former offers superior performance in certain conditions. The environmental impact of sodium chlorite and associated regulatory standards for sodium chlorite are significant considerations for producers and end-users alike.
  • Its role in sodium chlorite in textile bleaching and using sodium chlorite for odor control highlights its versatility. Furthermore, its application in sodium chlorite for food processing sanitation is expanding.
  • The reliability of high purity sodium chlorite suppliers and the integrity of the supply chain for sodium chlorite are crucial, as organizations that master this can achieve logistics costs that are 5% lower than their competitors. The technical nuances of sodium chlorite solution concentration effects and the bleaching performance of acidified sodium chlorite are vital for process optimization.
  • Finally, niche but important applications include controlling chlorate in drinking water, its use in sodium chlorite for oilfield water treatment, and its function in the sodium chlorite in leather tanning industry.

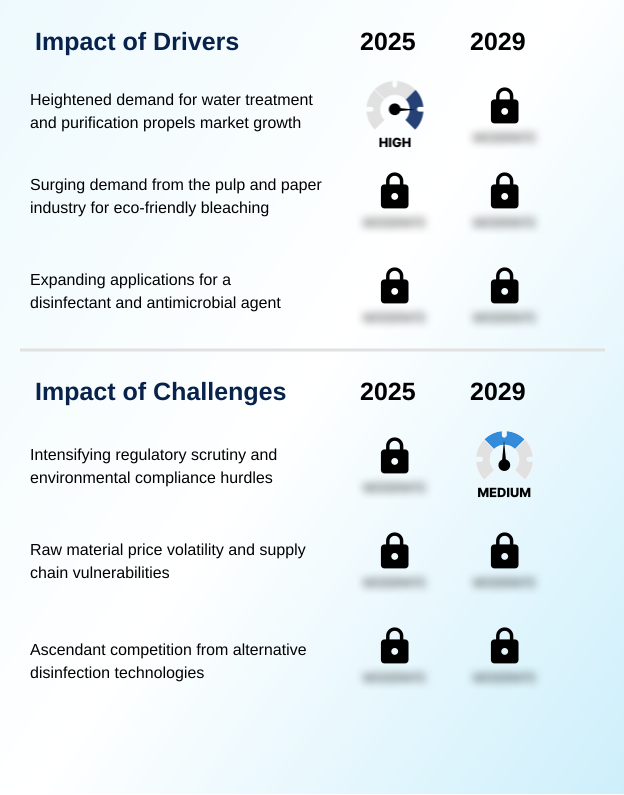
What are the key market drivers leading to the rise in the adoption of Sodium Chlorite Industry?

  • Heightened demand for effective water treatment and industrial purification applications serves as a key driver for market growth.

  • The market's primary driver remains its indispensable function as a chlorine dioxide precursor, which is foundational to modern disinfection and bleaching operations.
  • The demand for an effective water disinfection agent for safe drinking water act compliance propels its use in chlorine dioxide generation system setups.
  • In the industrial sector, its role as a pulp bleaching chemical is critical for the delignification in pulp and achieving high brightness in pulp mill bleaching sequence processes.
  • Growth in the energy sector also contributes, where it is used as a microbial control formulation and slime control agent in applications like secondary oil recovery biocide.
  • The healthcare industry's need for reliable sterilization methods supports its use as a chemosterilant for medical devices. Across these sectors, firms focused on wastewater treatment compliance have seen a 20% improvement in meeting regulatory targets through optimized industrial disinfectant application.

What are the market trends shaping the Sodium Chlorite Industry?

  • An intensified focus on water purification and disinfection is a prominent market trend, driven by increasingly stringent water quality standards and growing public health concerns globally.

  • Emerging trends are expanding the utility of sodium chlorite beyond traditional uses, focusing on its high biocidal efficacy. Innovations in paper pulp bleaching technology are leveraging its properties for cleaner production, while its role as an industrial water treatment chemical is growing, especially as a cooling water system biocide for microbiological contamination control.
  • The demand for crystalline sodium chlorite form as a virucidal agent for specialized sanitation is increasing. The effectiveness of this textile bleaching compound in the bleaching of textiles has led to process optimizations that reduce water consumption by up to 10%. Furthermore, its application in aseptic packaging sterilization is gaining traction.
  • The market is also adapting to stricter environmental compliance for chemicals, prompting research into more efficient oxidative decomposition pathways and better management of water quality parameters, particularly in municipal water purification.

What challenges does the Sodium Chlorite Industry face during its growth?

  • Intensifying regulatory scrutiny and the complexities of environmental compliance hurdles present a key challenge to industry growth.

  • Navigating the complex regulatory landscape is a central challenge, particularly concerning disinfection byproduct control and the need for chlorate formation minimization. Adherence to stringent disinfection byproduct regulations requires precise management of this selective oxidizing agent to prevent unwanted chemical reactions.
  • The inherent risks associated with its classification as a hazardous material demand strict safe chemical handling protocols, adding operational complexity and cost. For example, implementing compliant handling procedures can increase operational overhead by 5-8%. Furthermore, the development of acidified sodium chlorite applications must account for these safety and regulatory factors.
  • The market also faces competition from alternative technologies in sectors such as biosecurity in agriculture and as a biocide for oil and gas, pushing for greater efficiency and cost-effectiveness in areas like tannery waste treatment and overall microbiological contamination control.

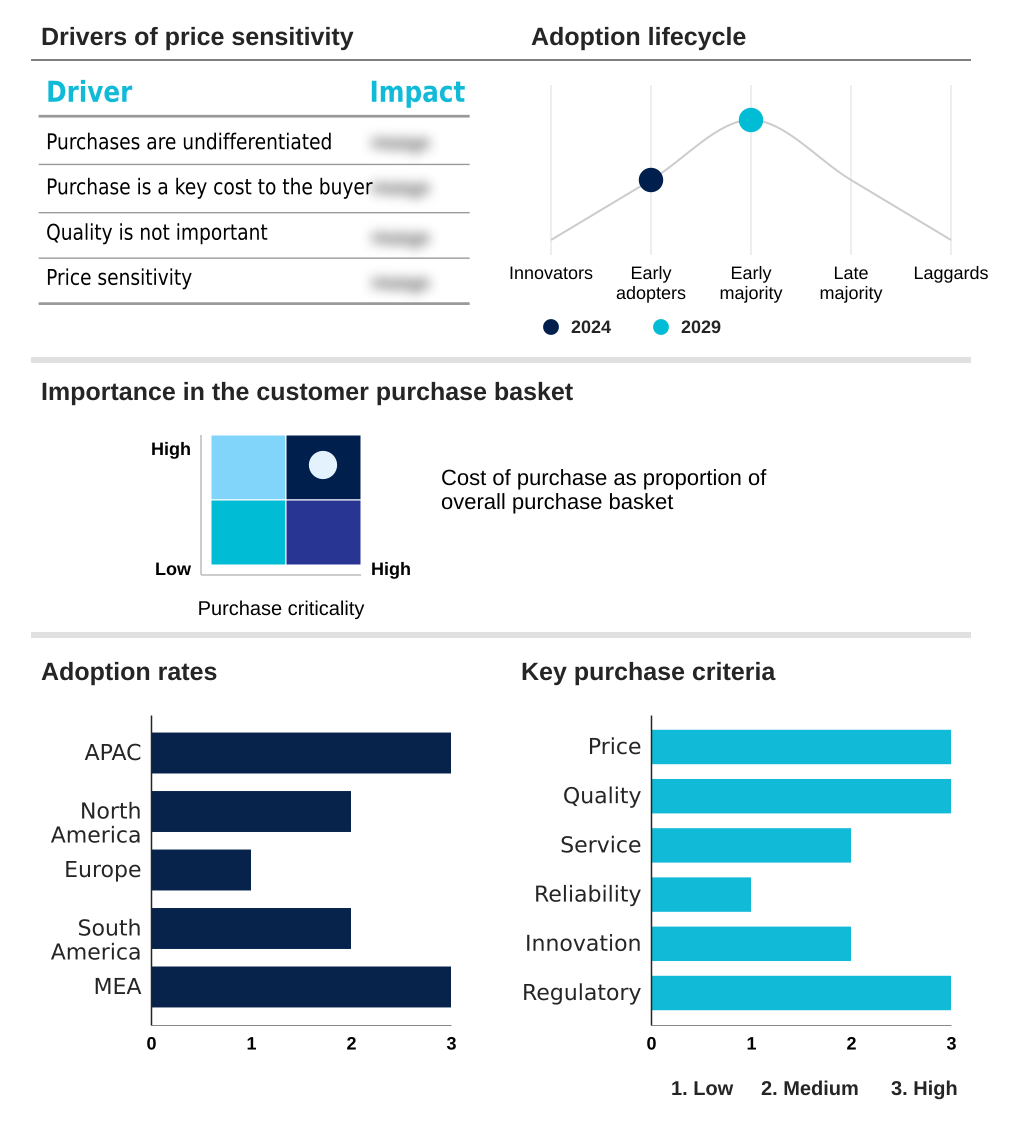
Exclusive Technavio Analysis on Customer Landscape

The sodium chlorite market forecasting report includes the adoption lifecycle of the market, covering from the innovator’s stage to the laggard’s stage. It focuses on adoption rates in different regions based on penetration. Furthermore, the sodium chlorite market report also includes key purchase criteria and drivers of price sensitivity to help companies evaluate and develop their market growth analysis strategies.

Customer Landscape of Sodium Chlorite Industry

Competitive Landscape

Companies are implementing various strategies, such as strategic alliances, sodium chlorite market forecast, partnerships, mergers and acquisitions, geographical expansion, and product/service launches, to enhance their presence in the industry.

Airedale Group - Provides specialized sodium chlorite solutions catering to industrial and water treatment sectors, emphasizing tailored concentrations for diverse applications.

The industry research and growth report includes detailed analyses of the competitive landscape of the market and information about key companies, including:

  • Airedale Group
  • American Elements Inc.
  • Carlit Co. Ltd.
  • Dongying Shengya Chemical Co. Ltd.
  • ERCO Worldwide
  • Ercros SA
  • Fengchen Group Co. Ltd.
  • International Dioxcide Inc.
  • Occidental Petroleum Corp.
  • OSAKA SODA CO. Ltd.
  • Otto Chemie Pvt. Ltd.
  • Sabara Group
  • Shandong Gaomi Gaoyuan Chemical Industry Co. Ltd.
  • Shree Chlorates Pvt. Ltd.
  • Sigma Aldrich Chemicals Ltd.
  • Thermo Fisher Scientific Inc.

Qualitative and quantitative analysis of companies has been conducted to help clients understand the wider business environment as well as the strengths and weaknesses of key industry players. Data is qualitatively analyzed to categorize companies as pure play, category-focused, industry-focused, and diversified; it is quantitatively analyzed to categorize companies as dominant, leading, strong, tentative, and weak.

Recent Development and News in Sodium chlorite market

  • In September 2024, Occidental Petroleum Corp. announced the acquisition of a regional chemical producer to enhance its production capacity for high-purity sodium chlorite solutions, aiming to better serve the North American water treatment market.
  • In November 2024, ERCO Worldwide launched a new-generation chlorine dioxide generator optimized for small-to-medium-sized municipal water facilities, improving the efficiency of on-site chemical generation by 15%.
  • In January 2025, Ercros SA formed a strategic partnership with a leading food safety technology firm to develop and market advanced acidified sodium chlorite formulations for antimicrobial applications in food processing.
  • In April 2025, OSAKA SODA CO. Ltd. completed the expansion of its primary manufacturing plant, increasing its output of industrial-grade sodium chlorite by 20% to meet growing demand from the pulp and paper sector in APAC.

Dive into Technavio’s robust research methodology, blending expert interviews, extensive data synthesis, and validated models for unparalleled Sodium Chlorite Market insights. See full methodology.

Market Scope
Page number 284
Base year 2024
Historic period 2019-2023
Forecast period 2025-2029
Growth momentum & CAGR Accelerate at a CAGR of 5.6%
Market growth 2025-2029 USD 89.6 million
Market structure Fragmented
YoY growth 2024-2025(%) 5.1%
Key countries China, India, Japan, South Korea, Vietnam, Australia, US, Canada, Mexico, Germany, UK, France, Italy, Spain, The Netherlands, Brazil, Argentina, Chile, South Africa, Saudi Arabia, UAE, Egypt and Morocco
Competitive landscape Leading Companies, Market Positioning of Companies, Competitive Strategies, and Industry Risks

Request Free Sample

Research Analyst Overview

  • The sodium chlorite market is defined by its core function as a chlorine dioxide precursor, with its utility spanning multiple critical sectors. Strategic decisions hinge on balancing the biocidal efficacy and oxidizing agent properties of various formulations against stringent regulatory requirements for disinfection byproduct control.
  • The choice between a crystalline sodium chlorite form and an aqueous sodium chlorite solution often depends on logistics and on-site chemical generation capabilities. In industrial settings, it serves as a vital pulp bleaching chemical for elemental chlorine free bleaching and a versatile textile bleaching compound.
  • As a water disinfection agent and microbial control formulation, its applications are extensive, from being an algaecide for cooling towers to a chemosterilant for medical devices. A key boardroom consideration is the investment in technologies that support chlorate formation minimization and the sodium chlorate reduction process.
  • For instance, advanced water treatment facilities have demonstrated a 25% improvement in managing byproduct levels through precise dosing of this selective oxidizing agent. The market's complexity is further highlighted by its roles as a food contact surface sanitizer, biocide for oil and gas, and its use in delignification in pulp, demanding rigorous hazardous material handling protocols.

What are the Key Data Covered in this Sodium Chlorite Market Research and Growth Report?

  • What is the expected growth of the Sodium Chlorite Market between 2025 and 2029?

    • USD 89.6 million, at a CAGR of 5.6%

  • What segmentation does the market report cover?

    • The report is segmented by Application (Water treatment, Paper, and Others), Grade Type (Industrial grade, Food grade, and Pharmaceutical grade), Raw Material (Sodium hydroxide, Hydrogen peroxide, and Chlorine dioxide) and Geography (APAC, North America, Europe, South America, Middle East and Africa)

  • Which regions are analyzed in the report?

    • APAC, North America, Europe, South America and Middle East and Africa

  • What are the key growth drivers and market challenges?

    • Heightened demand for water treatment and purification propels market growth, Intensifying regulatory scrutiny and environmental compliance hurdles

  • Who are the major players in the Sodium Chlorite Market?

    • Airedale Group, American Elements Inc., Carlit Co. Ltd., Dongying Shengya Chemical Co. Ltd., ERCO Worldwide, Ercros SA, Fengchen Group Co. Ltd., International Dioxcide Inc., Occidental Petroleum Corp., OSAKA SODA CO. Ltd., Otto Chemie Pvt. Ltd., Sabara Group, Shandong Gaomi Gaoyuan Chemical Industry Co. Ltd., Shree Chlorates Pvt. Ltd., Sigma Aldrich Chemicals Ltd. and Thermo Fisher Scientific Inc.

Market Research Insights

  • Market dynamics are increasingly influenced by efficiency gains tied to specific applications. The adoption of modern chlorine dioxide generation system technology allows for better oxidant demand management, with some industrial disinfectant application users reporting a 10% reduction in chemical consumption. In the context of wastewater treatment compliance, optimized systems contribute to more consistent outcomes, aligning with stringent discharge limits.
  • For pulp and paper producers, advanced paper pulp bleaching technology shortens processing times by up to 5%, directly impacting production throughput. This focus on operational efficiency and regulatory adherence, including safe drinking water act compliance, shapes investment decisions and technology adoption across key industrial sectors.

We can help! Our analysts can customize this sodium chlorite market research report to meet your requirements.

Get in touch

1. Executive Summary

1.1 Market overview

Executive Summary - Chart on Market Overview
Executive Summary - Data Table on Market Overview
Executive Summary - Chart on Global Market Characteristics
Executive Summary - Chart on Market by Geography
Executive Summary - Chart on Market Segmentation by Application
Executive Summary - Chart on Market Segmentation by Grade Type
Executive Summary - Chart on Market Segmentation by Raw Material
Executive Summary - Chart on Incremental Growth
Executive Summary - Data Table on Incremental Growth
Executive Summary - Chart on Company Market Positioning

2. Technavio Analysis

2.1 Analysis of price sensitivity, lifecycle, customer purchase basket, adoption rates, and purchase criteria

2.2 Criticality of inputs and Factors of differentiation

Chart on Overview on criticality of inputs and factors of differentiation

2.3 Factors of disruption

Chart on Overview on factors of disruption

2.4 Impact of drivers and challenges

Chart on Impact of drivers and challenges in 2024 and 2029

3. Market Landscape

3.1 Market ecosystem

Chart on Parent Market
Data Table on - Parent Market

3.2 Market characteristics

Chart on Market characteristics analysis

3.3 Value chain analysis

Chart on Value chain analysis

4. Market Sizing

4.1 Market definition

Data Table on Offerings of companies included in the market definition

4.2 Market segment analysis

Market segments

4.3 Market size 2024

4.4 Market outlook: Forecast for 2024-2029

Chart on Global - Market size and forecast 2024-2029 ($ million)
Data Table on Global - Market size and forecast 2024-2029 ($ million)
Chart on Global Market: Year-over-year growth 2024-2029 (%)
Data Table on Global Market: Year-over-year growth 2024-2029 (%)

5. Historic Market Size

5.1 Global Sodium Chlorite Market 2019 - 2023

Historic Market Size - Data Table on Global Sodium Chlorite Market 2019 - 2023 ($ million)

5.2 Application segment analysis 2019 - 2023

Historic Market Size - Application Segment 2019 - 2023 ($ million)

5.3 Grade Type segment analysis 2019 - 2023

Historic Market Size - Grade Type Segment 2019 - 2023 ($ million)

5.4 Raw Material segment analysis 2019 - 2023

Historic Market Size - Raw Material Segment 2019 - 2023 ($ million)

5.5 Geography segment analysis 2019 - 2023

Historic Market Size - Geography Segment 2019 - 2023 ($ million)

5.6 Country segment analysis 2019 - 2023

Historic Market Size - Country Segment 2019 - 2023 ($ million)

6. Qualitative Analysis

6.1 Impact of AI on Global Sodium Chlorite Market

7. Five Forces Analysis

7.1 Five forces summary

Five forces analysis - Comparison between 2024 and 2029

7.2 Bargaining power of buyers

Bargaining power of buyers - Impact of key factors 2024 and 2029

7.3 Bargaining power of suppliers

Bargaining power of suppliers - Impact of key factors in 2024 and 2029

7.4 Threat of new entrants

Threat of new entrants - Impact of key factors in 2024 and 2029

7.5 Threat of substitutes

Threat of substitutes - Impact of key factors in 2024 and 2029

7.6 Threat of rivalry

Threat of rivalry - Impact of key factors in 2024 and 2029

7.7 Market condition

Chart on Market condition - Five forces 2024 and 2029

8. Market Segmentation by Application

8.1 Market segments

Chart on Application - Market share 2024-2029 (%)
Data Table on Application - Market share 2024-2029 (%)

8.2 Comparison by Application

Chart on Comparison by Application
Data Table on Comparison by Application

8.3 Water treatment - Market size and forecast 2024-2029

Chart on Water treatment - Market size and forecast 2024-2029 ($ million)
Data Table on Water treatment - Market size and forecast 2024-2029 ($ million)
Chart on Water treatment - Year-over-year growth 2024-2029 (%)
Data Table on Water treatment - Year-over-year growth 2024-2029 (%)

8.4 Paper - Market size and forecast 2024-2029

Chart on Paper - Market size and forecast 2024-2029 ($ million)
Data Table on Paper - Market size and forecast 2024-2029 ($ million)
Chart on Paper - Year-over-year growth 2024-2029 (%)
Data Table on Paper - Year-over-year growth 2024-2029 (%)

8.5 Others - Market size and forecast 2024-2029

Chart on Others - Market size and forecast 2024-2029 ($ million)
Data Table on Others - Market size and forecast 2024-2029 ($ million)
Chart on Others - Year-over-year growth 2024-2029 (%)
Data Table on Others - Year-over-year growth 2024-2029 (%)

8.6 Market opportunity by Application

Market opportunity by Application ($ million)
Data Table on Market opportunity by Application ($ million)

9. Market Segmentation by Grade Type

9.1 Market segments

Chart on Grade Type - Market share 2024-2029 (%)
Data Table on Grade Type - Market share 2024-2029 (%)

9.2 Comparison by Grade Type

Chart on Comparison by Grade Type
Data Table on Comparison by Grade Type

9.3 Industrial grade - Market size and forecast 2024-2029

Chart on Industrial grade - Market size and forecast 2024-2029 ($ million)
Data Table on Industrial grade - Market size and forecast 2024-2029 ($ million)
Chart on Industrial grade - Year-over-year growth 2024-2029 (%)
Data Table on Industrial grade - Year-over-year growth 2024-2029 (%)

9.4 Food grade - Market size and forecast 2024-2029

Chart on Food grade - Market size and forecast 2024-2029 ($ million)
Data Table on Food grade - Market size and forecast 2024-2029 ($ million)
Chart on Food grade - Year-over-year growth 2024-2029 (%)
Data Table on Food grade - Year-over-year growth 2024-2029 (%)

9.5 Pharmaceutical grade - Market size and forecast 2024-2029

Chart on Pharmaceutical grade - Market size and forecast 2024-2029 ($ million)
Data Table on Pharmaceutical grade - Market size and forecast 2024-2029 ($ million)
Chart on Pharmaceutical grade - Year-over-year growth 2024-2029 (%)
Data Table on Pharmaceutical grade - Year-over-year growth 2024-2029 (%)

9.6 Market opportunity by Grade Type

Market opportunity by Grade Type ($ million)
Data Table on Market opportunity by Grade Type ($ million)

10. Market Segmentation by Raw Material

10.1 Market segments

Chart on Raw Material - Market share 2024-2029 (%)
Data Table on Raw Material - Market share 2024-2029 (%)

10.2 Comparison by Raw Material

Chart on Comparison by Raw Material
Data Table on Comparison by Raw Material

10.3 Sodium hydroxide - Market size and forecast 2024-2029

Chart on Sodium hydroxide - Market size and forecast 2024-2029 ($ million)
Data Table on Sodium hydroxide - Market size and forecast 2024-2029 ($ million)
Chart on Sodium hydroxide - Year-over-year growth 2024-2029 (%)
Data Table on Sodium hydroxide - Year-over-year growth 2024-2029 (%)

10.4 Hydrogen peroxide - Market size and forecast 2024-2029

Chart on Hydrogen peroxide - Market size and forecast 2024-2029 ($ million)
Data Table on Hydrogen peroxide - Market size and forecast 2024-2029 ($ million)
Chart on Hydrogen peroxide - Year-over-year growth 2024-2029 (%)
Data Table on Hydrogen peroxide - Year-over-year growth 2024-2029 (%)

10.5 Chlorine dioxide - Market size and forecast 2024-2029

Chart on Chlorine dioxide - Market size and forecast 2024-2029 ($ million)
Data Table on Chlorine dioxide - Market size and forecast 2024-2029 ($ million)
Chart on Chlorine dioxide - Year-over-year growth 2024-2029 (%)
Data Table on Chlorine dioxide - Year-over-year growth 2024-2029 (%)

10.6 Market opportunity by Raw Material

Market opportunity by Raw Material ($ million)
Data Table on Market opportunity by Raw Material ($ million)

11. Customer Landscape

11.1 Customer landscape overview

Analysis of price sensitivity, lifecycle, customer purchase basket, adoption rates, and purchase criteria

12. Geographic Landscape

12.1 Geographic segmentation

Chart on Market share by geography 2024-2029 (%)
Data Table on Market share by geography 2024-2029 (%)

12.2 Geographic comparison

Chart on Geographic comparison
Data Table on Geographic comparison

12.3 APAC - Market size and forecast 2024-2029

Chart on APAC - Market size and forecast 2024-2029 ($ million)
Data Table on APAC - Market size and forecast 2024-2029 ($ million)
Chart on APAC - Year-over-year growth 2024-2029 (%)
Data Table on APAC - Year-over-year growth 2024-2029 (%)
Chart on Regional Comparison - APAC
Data Table on Regional Comparison - APAC

12.3.1 China - Market size and forecast 2024-2029

Chart on China - Market size and forecast 2024-2029 ($ million)
Data Table on China - Market size and forecast 2024-2029 ($ million)
Chart on China - Year-over-year growth 2024-2029 (%)
Data Table on China - Year-over-year growth 2024-2029 (%)

12.3.2 India - Market size and forecast 2024-2029

Chart on India - Market size and forecast 2024-2029 ($ million)
Data Table on India - Market size and forecast 2024-2029 ($ million)
Chart on India - Year-over-year growth 2024-2029 (%)
Data Table on India - Year-over-year growth 2024-2029 (%)

12.3.3 Japan - Market size and forecast 2024-2029

Chart on Japan - Market size and forecast 2024-2029 ($ million)
Data Table on Japan - Market size and forecast 2024-2029 ($ million)
Chart on Japan - Year-over-year growth 2024-2029 (%)
Data Table on Japan - Year-over-year growth 2024-2029 (%)

12.3.4 South Korea - Market size and forecast 2024-2029

Chart on South Korea - Market size and forecast 2024-2029 ($ million)
Data Table on South Korea - Market size and forecast 2024-2029 ($ million)
Chart on South Korea - Year-over-year growth 2024-2029 (%)
Data Table on South Korea - Year-over-year growth 2024-2029 (%)

12.3.5 Vietnam - Market size and forecast 2024-2029

Chart on Vietnam - Market size and forecast 2024-2029 ($ million)
Data Table on Vietnam - Market size and forecast 2024-2029 ($ million)
Chart on Vietnam - Year-over-year growth 2024-2029 (%)
Data Table on Vietnam - Year-over-year growth 2024-2029 (%)

12.3.6 Australia - Market size and forecast 2024-2029

Chart on Australia - Market size and forecast 2024-2029 ($ million)
Data Table on Australia - Market size and forecast 2024-2029 ($ million)
Chart on Australia - Year-over-year growth 2024-2029 (%)
Data Table on Australia - Year-over-year growth 2024-2029 (%)

12.4 North America - Market size and forecast 2024-2029

Chart on North America - Market size and forecast 2024-2029 ($ million)
Data Table on North America - Market size and forecast 2024-2029 ($ million)
Chart on North America - Year-over-year growth 2024-2029 (%)
Data Table on North America - Year-over-year growth 2024-2029 (%)
Chart on Regional Comparison - North America
Data Table on Regional Comparison - North America

12.4.1 US - Market size and forecast 2024-2029

Chart on US - Market size and forecast 2024-2029 ($ million)
Data Table on US - Market size and forecast 2024-2029 ($ million)
Chart on US - Year-over-year growth 2024-2029 (%)
Data Table on US - Year-over-year growth 2024-2029 (%)

12.4.2 Canada - Market size and forecast 2024-2029

Chart on Canada - Market size and forecast 2024-2029 ($ million)
Data Table on Canada - Market size and forecast 2024-2029 ($ million)
Chart on Canada - Year-over-year growth 2024-2029 (%)
Data Table on Canada - Year-over-year growth 2024-2029 (%)

12.4.3 Mexico - Market size and forecast 2024-2029

Chart on Mexico - Market size and forecast 2024-2029 ($ million)
Data Table on Mexico - Market size and forecast 2024-2029 ($ million)
Chart on Mexico - Year-over-year growth 2024-2029 (%)
Data Table on Mexico - Year-over-year growth 2024-2029 (%)

12.5 Europe - Market size and forecast 2024-2029

Chart on Europe - Market size and forecast 2024-2029 ($ million)
Data Table on Europe - Market size and forecast 2024-2029 ($ million)
Chart on Europe - Year-over-year growth 2024-2029 (%)
Data Table on Europe - Year-over-year growth 2024-2029 (%)
Chart on Regional Comparison - Europe
Data Table on Regional Comparison - Europe

12.5.1 Germany - Market size and forecast 2024-2029

Chart on Germany - Market size and forecast 2024-2029 ($ million)
Data Table on Germany - Market size and forecast 2024-2029 ($ million)
Chart on Germany - Year-over-year growth 2024-2029 (%)
Data Table on Germany - Year-over-year growth 2024-2029 (%)

12.5.2 UK - Market size and forecast 2024-2029

Chart on UK - Market size and forecast 2024-2029 ($ million)
Data Table on UK - Market size and forecast 2024-2029 ($ million)
Chart on UK - Year-over-year growth 2024-2029 (%)
Data Table on UK - Year-over-year growth 2024-2029 (%)

12.5.3 France - Market size and forecast 2024-2029

Chart on France - Market size and forecast 2024-2029 ($ million)
Data Table on France - Market size and forecast 2024-2029 ($ million)
Chart on France - Year-over-year growth 2024-2029 (%)
Data Table on France - Year-over-year growth 2024-2029 (%)

12.5.4 Italy - Market size and forecast 2024-2029

Chart on Italy - Market size and forecast 2024-2029 ($ million)
Data Table on Italy - Market size and forecast 2024-2029 ($ million)
Chart on Italy - Year-over-year growth 2024-2029 (%)
Data Table on Italy - Year-over-year growth 2024-2029 (%)

12.5.5 Spain - Market size and forecast 2024-2029

Chart on Spain - Market size and forecast 2024-2029 ($ million)
Data Table on Spain - Market size and forecast 2024-2029 ($ million)
Chart on Spain - Year-over-year growth 2024-2029 (%)
Data Table on Spain - Year-over-year growth 2024-2029 (%)

12.5.6 The Netherlands - Market size and forecast 2024-2029

Chart on The Netherlands - Market size and forecast 2024-2029 ($ million)
Data Table on The Netherlands - Market size and forecast 2024-2029 ($ million)
Chart on The Netherlands - Year-over-year growth 2024-2029 (%)
Data Table on The Netherlands - Year-over-year growth 2024-2029 (%)

12.6 South America - Market size and forecast 2024-2029

Chart on South America - Market size and forecast 2024-2029 ($ million)
Data Table on South America - Market size and forecast 2024-2029 ($ million)
Chart on South America - Year-over-year growth 2024-2029 (%)
Data Table on South America - Year-over-year growth 2024-2029 (%)
Chart on Regional Comparison - South America
Data Table on Regional Comparison - South America

12.6.1 Brazil - Market size and forecast 2024-2029

Chart on Brazil - Market size and forecast 2024-2029 ($ million)
Data Table on Brazil - Market size and forecast 2024-2029 ($ million)
Chart on Brazil - Year-over-year growth 2024-2029 (%)
Data Table on Brazil - Year-over-year growth 2024-2029 (%)

12.6.2 Argentina - Market size and forecast 2024-2029

Chart on Argentina - Market size and forecast 2024-2029 ($ million)
Data Table on Argentina - Market size and forecast 2024-2029 ($ million)
Chart on Argentina - Year-over-year growth 2024-2029 (%)
Data Table on Argentina - Year-over-year growth 2024-2029 (%)

12.6.3 Chile - Market size and forecast 2024-2029

Chart on Chile - Market size and forecast 2024-2029 ($ million)
Data Table on Chile - Market size and forecast 2024-2029 ($ million)
Chart on Chile - Year-over-year growth 2024-2029 (%)
Data Table on Chile - Year-over-year growth 2024-2029 (%)

12.7 Middle East and Africa - Market size and forecast 2024-2029

Chart on Middle East and Africa - Market size and forecast 2024-2029 ($ million)
Data Table on Middle East and Africa - Market size and forecast 2024-2029 ($ million)
Chart on Middle East and Africa - Year-over-year growth 2024-2029 (%)
Data Table on Middle East and Africa - Year-over-year growth 2024-2029 (%)
Chart on Regional Comparison - Middle East and Africa
Data Table on Regional Comparison - Middle East and Africa

12.7.1 South Africa - Market size and forecast 2024-2029

Chart on South Africa - Market size and forecast 2024-2029 ($ million)
Data Table on South Africa - Market size and forecast 2024-2029 ($ million)
Chart on South Africa - Year-over-year growth 2024-2029 (%)
Data Table on South Africa - Year-over-year growth 2024-2029 (%)

12.7.2 Saudi Arabia - Market size and forecast 2024-2029

Chart on Saudi Arabia - Market size and forecast 2024-2029 ($ million)
Data Table on Saudi Arabia - Market size and forecast 2024-2029 ($ million)
Chart on Saudi Arabia - Year-over-year growth 2024-2029 (%)
Data Table on Saudi Arabia - Year-over-year growth 2024-2029 (%)

12.7.3 UAE - Market size and forecast 2024-2029

Chart on UAE - Market size and forecast 2024-2029 ($ million)
Data Table on UAE - Market size and forecast 2024-2029 ($ million)
Chart on UAE - Year-over-year growth 2024-2029 (%)
Data Table on UAE - Year-over-year growth 2024-2029 (%)

12.7.4 Egypt - Market size and forecast 2024-2029

Chart on Egypt - Market size and forecast 2024-2029 ($ million)
Data Table on Egypt - Market size and forecast 2024-2029 ($ million)
Chart on Egypt - Year-over-year growth 2024-2029 (%)
Data Table on Egypt - Year-over-year growth 2024-2029 (%)

12.7.5 Morocco - Market size and forecast 2024-2029

Chart on Morocco - Market size and forecast 2024-2029 ($ million)
Data Table on Morocco - Market size and forecast 2024-2029 ($ million)
Chart on Morocco - Year-over-year growth 2024-2029 (%)
Data Table on Morocco - Year-over-year growth 2024-2029 (%)

12.8 Market opportunity by geography

Market opportunity by geography ($ million)
Data Tables on Market opportunity by geography ($ million)

13. Drivers, Challenges, and Opportunity

13.1 Market drivers

Heightened demand for water treatment and purification propels market growth
Surging demand from the pulp and paper industry for eco-friendly bleaching
Expanding applications for a disinfectant and antimicrobial agent

13.2 Market challenges

Intensifying regulatory scrutiny and environmental compliance hurdles
Raw material price volatility and supply chain vulnerabilities
Ascendant competition from alternative disinfection technologies

13.3 Impact of drivers and challenges

Impact of drivers and challenges in 2024 and 2029

13.4 Market opportunities

Heightened focus on water purification and disinfection
Surge in demand for sustainable bleaching in textiles and paper
Dominance and strategic expansion in the APAC region

14. Competitive Landscape

14.1 Overview

14.2

Overview on criticality of inputs and factors of differentiation

14.3 Landscape disruption

Overview on factors of disruption

14.4 Industry risks

Impact of key risks on business

15. Competitive Analysis

15.1 Companies profiled

Companies covered

15.2 Company ranking index

15.3 Market positioning of companies

Matrix on companies position and classification

15.4 Airedale Group

Airedale Group - Overview
Airedale Group - Product / Service
Airedale Group - Key offerings
SWOT

15.5 American Elements Inc.

American Elements Inc. - Overview
American Elements Inc. - Product / Service
American Elements Inc. - Key offerings
SWOT

15.6 Carlit Co. Ltd.

Carlit Co. Ltd. - Overview
Carlit Co. Ltd. - Product / Service
Carlit Co. Ltd. - Key offerings
SWOT

15.7 Dongying Shengya Chemical Co. Ltd.

Dongying Shengya Chemical Co. Ltd. - Overview
Dongying Shengya Chemical Co. Ltd. - Product / Service
Dongying Shengya Chemical Co. Ltd. - Key offerings
SWOT

15.8 ERCO Worldwide

ERCO Worldwide - Overview
ERCO Worldwide - Product / Service
ERCO Worldwide - Key offerings
SWOT

15.9 Ercros SA

Ercros SA - Overview
Ercros SA - Business segments
Ercros SA - Key news
Ercros SA - Key offerings
Ercros SA - Segment focus
SWOT

15.10 Fengchen Group Co. Ltd.

Fengchen Group Co. Ltd. - Overview
Fengchen Group Co. Ltd. - Product / Service
Fengchen Group Co. Ltd. - Key offerings
SWOT

15.11 International Dioxcide Inc.

International Dioxcide Inc. - Overview
International Dioxcide Inc. - Product / Service
International Dioxcide Inc. - Key offerings
SWOT

15.12 Occidental Petroleum Corp.

Occidental Petroleum Corp. - Overview
Occidental Petroleum Corp. - Business segments
Occidental Petroleum Corp. - Key news
Occidental Petroleum Corp. - Key offerings
Occidental Petroleum Corp. - Segment focus
SWOT

15.13 OSAKA SODA CO. Ltd.

OSAKA SODA CO. Ltd. - Overview
OSAKA SODA CO. Ltd. - Business segments
OSAKA SODA CO. Ltd. - Key offerings
OSAKA SODA CO. Ltd. - Segment focus
SWOT

15.14 Otto Chemie Pvt. Ltd.

Otto Chemie Pvt. Ltd. - Overview
Otto Chemie Pvt. Ltd. - Product / Service
Otto Chemie Pvt. Ltd. - Key offerings
SWOT

15.15 Sabara Group

Sabara Group - Overview
Sabara Group - Product / Service
Sabara Group - Key offerings
SWOT

15.16 Shandong Gaomi Gaoyuan Chemical Industry Co. Ltd.

Shandong Gaomi Gaoyuan Chemical Industry Co. Ltd. - Overview
Shandong Gaomi Gaoyuan Chemical Industry Co. Ltd. - Product / Service
Shandong Gaomi Gaoyuan Chemical Industry Co. Ltd. - Key offerings
SWOT

15.17 Shree Chlorates Pvt. Ltd.

Shree Chlorates Pvt. Ltd. - Overview
Shree Chlorates Pvt. Ltd. - Product / Service
Shree Chlorates Pvt. Ltd. - Key offerings
SWOT

15.18 Sigma Aldrich Chemicals Ltd.

Sigma Aldrich Chemicals Ltd. - Overview
Sigma Aldrich Chemicals Ltd. - Product / Service
Sigma Aldrich Chemicals Ltd. - Key offerings
SWOT

16. Appendix

16.1 Scope of the report

Market definition
Objectives
Notes and caveats

16.2 Inclusions and exclusions checklist

Inclusions checklist
Exclusions checklist

16.3 Currency conversion rates for US$

16.4 Research methodology

16.5 Data procurement

Information sources

16.6 Data validation

16.7 Validation techniques employed for market sizing

16.8 Data synthesis

16.9 360 degree market analysis

16.10 List of abbreviations

Research Methodology

Technavio presents a detailed picture of the market by way of study, synthesis, and summation of data from multiple sources. The analysts have presented the various facets of the market with a particular focus on identifying the key industry influencers. The data thus presented is comprehensive, reliable, and the result of extensive research, both primary and secondary.

INFORMATION SOURCES

Primary sources

  • Manufacturers and suppliers
  • Channel partners
  • Industry experts
  • Strategic decision makers

Secondary sources

  • Industry journals and periodicals
  • Government data
  • Financial reports of key industry players
  • Historical data
  • Press releases

DATA ANALYSIS

Data Synthesis

  • Collation of data
  • Estimation of key figures
  • Analysis of derived insights

Data Validation

  • Triangulation with data models
  • Reference against proprietary databases
  • Corroboration with industry experts

REPORT WRITING

Qualitative

  • Market drivers
  • Market challenges
  • Market trends
  • Five forces analysis

Quantitative

  • Market size and forecast
  • Market segmentation
  • Geographical insights
  • Competitive landscape

Interested in this report?

Get your sample now to see our research methodology and insights!

Download Now

Frequently Asked Questions

Sodium Chlorite market growth will increase by USD 89.6 million during 2025-2029 .

The Sodium Chlorite market is expected to grow at a CAGR of 5.6% during 2025-2029 .

Sodium Chlorite market is segmented by Application (Water treatment, Paper, Others) Grade type (Industrial grade, Food grade, Pharmaceutical grade) Raw material (Sodium hydroxide, Hydrogen peroxide, Chlorine dioxide)

Airedale Group, American Elements Inc., Carlit Co. Ltd., Dongying Shengya Chemical Co. Ltd., ERCO Worldwide, Ercros SA, Fengchen Group Co. Ltd., International Dioxcide Inc., Occidental Petroleum Corp., OSAKA SODA CO. Ltd., Otto Chemie Pvt. Ltd., Sabara Group, Shandong Gaomi Gaoyuan Chemical Industry Co. Ltd., Shree Chlorates Pvt. Ltd., Sigma Aldrich Chemicals Ltd., Thermo Fisher Scientific Inc. are a few of the key vendors in the Sodium Chlorite market.

APAC will register the highest growth rate of 46.9% among the other regions. Therefore, the Sodium Chlorite market in APAC is expected to garner significant business opportunities for the vendors during the forecast period.

China, India, Japan, South Korea, Vietnam, Australia, US, Canada, Mexico, Germany, UK, France, Italy, Spain, The Netherlands, Brazil, Argentina, Chile, South Africa, Saudi Arabia, UAE, Egypt, Morocco

  • Heightened demand for water treatment and purification propels market growth is the driving factor this market.

The Sodium Chlorite market vendors should focus on grabbing business opportunities from the Application segment as it accounted for the largest market share in the base year.