
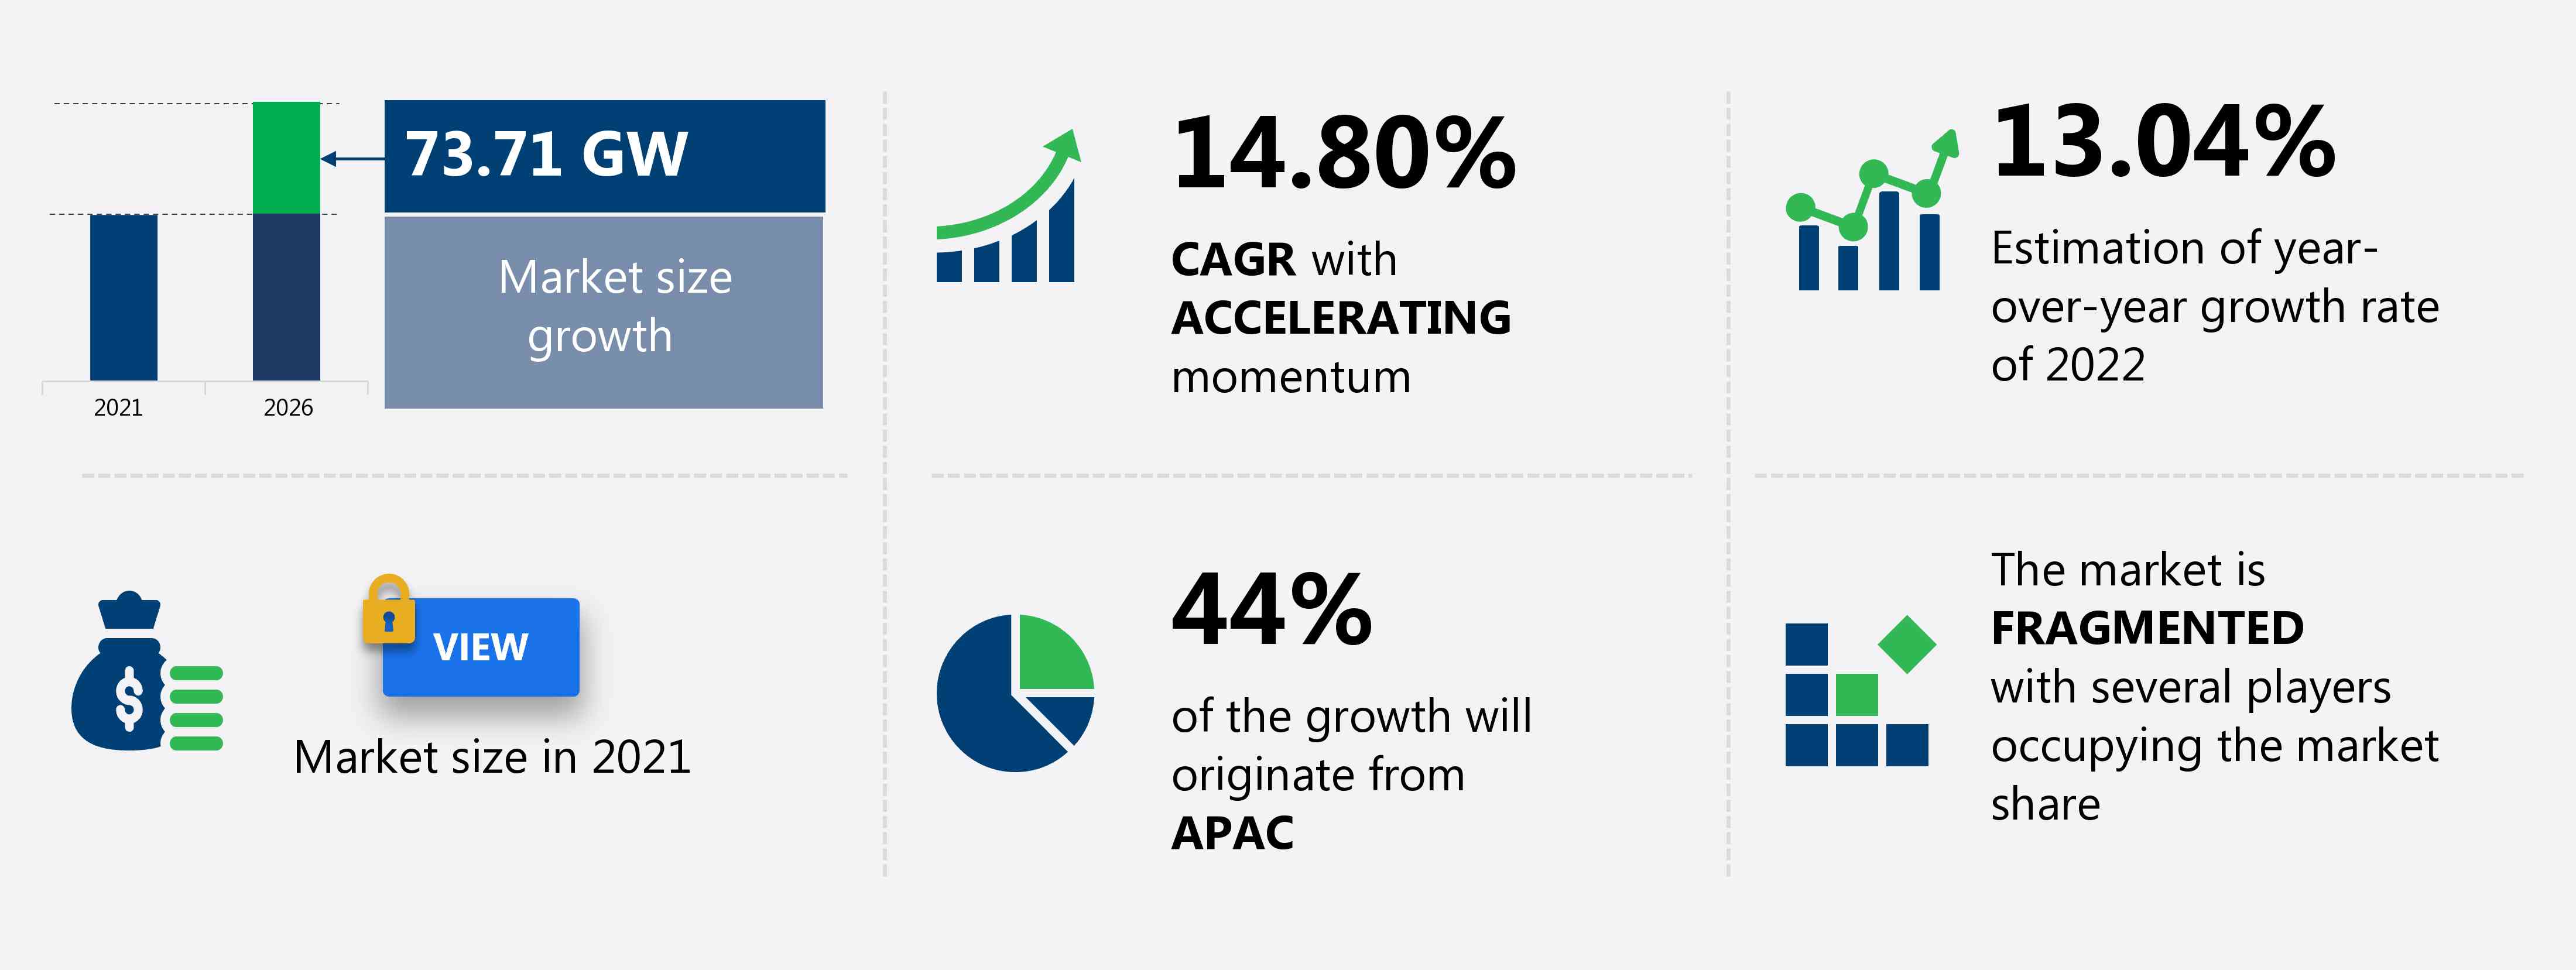
The solar photovoltaic wafer market share is expected to increase by 73.71 gigawatts from 2021 to 2026, and the market’s growth momentum will accelerate at a CAGR of 14.80%.
This solar photovoltaic wafer market research report provides valuable insights on the post COVID-19 impact on the market, which will help companies evaluate their business approaches. Furthermore, this report extensively covers solar photovoltaic wafer market segmentation by:
- End-user - Utility, commercial, and residential
- Geography - APAC, Europe, North America, South America, and MEA
The solar photovoltaic wafer market report also offers information on several market vendors, including CETC Solar Energy Holdings Co. Ltd., GCL Poly Energy Holdings Ltd, GlobalWafers Singapore Pte Ltd., JA Solar Technology Co. Ltd., JinkoSolar Holding Co. Ltd., Lanco Infratech Ltd., Longi green energy technology Co. Ltd., Sino-American Silicon Products Inc., SOLARWORLD Africa Pty Ltd., and Targray Technology International Inc. among others.
What will the Solar Photovoltaic Wafer Market Size be During the Forecast Period?
Download the Free Report Sample to Unlock the Solar Photovoltaic Wafer Market Size for the Forecast Period and Other Important Statistics
Solar Photovoltaic Wafer Market: Key Drivers, Trends, and Challenges
The increasing investments in renewable energy in APAC are notably driving the solar photovoltaic wafer market growth, although factors such as intermittency in solar power generation may impede the market growth. Our research analysts have studied the historical data and deduced the key market drivers and the COVID-19 pandemic impact on the solar photovoltaic wafer industry. The holistic analysis of the drivers will help in deducing end goals and refining marketing strategies to gain a competitive edge.
Key Solar Photovoltaic Wafer Market Driver
One of the key factors driving growth in the solar photovoltaic wafer market is the increasing investments in renewable energy in APAC. The global energy mix has changed significantly over the past two decades. Improvement in energy efficiency played a vital role in balancing the energy supply and demand. The total cost of producing electricity using renewables is relatively higher than that of conventional sources. However, renewable technology is evolving and giving competition to fossil fuel-based power plants. In India, installed renewable power generation capacity has gained pace over the past few years, posting a CAGR of 17.33% between FY16-20. With the increased support of government and improved economics, the sector has become attractive from the investors’ perspectives. The increased focus on renewable energy sources is increasing investments in the country’s solar energy sector, which, in turn, will drive the growth of the solar PV wafer market.
Key Solar Photovoltaic Wafer Market Trend
The advances in power electronics used in solar PV systems is another factor supporting the solar photovoltaic wafer market share growth. Power electronics is the process of controlling and converting electrical power flow from one form to another using semiconductor switching devices. The power electronics conversion technique has revolutionized electricity generation by increasing product efficiencies, streamlining manufacturing processes, and deploying modern technology such as computers to improve the delivery of power from utilities. The developments around power electronics could improve power flow control and coordinated voltage in solar PV systems, operations in microgrids, system operations during grid disturbances, and synthetic inertia for grid support. Several new power electronics offerings are being launched in the market, which reduces the O&M cost as well. Thus, these developments will significantly enhance the efficiency of solar PV systems and will further drive the adoption of solar energy among utilities. This, in turn, will drive the need for installation as well as O&M services, thus driving the growth of the market.
Key Solar Photovoltaic Wafer Market Challenge
The intermittency in solar power generation will be a major challenge for the solar photovoltaic wafer market during the forecast period. The adoption of solar power has been increasing due to the declining prices of solar power systems. This has increased the number of solar power installations over the years. However, the intermittent nature of solar power is a significant challenge that affects the adoption of solar power systems. The solar PV output is not continuous and depends on several factors such as the degree of shade, panel efficiency, and solar irradiation that changes over the duration of the day. Hence, it is not viable to have a power system that is completely reliant on solar power. The intermittent nature of solar power remains a major challenge for the growth of the solar power market, which, in turn, hinders the solar PV wafer market.
This solar photovoltaic wafer market analysis report also provides detailed information on other upcoming trends and challenges that will have a far-reaching effect on market growth. The actionable insights on the trends and challenges will help companies evaluate and develop growth strategies for 2022-2026.
Who are the Major Solar Photovoltaic Wafer Market Vendors?
The report analyzes the market’s competitive landscape and offers information on several market vendors, including:
- CETC Solar Energy Holdings Co. Ltd.
- GCL Poly Energy Holdings Ltd
- GlobalWafers Singapore Pte Ltd.
- JA Solar Technology Co. Ltd.
- JinkoSolar Holding Co. Ltd.
- Lanco Infratech Ltd.
- Longi green energy technology Co. Ltd.
- Sino-American Silicon Products Inc.
- SOLARWORLD Africa Pty Ltd.
- Targray Technology International Inc.
This statistical study of the solar photovoltaic wafer market encompasses successful business strategies deployed by the key vendors. The solar photovoltaic wafer market is fragmented and the vendors are deploying organic and inorganic growth strategies to compete in the market.
Product Insights and News
-
Lanco Infratech Ltd. - The company offers manufacture and sale of high purity polysilicon, silicon ingots/ wafers, and modules
-
CETC Solar Energy Holdings Co. Ltd. - The company offers manufacture and sale of solar products such as solar wafer, solar ingot and solar cells.
To make the most of the opportunities and recover from post COVID-19 impact, market vendors should focus more on the growth prospects in the fast-growing segments, while maintaining their positions in the slow-growing segments.
The solar photovoltaic wafer market forecast report offers in-depth insights into key vendor profiles. The profiles include information on the production, sustainability, and prospects of the leading companies.
Which are the Key Regions for Solar Photovoltaic Wafer Market?
For more insights on the market share of various regions Request for a FREE sample now!
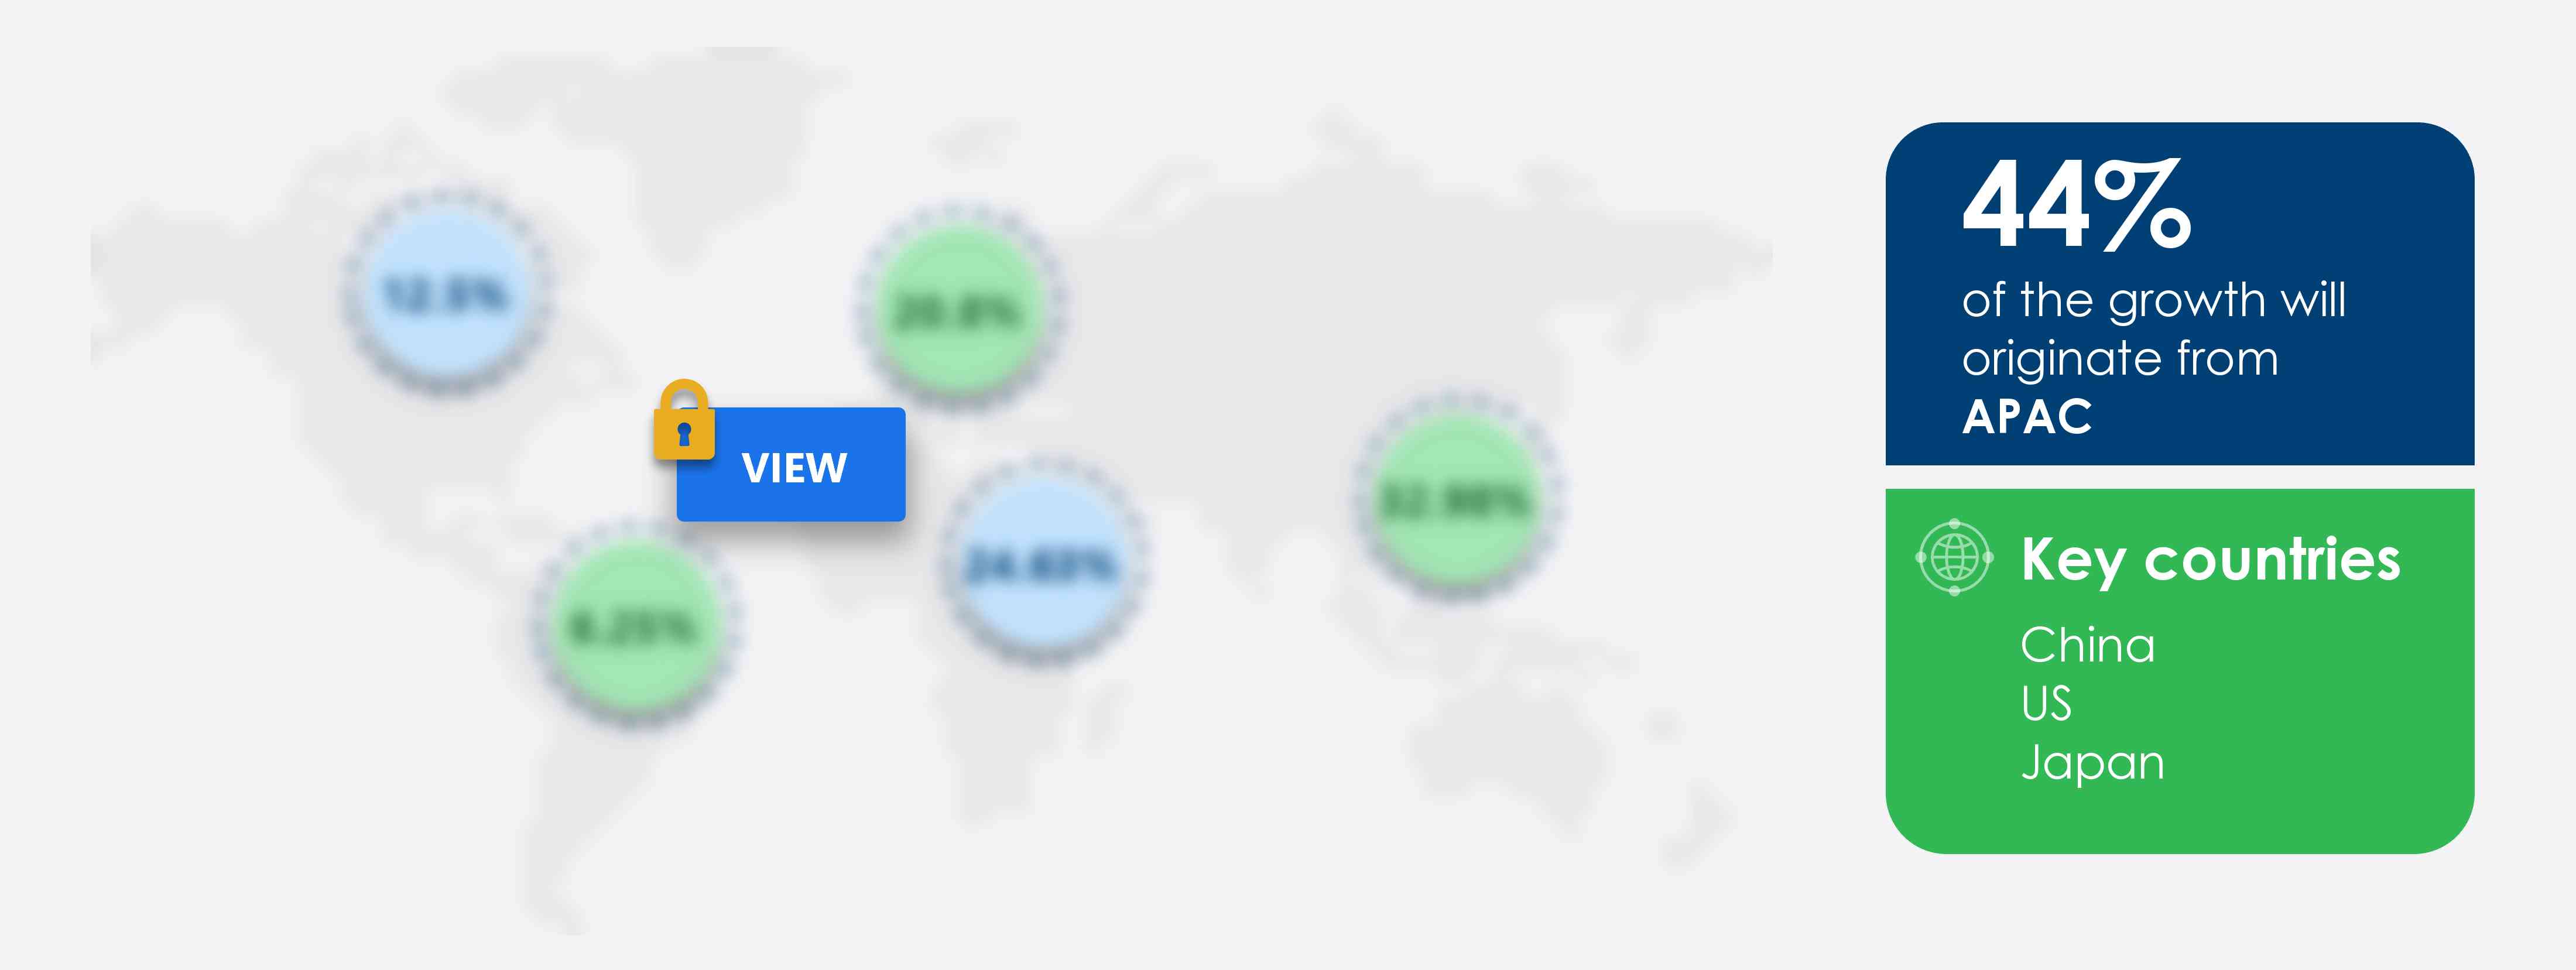
44% of the market’s growth will originate from APAC during the forecast period. China, Japan, and Vietnam are the key markets for solar photovoltaic wafers in APAC. Market growth in this region will be slower than the growth of the market in other regions.
The presence of financial incentive programs, such as FiTs in China and Japan, has resulted in a large installed capacity base of solar PV systems in these countries, thus resulting in a strong need for operations and maintenance (O&M) services. This will facilitate the solar photovoltaic wafer market growth in APAC over the forecast period. This market research report entails detailed information on the competitive intelligence, marketing gaps, and regional opportunities in store for vendors, which will assist in creating efficient business plans.
COVID Impact and Recovery Analysis
In 2020, the outbreak of COVID-19 led to various nations imposing lockdowns to hinder the spread of the disease. With the lockdown restrictions, commercial spaces and offices were closed, which led to lower electricity demand in the region. This hindered the growth of the market. However, as of early 2021, with the number of COVID-19 cases decreasing because of large-scale vaccination drives, there was a removal of lockdown restrictions. With the restrictions being removed, commercial spaces and offices reopened, which led to the increase in demand for electricity, which, in turn, will drive the growth of the regional solar power market and will fuel the need for solar PV wafers during the forecast period.
What are the Revenue-generating End-user Segments in the Solar Photovoltaic Wafer Market?

To gain further insights on the market contribution of various segments Request for a FREE sample
The solar photovoltaic wafer market share growth by the utility segment will be significant during the forecast period. Generally, utility-scale solar power plants have power purchase agreements (PPAs) with utilities to ensure that there is a market for their energy for a fixed period of time. A utility-scale solar power plant has been producing clean and dependable energy over the past few decades. It gives the benefit of fixed electricity prices when the prices of electricity generated from fossil fuels are high during peak demand periods. It can also be stored in energy storage systems for using it when there is no sunlight. These factors drive the adoption of utility-scale solar power, which, in turn, is driving the global solar photovoltaic wafer market.
This report provides an accurate prediction of the contribution of all the segments to the growth of the solar photovoltaic wafer market size and actionable market insights on post COVID-19 impact on each segment.
Parent Market Analysis
Technavio categorizes the global solar photovoltaic wafer market as a part of the global renewable electricity market. Our research report has extensively covered external factors influencing the parent market growth potential in the coming years, which will determine the levels of growth of the solar photovoltaic wafer market during the forecast period.
Solar Photovoltaic Wafer Market Value Chain Analysis
Our report provides extensive information on the value chain analysis for the solar photovoltaic wafer market, which vendors can leverage to gain a competitive advantage during the forecast period. The end-to-end understanding of the value chains is essential in profit margin optimization and evaluation of business strategies. The data available in our value chain analysis segment can help vendors drive costs and enhance customer services during the forecast period.
|
Solar Photovoltaic Wafer Market Scope |
|
|
Report Coverage |
Details |
|
Page number |
120 |
|
Base year |
2021 |
|
Forecast period |
2022-2026 |
|
Growth momentum & CAGR |
Accelerate at a CAGR of 14.80% |
|
Market growth 2022-2026 |
73.71 GW |
|
Market structure |
Fragmented |
|
YoY growth (%) |
13.04 |
|
Regional analysis |
APAC, Europe, North America, South America, and MEA |
|
Performing market contribution |
APAC at 44% |
|
Key consumer countries |
China, US, Japan, Germany, and Vietnam |
|
Competitive landscape |
Leading companies, Competitive strategies, Consumer engagement scope |
|
Key companies profiled |
CETC Solar Energy Holdings Co. Ltd., GCL Poly Energy Holdings Ltd, GlobalWafers Singapore Pte Ltd., JA Solar Technology Co. Ltd., JinkoSolar Holding Co. Ltd., Lanco Infratech Ltd., Longi green energy technology Co. Ltd., Sino-American Silicon Products Inc., SOLARWORLD Africa Pty Ltd., and Targray Technology International Inc. |
|
Market dynamics |
Parent market analysis, Market growth inducers and obstacles, Fast-growing and slow-growing segment analysis, COVID-19 impact and recovery analysis and future consumer dynamics, Market condition analysis for the forecast period |
|
Customization purview |
If our report has not included the data that you are looking for, you can reach out to our analysts and get segments customized. |
What are the Key Data Covered in this Solar Photovoltaic Wafer Market Report?
- CAGR of the market during the forecast period 2022-2026
- Detailed information on factors that will drive solar photovoltaic wafer market growth during the next five years
- Precise estimation of the solar photovoltaic wafer market size and its contribution to the parent market
- Accurate predictions on upcoming trends and changes in consumer behavior
- The growth of the solar photovoltaic wafer industry across APAC, Europe, North America, South America, and MEA
- A thorough analysis of the market’s competitive landscape and detailed information on vendors
- Comprehensive details of factors that will challenge the growth of solar photovoltaic wafer market vendors
We can help! Our analysts can customize this report to meet your requirements. Get in touch
 RIA -
RIA - 
