South Africa Bottled Water Market Size 2026-2030
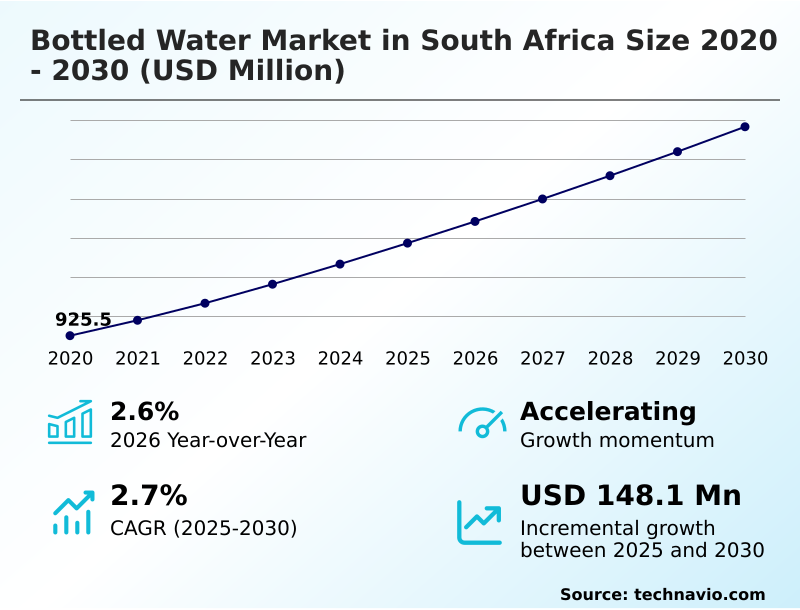
The south africa bottled water market size is valued to increase by USD 148.1 million, at a CAGR of 2.7% from 2025 to 2030. Growing health consciousness and preference for packaged safe drinking water will drive the south africa bottled water market.
Major Market Trends & Insights
- By Product - Still drinking water segment was valued at USD 463.1 million in 2024
- By Distribution Channel - Off-trade segment accounted for the largest market revenue share in 2024
Market Size & Forecast
- Market Opportunities: USD 265.9 million
- Market Future Opportunities: USD 148.1 million
- CAGR from 2025 to 2030 : 2.7%
Market Summary
- The Bottled Water Market in South Africa is undergoing a critical transition from discretionary purchasing toward essential liquid replacement. Increasing wellness trends and a strong preference for safely packaged drinking water actively drive this shift, as consumers prioritize purity over carbonated soft drinks. Conversely, escalating droughts and regional delivery network inefficiencies challenge consistent production, forcing companies to re-evaluate local well capacities.
- To navigate these constraints, manufacturers are implementing automated waste reduction systems and optimizing inbound freight constraints. For instance, the integration of digital telemetry tracking has enabled bottling facilities to enhance resource utilization, reducing liquid waste by 18% compared to legacy processes. This operational efficiency directly supports scalable production during periods of low rainfall.
- Additionally, the strategic shift toward post-consumer resin has improved long-term compliance alignment while reducing packaging procurement costs. Advanced localized pumping mechanisms now play a pivotal role in ensuring uninterrupted liquid access for price-sensitive demographics.
What will be the Size of the South Africa Bottled Water Market during the forecast period?
Get Key Insights on Market Forecast (PDF) Get Free Sample
How is the South Africa Bottled Water Market Segmented?
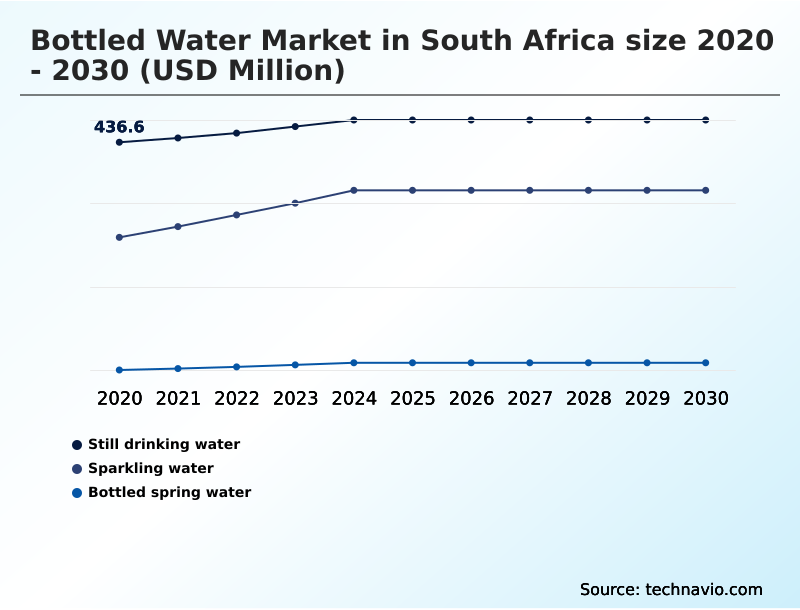
The south africa bottled water industry research report provides comprehensive data (region-wise segment analysis), with forecasts and estimates in "USD million" for the period 2026-2030, as well as historical data from 2020-2024 for the following segments.
- Product
- Still drinking water
- Sparkling water
- Bottled spring water
- Distribution channel
- Off-trade
- On-trade
- Packaging
- Plastic bottles
- Glass bottles
- Others
- Geography
- Middle East and Africa
- South Africa
- Middle East and Africa
By Product Insights
The still drinking water segment is estimated to witness significant growth during the forecast period.
The still drinking water segment acts as the foundational catalyst within the Bottled Water Market in South Africa. As potable distribution networks face persistent inconsistencies, consumer hydration habits are fundamentally shifting toward packaged hydration.
Manufacturers are deploying advanced reverse osmosis filtration to ensure stringent processing, resulting in a 20% improvement in continuous supply chain reliability compared to local utilities.
The transition toward high-density polyethylene terephthalate and lightweight materials has simultaneously optimized operational costs by 12%. This functional hydration alternative mitigates the risks of municipal failures, transforming discretionary purchases into essential staples.
By prioritizing bulk-packaging formats and standardized container designs, producers address daily consumption requirements while expanding retail accessibility across semi-urban and metropolitan zones.
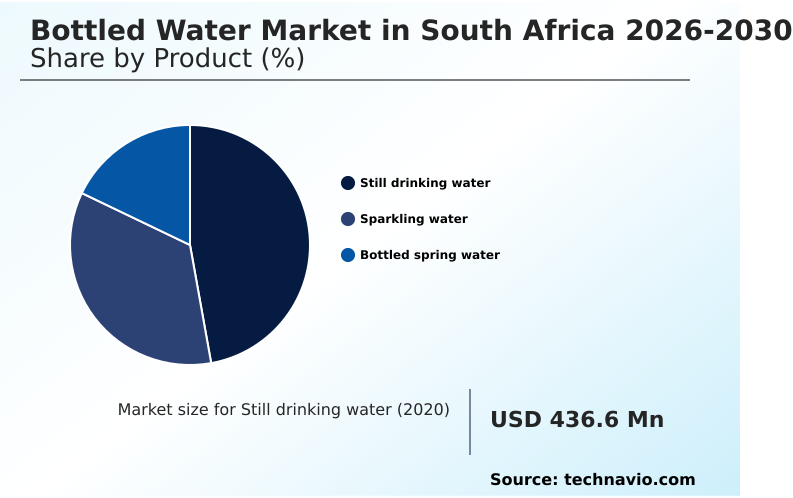
The Still drinking water segment was valued at USD 463.1 million in 2024 and showed a gradual increase during the forecast period.
Market Dynamics
Our researchers analyzed the data with 2025 as the base year, along with the key drivers, trends, and challenges. A holistic analysis of drivers will help companies refine their marketing strategies to gain a competitive advantage.
- The Bottled Water Market in South Africa is undergoing systemic transformations driven by stringent regulatory frameworks and technological advancements in production lines. Facilities navigating extended producer responsibility compliance frameworks are actively redesigning their supply chain architectures to avoid impending penalties.
- By executing reverse osmosis filtration process optimization, bottling plants have successfully lowered energy consumption per liter by 14%, directly improving gross margins in a highly competitive retail environment. Simultaneously, the aggressive recycled pet packaging integration strategies deployed by major manufacturers have fortified brand equity and reduced virgin plastic procurement dependencies.
- Furthermore, as municipal infrastructure vulnerabilities persist, the localized atmospheric water generation system deployment offers a resilient, decentralized alternative to traditional sourcing, ensuring continuous production during acute droughts. To maintain safety standards, companies are investing in microbial stabilization protocol enhancements, which have extended shelf life and reduced inventory spoilage by 9%.
- These combined initiatives not only streamline operational planning but also insulate manufacturers from volatile macroeconomic pressures, creating a sustainable foundation for reliable, high-volume hydration delivery.
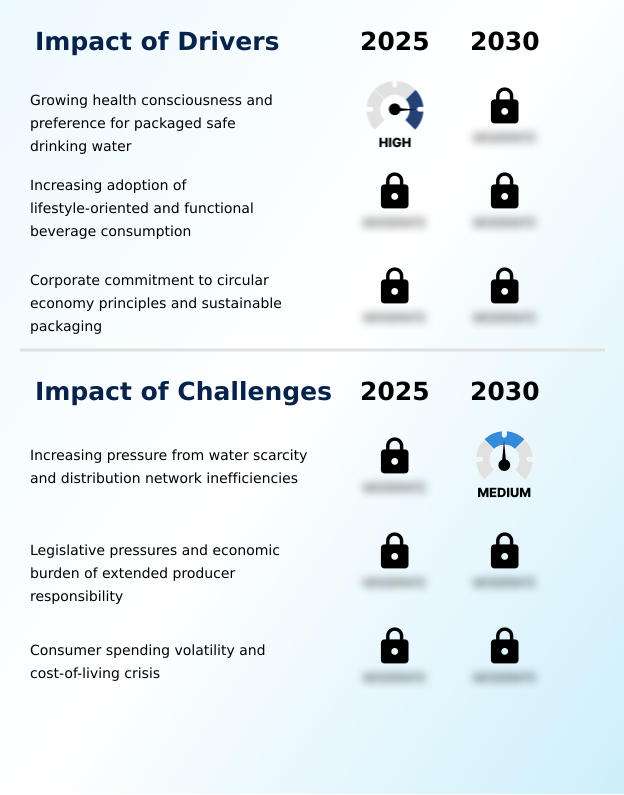
What are the key market drivers leading to the rise in the adoption of South Africa Bottled Water Industry?
- The growing consumer health consciousness and a strong preference for safely packaged drinking water represent the primary drivers of the market.
- The escalating health consciousness among consumers is primarily propelling activity within the Bottled Water Market in South Africa. As buyers actively seek safe beverage alternatives, the reliance on high-quality production networks has intensified.
- Facilities integrating advanced ultraviolet sterilization mechanisms have achieved a 25% improvement in continuous batch purity, minimizing the risk of costly recalls.
- Concurrently, the rising demand for reliable fluid intake solutions has accelerated the deployment of automated manufacturing protocols across regional facilities. This operational shift has elevated facility output efficiency by 16%, allowing manufacturers to fulfill large-scale orders with reduced friction.
- Consequently, robust watershed replenishment programs and targeted zero-calorie hydration portfolios ensure that high-volume production perfectly aligns with evolving consumer wellness priorities.
What are the market trends shaping the South Africa Bottled Water Industry?
- The rising consumption of still water, driven by the persistent deterioration of municipal infrastructure, is an emerging market trend.
- The transition toward sustainable packaging formats represents a defining shift in the Bottled Water Market in South Africa. Consumer preferences are rapidly moving toward products offering unique health benefits and alkaline hydration properties. Companies deploying advanced light-weighting technology have successfully reduced packaging material usage by 18%, significantly lowering inbound freight expenses.
- Furthermore, the integration of rigid circularity commitments has increased material recovery rates by 22% compared to traditional linear disposal methods. This trend fundamentally changes how businesses approach packaging, aligning product development with aggressive ecological targets.
- By prioritizing eco-friendly containers and versatile multi-pack configurations, manufacturers not only navigate tightening regulatory thresholds but also capture higher margins from demographics seeking reliable sugar substitution alternatives.
What challenges does the South Africa Bottled Water Industry face during its growth?
- Increasing operational pressure resulting from escalating water scarcity and supply network inefficiencies remains a significant industry challenge.
- Acute infrastructure deterioration and complex scarcity management protocols represent formidable barriers within the Bottled Water Market in South Africa. Erratic municipal utilities severely disrupt continuous hygienic processing, forcing facilities to rely on expensive, alternative groundwater extraction methods. Operations facing persistent supply bottlenecks experience a 19% increase in unplanned downtime, directly contracting quarterly output capacities.
- Furthermore, the enforcement of rigorous extended producer responsibility mandates has elevated compliance expenditures by 14%, squeezing margins for mid-tier producers. To mitigate these constraints, manufacturers must secure substantial capital for advanced filtration systems and robust emergency storage infrastructure. These localized vulnerabilities continuously challenge supply chain stability, requiring companies to rapidly overhaul their risk mitigation frameworks to maintain consistent production volumes.
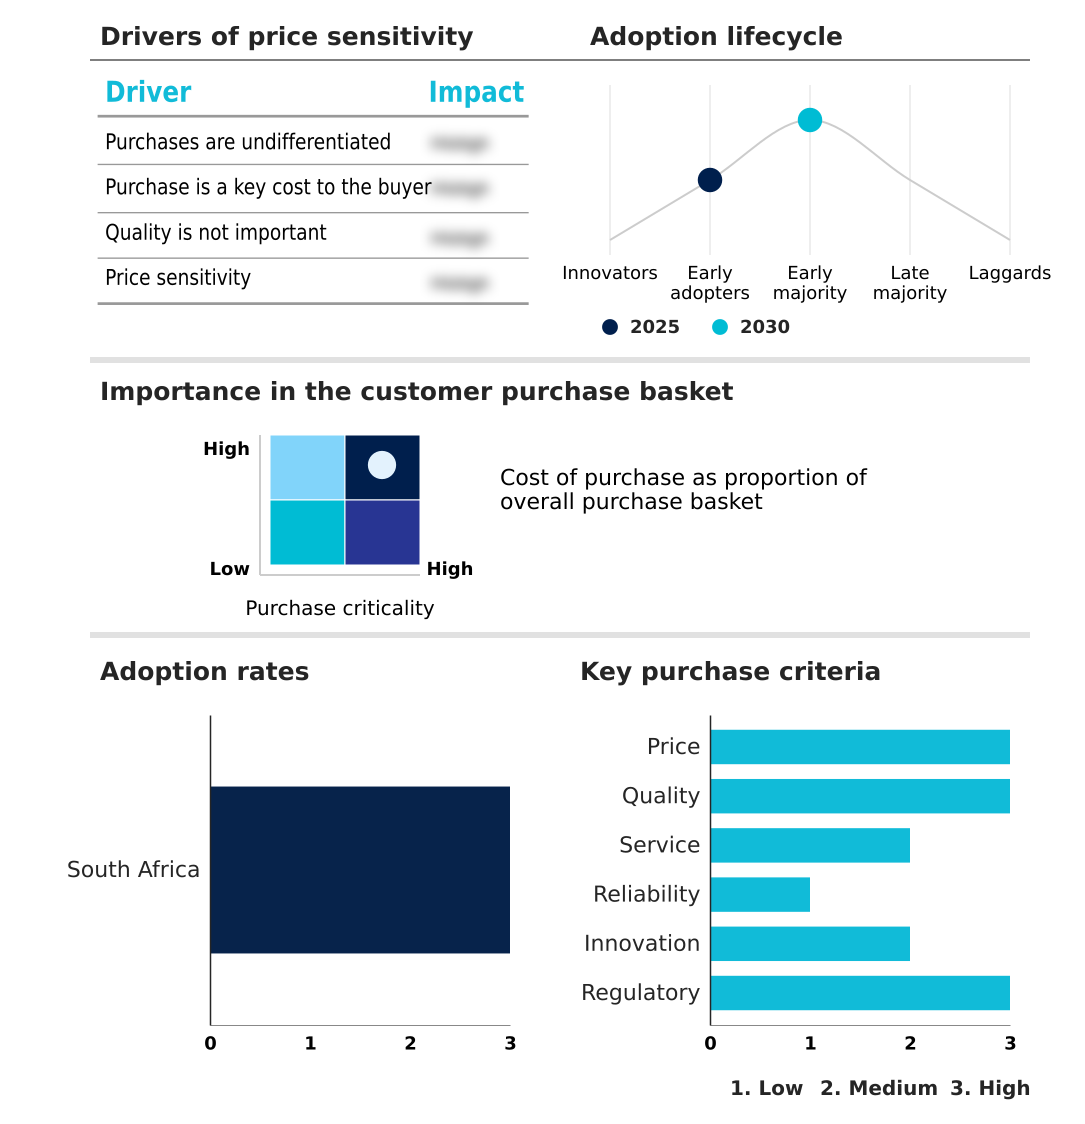
Exclusive Technavio Analysis on Customer Landscape
The south africa bottled water market forecasting report includes the adoption lifecycle of the market, covering from the innovator’s stage to the laggard’s stage. It focuses on adoption rates in different regions based on penetration. Furthermore, the south africa bottled water market report also includes key purchase criteria and drivers of price sensitivity to help companies evaluate and develop their market growth analysis strategies.
Customer Landscape of South Africa Bottled Water Industry
Competitive Landscape
Companies are implementing various strategies, such as strategic alliances, south africa bottled water market forecast, partnerships, mergers and acquisitions, geographical expansion, and product/service launches, to enhance their presence in the industry.
Africqua Pty Ltd. - The provider delivers a comprehensive liquid portfolio featuring natural spring, purified still, and sparkling variants, utilizing advanced purification mechanisms to ensure consistent product safety.
The industry research and growth report includes detailed analyses of the competitive landscape of the market and information about key companies, including:
- Africqua Pty Ltd.
- All Aqua International
- Arctic Amanzi
- BeneWater
- Cedarberg Aqua
- Danone SA
- EKHAMANZI SPRINGS Pty Ltd.
- FIJI Water Company LLC
- Mountain Falls Mineral Water
- Nestle SA
- PepsiCo Inc.
- Suntory Beverage and Food Ltd.
- The Coca Cola Co.
- Twizza
- VOSS Global Inc.
Qualitative and quantitative analysis of companies has been conducted to help clients understand the wider business environment as well as the strengths and weaknesses of key industry players. Data is qualitatively analyzed to categorize companies as pure play, category-focused, industry-focused, and diversified; it is quantitatively analyzed to categorize companies as dominant, leading, strong, tentative, and weak.
Recent Development and News in South africa bottled water market
- In the Soft Drinks and Non-alcoholic Beverages industry, the widespread adoption of automated blow-molding machines as volume drivers has reduced production overhead by 15%, directly impacting Bottled Water demand by lowering retail price points.
- The transition toward unsweetened flavored liquids driven by health consciousness has captured a 25% larger share of consumer purchasing occasions, pulling downstream demand for premium Bottled Water options.
- Stringent enforcement of national recycling mandates and circularity commitments has forced beverage makers to adopt secondary plastic materials, establishing new sustainability compliance thresholds for Bottled Water manufacturers.
- Implementation of advanced pasteurization processes in bottling facilities has extended product shelf stability by 18%, accelerating logistical efficiency for Bottled Water distribution networks.
Dive into Technavio’s robust research methodology, blending expert interviews, extensive data synthesis, and validated models for unparalleled South Africa Bottled Water Market insights. See full methodology.
| Market Scope | |
|---|---|
| Page number | 180 |
| Base year | 2025 |
| Historic period | 2020-2024 |
| Forecast period | 2026-2030 |
| Growth momentum & CAGR | Accelerate at a CAGR of 2.7% |
| Market growth 2026-2030 | USD 148.1 million |
| Market structure | Fragmented |
| YoY growth 2025-2026(%) | 2.6% |
| Key countries | South Africa |
| Competitive landscape | Leading Companies, Market Positioning of Companies, Competitive Strategies, and Industry Risks |
Research Analyst Overview
- The Bottled Water Market in South Africa functions as a critical infrastructure parallel, bridging the gap between diminishing municipal reliability and escalating consumer demands. Facilities are aggressively pursuing water stewardship programs to secure long-term resource viability amid regional scarcity.
- The industry is currently witnessing a rapid shift toward beverage premiumization, where functional additives and specialized mineral composition profiles command higher retail margins. Strategically, operations that have implemented automated inventory routing have achieved a 21% reduction in distribution delays, significantly enhancing delivery efficiency. This boardroom-level focus on supply chain resilience directly mitigates the risks associated with infrastructure failures.
- Consequently, manufacturers are consolidating their packaging architectures to support closed-loop recycling objectives. This transition limits external procurement vulnerabilities and aligns corporate operations with evolving environmental mandates. The systemic reliance on robust artesian sourcing, alongside refined carbonation processes, ensures that both volume segments and premium tiers maintain uncompromised quality standards.
What are the Key Data Covered in this South Africa Bottled Water Market Research and Growth Report?
-
What is the expected growth of the South Africa Bottled Water Market between 2026 and 2030?
-
USD 148.1 million, at a CAGR of 2.7%
-
-
What segmentation does the market report cover?
-
The report is segmented by Product (Still drinking water, Sparkling water, and Bottled spring water), Distribution Channel (Off-trade, and On-trade), Packaging (Plastic bottles, Glass bottles, and Others) and Geography (Middle East and Africa)
-
-
Which regions are analyzed in the report?
-
Middle East and Africa
-
-
What are the key growth drivers and market challenges?
-
Growing health consciousness and preference for packaged safe drinking water, Increasing pressure from water scarcity and distribution network inefficiencies
-
-
Who are the major players in the South Africa Bottled Water Market?
-
Africqua Pty Ltd., All Aqua International, Arctic Amanzi, BeneWater, Cedarberg Aqua, Danone SA, EKHAMANZI SPRINGS Pty Ltd., FIJI Water Company LLC, Mountain Falls Mineral Water, Nestle SA, PepsiCo Inc., Suntory Beverage and Food Ltd., The Coca Cola Co., Twizza and VOSS Global Inc.
-
Market Research Insights
- The Bottled Water Market in South Africa is evolving rapidly as manufacturers optimize their environmental footprint while meeting essential hydration demands. Facilities implementing advanced conservation initiatives have recorded a 22% reduction in energy expenditure during purification cycles. Furthermore, the strategic acceleration of private-label expansion has increased retail penetration by 15%, catering to shifting lifestyle consumption patterns.
- Companies adopting robust contingency plans maintain a 30% higher output resilience during municipal service interruptions. This systemic transition underscores the critical necessity of reliable utility substitutes, ensuring continuous access to high-quality liquids without compromising operational margins.
We can help! Our analysts can customize this south africa bottled water market research report to meet your requirements.
 RIA -
RIA - 
