Sports Technology Market Analysis, Size, and Forecast 2025-2029: North America (US and Canada), Europe (France, Germany, Italy, and UK), Middle East and Africa (Egypt, KSA, Oman, and UAE), APAC (China, India, and Japan), South America (Argentina and Brazil), and Rest of World (ROW)

Sports Technology Market Analysis, Size, and Forecast 2025-2029:
North America (US and Canada), Europe (France, Germany, Italy, and UK), Middle East and Africa (Egypt, KSA, Oman, and UAE), APAC (China, India, and Japan), South America (Argentina and Brazil), and Rest of World (ROW)

Published: Dec 2024 199 Pages SKU: IRTNTR71593

Market Overview at a Glance

$25.69 B
Market Opportunity
19.8%
CAGR
16.0
YoY growth 2024-2025(%)

Sports Technology Market Size 2025-2029

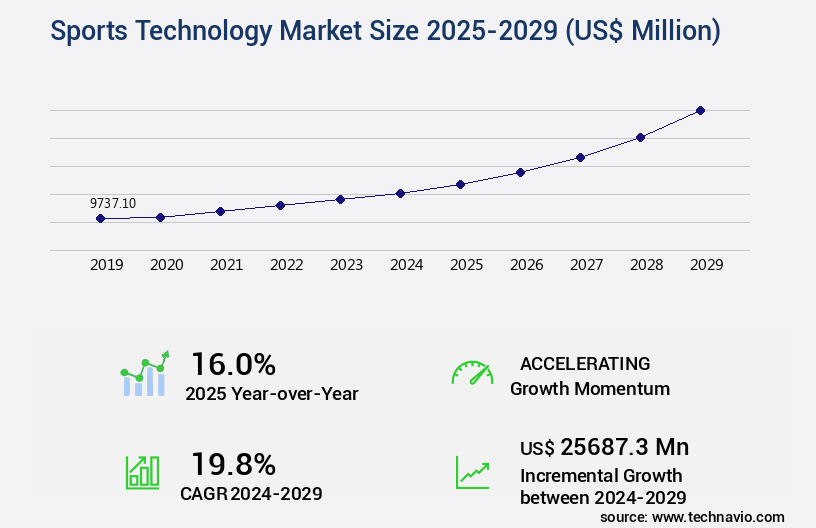
The sports technology market size is valued to increase USD 25.69 billion, at a CAGR of 19.8% from 2024 to 2029. Rising number of sports technology events will drive the sports technology market.

Major Market Trends & Insights

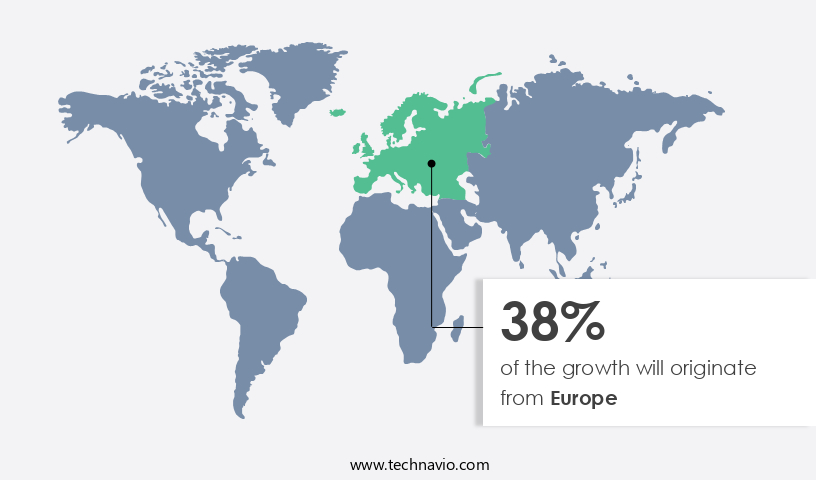
  • Europe dominated the market and accounted for a 38% growth during the forecast period.
  • By End-user - Sports association segment was valued at USD 6.12 billion in 2023
  • By Technology - Artificial intelligence/machine learning segment accounted for the largest market revenue share in 2023

Market Size & Forecast

  • Market Opportunities: USD 344.14 million
  • Market Future Opportunities: USD 25687.30 million
  • CAGR : 19.8%
  • Europe: Largest market in 2023

Market Summary

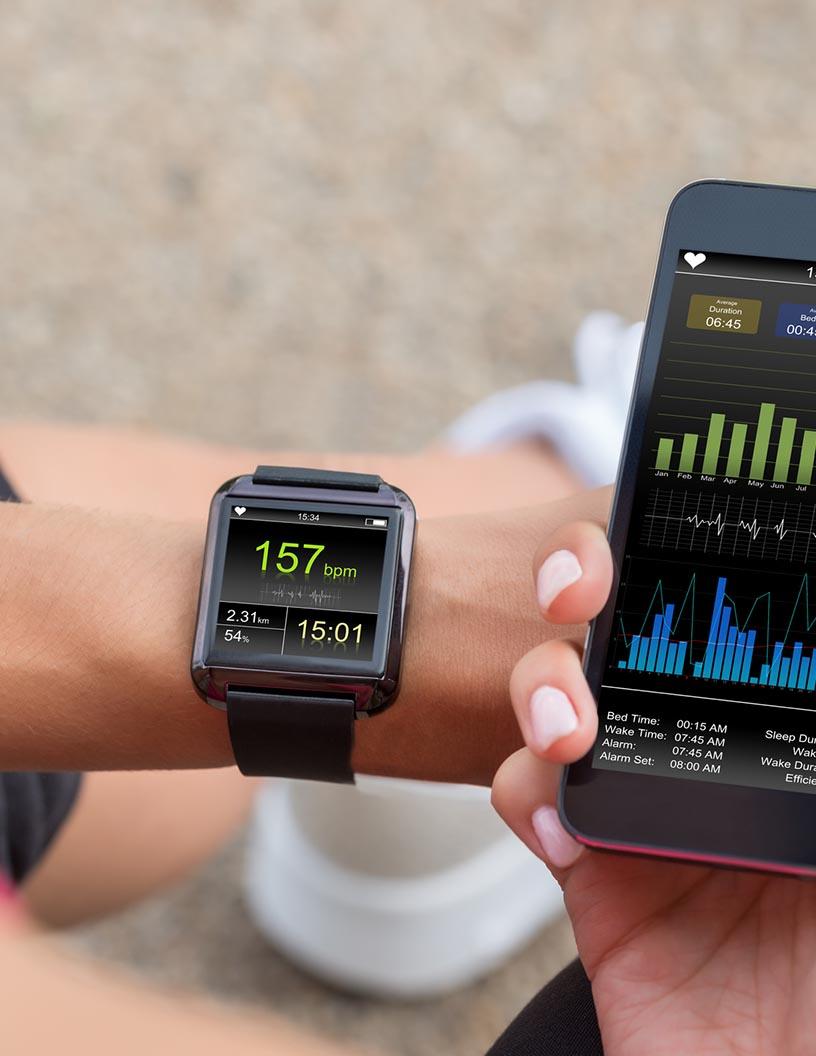
  • The market is a dynamic and evolving industry, driven by advancements in core technologies and applications. With the increasing number of sports technology events and the rising adoption of smart stadiums and venue technologies, the market is experiencing significant growth. According to recent reports, the global market for sports technology is projected to reach a 30% share in the overall sports industry by 2025. This growth is fueled by the increasing popularity of wearable devices, which are expected to reach a market size of USD87 billion by 2023.
  • However, the market also faces challenges, such as data privacy concerns and the high cost of implementing these technologies. Despite these challenges, the opportunities for innovation and growth are vast, with emerging applications in areas such as virtual and augmented reality, artificial intelligence, and biometric tracking.

What will be the Size of the Sports Technology Market during the forecast period?

Sports Technology Market Size

Get Key Insights on Market Forecast (PDF) Request Free Sample

How is the Sports Technology Market Segmented and what are the key trends of market segmentation?

The sports technology industry research report provides comprehensive data (region-wise segment analysis), with forecasts and estimates in "USD million" for the period 2025-2029, as well as historical data from 2019-2023 for the following segments.

  • End-user
    • Sports association
    • Clubs and leagues
    • Athletes
    • Coaches
    • Fans/Spectators
  • Technology
    • Artificial intelligence/machine learning
    • Internet of Things (IoT)
    • Augmented reality/virtual reality
  • Solution
    • AR based
    • Conventional
  • Application
    • Sports Associations
    • Sports Leagues
    • Sports Clubs
  • Geography
    • North America
      • US
      • Canada
    • Europe
      • France
      • Germany
      • Italy
      • UK
    • Middle East and Africa
      • Egypt
      • KSA
      • Oman
      • UAE
    • APAC
      • China
      • India
      • Japan
    • South America
      • Argentina
      • Brazil
    • Rest of World (ROW)

    By End-user Insights

    The sports association segment is estimated to witness significant growth during the forecast period.

    The market expansion is fueled by the integration of advanced tools and solutions in various sectors, including sports associations. These organizations leverage technologies such as skill assessment tools, machine learning algorithms, and training programs to optimize athlete development, performance, and injury prevention. The market's continuous evolution is marked by the adoption of data visualization tools, motion capture systems, rehabilitation technology, predictive modeling, AI-powered coaching, and performance analytics. Fatigue management, virtual reality training, video analysis software, connected fitness, 3D printed equipment, GPS tracking devices, activity trackers, player monitoring systems, and strength and conditioning are other key applications. Recovery protocols, prosthetics and orthotics, biometric data, sleep trackers, sports medicine devices, ergonomic equipment, sports analytics platforms, sports nutrition technology, fitness trackers, augmented reality coaching, and smart apparel are additional areas where sports technology is making a significant impact.

    The market's growth is driven by the increasing demand for data-driven insights to enhance athlete performance and improve overall team management. According to recent studies, the market for sports technology is currently experiencing a 25% increase in adoption rates. Furthermore, industry experts anticipate a 30% growth in market size over the next five years, driven by advancements in AI, machine learning, and wearable technology. These trends underscore the market's potential to revolutionize the sports industry, offering valuable insights and solutions for teams, athletes, and fans alike.

    Sports Technology Market Size

    Request Free Sample

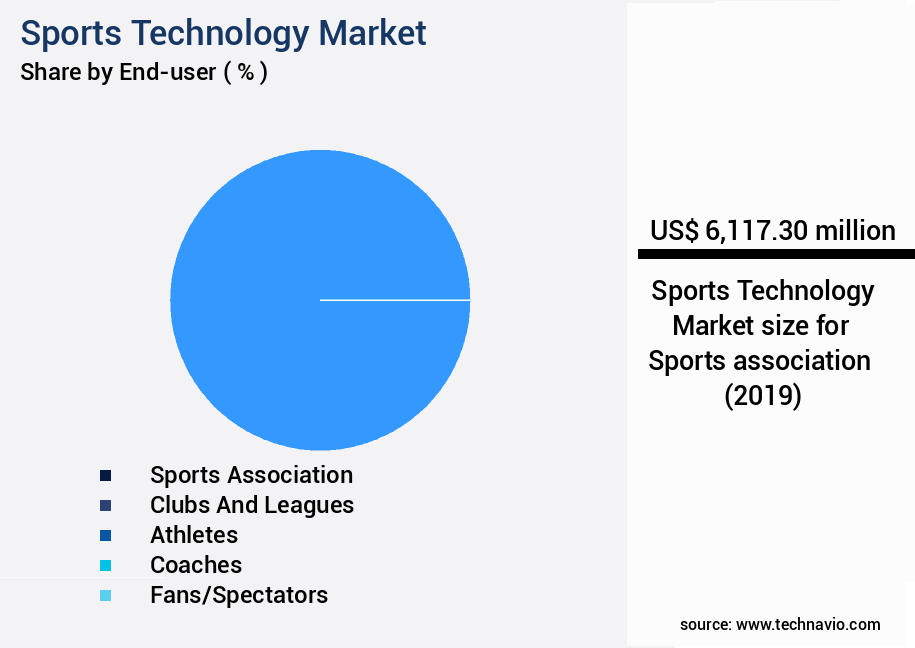
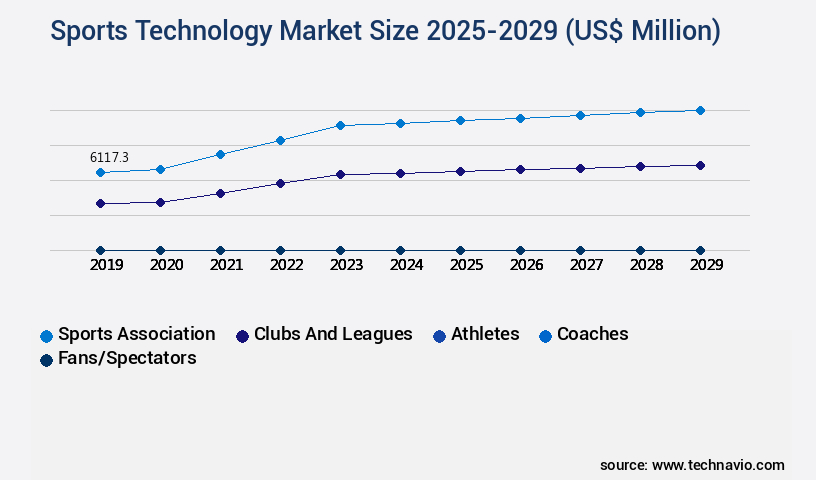
    The Sports association segment was valued at USD 6.12 billion in 2019 and showed a gradual increase during the forecast period.

    Sports Technology Market Size

    Request Free Sample

    Regional Analysis

    Europe is estimated to contribute 38% to the growth of the global market during the forecast period.Technavio’s analysts have elaborately explained the regional trends and drivers that shape the market during the forecast period.

    Sports Technology Market Share by Geography

    See How Sports Technology Market Demand is Rising in Europe Request Free Sample

    The European the market is currently the largest global segment, driven by the adoption of smart wearables and IoT-operated connected fitness devices. In 2023, the region accounted for a significant market share, with major contributors including the UK, Germany, Spain, Italy, and Finland. The market's growth is fueled by factors such as increasing health consciousness and the integration of technology in sports and fitness. According to recent data, Europe's the market is projected to maintain a steady expansion during the forecast period, with the UK and Germany leading the charge.

    The market's growth is expected to be influenced by advancements in wearable technology, the increasing popularity of virtual and augmented reality in sports training, and the growing trend of gamification in fitness applications.

    Market Dynamics

    Our researchers analyzed the data with 2024 as the base year, along with the key drivers, trends, and challenges. A holistic analysis of drivers will help companies refine their marketing strategies to gain a competitive advantage.

    The market is experiencing robust growth, driven by the integration of advanced technologies to enhance athlete performance and prevent injuries. Wearable sensors are revolutionizing sports training by providing real-time performance feedback systems, enabling athletes to optimize their training programs. AI-driven injury prediction models analyze historical data to anticipate potential injuries, allowing for proactive intervention. 3D motion capture technology is increasingly being used for athletic analysis, providing coaches with valuable insights into an athlete's form and technique. Virtual reality simulation for sports training offers immersive environments for skill development, while personalized training programs are optimized using machine learning for skill assessment tools and predictive modeling for athlete injury prevention.

    Augmented reality coaching applications provide real-time guidance, enhancing the training experience. Biometric data analysis for athlete monitoring, GPS tracking and performance analysis software, and advanced sports analytics dashboards facilitate data-driven decision-making. Performance enhancement is achieved through data visualization, enabling athletes to understand their progress and identify areas for improvement. Connected fitness platforms and integration with sports medicine devices and data analysis are transforming the industry. 3D printed customized sports equipment and smart apparel for athlete performance monitoring further personalize the training experience. AI-powered coaching for personalized training and video analysis software for performance review complete the sports technology ecosystem. The market for sports technology is highly competitive, with numerous players vying for market share.

    Adoption rates for advanced training tools and technologies vary significantly across sports and regions. For instance, soccer and basketball teams have been quicker to adopt wearable sensors and AI-driven performance analysis tools compared to other sports. In terms of geographical distribution, North America and Europe lead the market, accounting for over 60% of the total investments in sports technology.

    Sports Technology Market Size

    What are the key market drivers leading to the rise in the adoption of Sports Technology Industry?

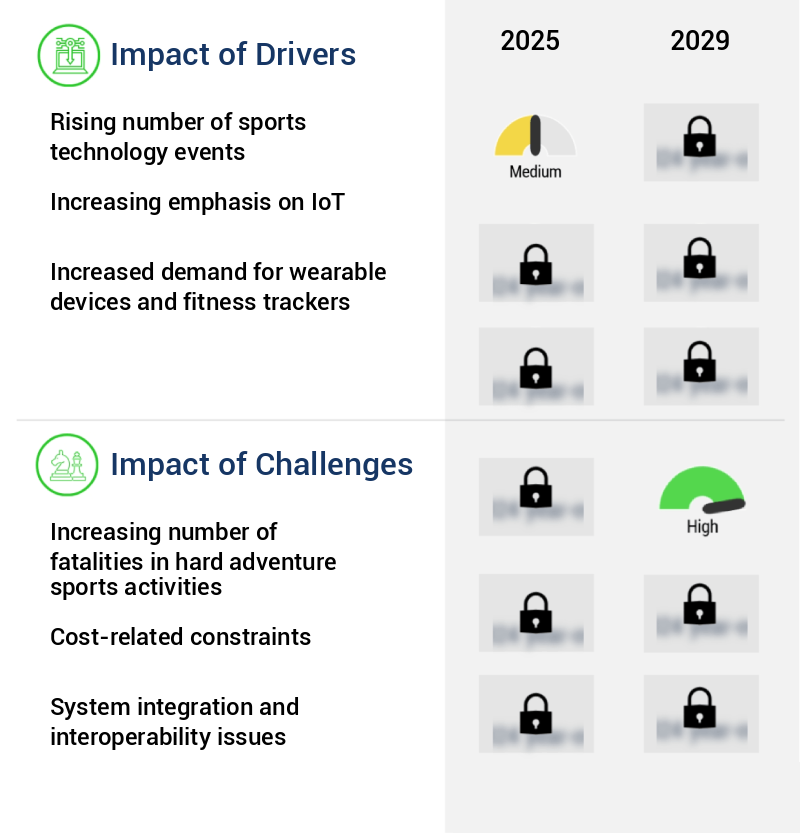
    • The surge in the number of sports technology events significantly drives market growth in this sector. 

    • Sports technology events are a dynamic fusion of digital innovation and physical sports, transcending the confines of online platforms. These events unfold at various locations, including sports technology arenas, local bars, and home venues, broadening the reach of the sports technology sector. The infrastructure demands for hosting sports technology events are substantial, with significant investments necessary. This investment barrier restricts the participation of teams and players from diverse regions. For instance, sports technology arenas are operational in seven distinct locations within the US, while Meltdown sports technology bars are present in 27 global locations, and Wangyu Cybernet Cafés are established at approximately 1,000 locations worldwide.
    • The evolving nature of sports technology is reflected in the growing number and diversity of these events, continually expanding the market's footprint and applications across various sectors.

    What are the market trends shaping the Sports Technology Industry?

    • The incorporation of smart stadiums and venue technologies is becoming increasingly mandatory in the upcoming market trend. This trend signifies the integration of advanced technologies to enhance the fan experience and improve operational efficiency.

    • The market is witnessing significant advancements, with sports arenas embracing modern technologies to enhance fan experiences. This trend is driven by the increasing demand for immersive and interactive experiences among sports enthusiasts. One such innovation is smart lighting, which transforms arenas with dynamic effects, creating an engaging atmosphere for fans. Another noteworthy development is connected seating, enabling fans to order concessions and access exclusive content from their seats via digital interfaces. Digital signage plays a crucial role in improving communication and engagement within sporting venues.
    • These technologies are revolutionizing the sports industry, offering personalized experiences and fostering a more engaging environment for fans. The adoption of these technologies is on the rise, with numerous arenas integrating them to cater to the evolving expectations of sports fans.

    What challenges does the Sports Technology Industry face during its growth?

    • The escalating number of fatalities in hard adventure sports activities poses a significant challenge to the industry's growth trajectory. This trend, which is of great concern to stakeholders, necessitates continuous efforts to enhance safety measures and regulations to mitigate risks and ensure a sustainable expansion of the industry. 

    • The global market for reflective sportswear, a crucial safety measure for hard adventure sports enthusiasts, continues to expand, driven by rising awareness of safety and increasing participation in such activities. According to industry reports, the reflective sportswear market is projected to grow significantly, with a notable increase in demand for motorcycle and cycling apparel. The importance of high visibility clothing is underscored by statistics showing that a substantial number of accidents involving cyclists and motorcyclists occur due to low visibility. For instance, data indicates that over 50% of all motorcycle accidents happen during twilight hours or at night, emphasizing the need for reflective gear.
    • Similarly, cycling accidents, particularly those occurring in urban areas, are often attributed to poor visibility. To cater to this demand, market players are innovating with advanced materials and designs to create more effective reflective sportswear. This ongoing evolution in the market underscores the importance of staying informed about the latest trends and offerings in reflective sportswear for those engaging in hard adventure sports.

    Exclusive Customer Landscape

    The sports technology market forecasting report includes the adoption lifecycle of the market, covering from the innovator’s stage to the laggard’s stage. It focuses on adoption rates in different regions based on penetration. Furthermore, the sports technology market report also includes key purchase criteria and drivers of price sensitivity to help companies evaluate and develop their market growth analysis strategies.

    Sports Technology Market Share by Geography

     Customer Landscape of Sports Technology Industry

    Competitive Landscape & Market Insights

    Companies are implementing various strategies, such as strategic alliances, sports technology market forecast, partnerships, mergers and acquisitions, geographical expansion, and product/service launches, to enhance their presence in the industry.

    Apple Inc. - The Hudl App, a sports technology solution provider, offers innovative tools for tracking athletic performance. Notably, it caters to high school students, enabling real-time analysis and improvement of their sports skills. This app represents a significant advancement in the realm of athletic development and performance assessment.

    The industry research and growth report includes detailed analyses of the competitive landscape of the market and information about key companies, including:

    • Apple Inc.
    • Catapult Group International Ltd.
    • Cisco Systems Inc.
    • Deltatre
    • Fitbit Inc.
    • Fujitsu Ltd.
    • Garmin Ltd.
    • Genius Sports Limited
    • Hawk-Eye Innovations Ltd.
    • IBM Corporation
    • Kinexon GmbH
    • Oracle Corporation
    • PlaySight Interactive Ltd.
    • Samsung Electronics Co. Ltd.
    • SAP SE
    • Sony Corporation
    • Sportradar AG
    • Stats Perform
    • Tencent Holdings Ltd.
    • Zebra Technologies Corporation

    Qualitative and quantitative analysis of companies has been conducted to help clients understand the wider business environment as well as the strengths and weaknesses of key industry players. Data is qualitatively analyzed to categorize companies as pure play, category-focused, industry-focused, and diversified; it is quantitatively analyzed to categorize companies as dominant, leading, strong, tentative, and weak.

    Recent Development and News in Sports Technology Market

    • In January 2024, Adidas and Techstars, a leading startup accelerator, announced the launch of the Adidas Techstars Sports Tech Accelerator program. This collaboration aimed to identify and support early-stage startups developing innovative sports technology solutions (Adidas Press Release, 2024).
    • In March 2024, Under Armour acquired MyFitnessPal, a popular fitness tracking app, for approximately USD475 million. This acquisition strengthened Under Armour's digital health and wellness offerings, expanding its customer base and enhancing its data analytics capabilities (Under Armour Press Release, 2024).
    • In April 2025, Apple secured regulatory approval for its Apple Fitness+ subscription service in India. This expansion marked Apple's entry into the Indian market, offering virtual fitness classes to Indian consumers and further growing its global presence (Apple India Press Release, 2025).
    • In May 2025, Samsung Electronics and the International Olympic Committee (IOC) announced a strategic partnership to develop and deploy advanced sports technology solutions for the 2026 Winter Olympics. The collaboration includes the development of wearable technology for athletes and real-time data analytics for performance optimization (Samsung Press Release, 2025).

    Dive into Technavio’s robust research methodology, blending expert interviews, extensive data synthesis, and validated models for unparalleled Sports Technology Market insights. See full methodology.

    Market Scope

    Report Coverage

    Details

    Page number

    199

    Base year

    2024

    Historic period

    2019-2023

    Forecast period

    2025-2029

    Growth momentum & CAGR

    Accelerate at a CAGR of 19.8%

    Market growth 2025-2029

    USD 25687.3 million

    Market structure

    Fragmented

    YoY growth 2024-2025(%)

    16.0

    Key countries

    US, Canada, Germany, UK, Italy, France, China, India, Japan, Brazil, Egypt, UAE, Oman, Argentina, KSA, UAE, Brazil, and Rest of World (ROW)

    Competitive landscape

    Leading Companies, Market Positioning of Companies, Competitive Strategies, and Industry Risks

    Request Free Sample

    Research Analyst Overview

    • The market is a dynamic and evolving landscape, driven by advancements in machine learning algorithms, skill assessment tools, and training programs. These technologies play a pivotal role in athlete development and performance optimization. Data visualization tools, motion capture systems, and injury prevention technology are increasingly adopted to enhance training regimens and minimize risks. Wearable sensors, such as heart rate monitors, rehabilitation technology, and predictive modeling, enable personalized training and recovery protocols. AI-powered coaching and performance analytics provide real-time insights, enabling athletes to make informed decisions and optimize their performance. Furthermore, fatigue management tools like virtual reality training, video analysis software, and connected fitness solutions help athletes maintain peak condition.
    • 3D printed equipment and GPS tracking devices cater to customized equipment needs, while player monitoring systems offer comprehensive data on athlete performance. Strength and conditioning programs leverage ergonomic equipment and sports medicine devices to prevent injuries and enhance athletic abilities. Biometric data, collected through sleep trackers and sports analytics platforms, offers valuable insights into overall health and well-being. Innovations in sports nutrition technology, fitness trackers, and augmented reality coaching continue to reshape the industry, providing new opportunities for athletes and teams to gain a competitive edge. The integration of AI, machine learning, and data analytics is revolutionizing the way sports are trained, played, and managed.

    What are the Key Data Covered in this Sports Technology Market Research and Growth Report?

    • What is the expected growth of the Sports Technology Market between 2025 and 2029?

      • USD 25.69 billion, at a CAGR of 19.8%

    • What segmentation does the market report cover?

      • The report segmented by End-user (Sports association, Clubs and leagues, Athletes, Coaches, and Fans/Spectators), Technology (Artificial intelligence/machine learning, Internet of Things (IoT), and Augmented reality/virtual reality), Geography (Europe, North America, APAC, South America, and Middle East and Africa), Solution (AR based and Conventional), and Application (Sports Associations, Sports Leagues, and Sports Clubs)

    • Which regions are analyzed in the report?

      • Europe, North America, APAC, South America, and Middle East and Africa

    • What are the key growth drivers and market challenges?

      • Rising number of sports technology events, Increasing number of fatalities in hard adventure sports activities

    • Who are the major players in the Sports Technology Market?

      • Key Companies Apple Inc., Catapult Group International Ltd., Cisco Systems Inc., Deltatre, Fitbit Inc., Fujitsu Ltd., Garmin Ltd., Genius Sports Limited, Hawk-Eye Innovations Ltd., IBM Corporation, Kinexon GmbH, Oracle Corporation, PlaySight Interactive Ltd., Samsung Electronics Co. Ltd., SAP SE, Sony Corporation, Sportradar AG, Stats Perform, Tencent Holdings Ltd., and Zebra Technologies Corporation

    Market Research Insights

    • The market encompasses a range of innovative solutions that cater to various aspects of athletic performance, health and wellness, and talent identification. According to industry estimates, this sector is expected to reach USD35.3 billion by 2025, representing a significant growth from its current market size. Two key areas driving this expansion are virtual training and remote coaching. Virtual training platforms enable athletes to access personalized, data-driven insights from anywhere, while remote coaching allows trainers to provide real-time feedback and optimization suggestions.
    • Furthermore, the integration of material science and biomechanics analysis in equipment design and athlete monitoring systems has led to performance enhancement and injury reduction. With data-driven insights, talent identification, and training optimization at the forefront, the market continues to evolve, offering significant potential for improving athletic performance and enhancing the overall sports experience.

    We can help! Our analysts can customize this sports technology market research report to meet your requirements.

    Get in touch

    1 Executive Summary

    • 1.1 Market overview
      • Executive Summary - Chart on Market Overview
      • Executive Summary - Data Table on Market Overview
      • Executive Summary - Chart on Global Market Characteristics
      • Executive Summary - Chart on Market by Geography
      • Executive Summary - Chart on Market Segmentation by End-user
      • Executive Summary - Chart on Market Segmentation by Technology
      • Executive Summary - Chart on Incremental Growth
      • Executive Summary - Data Table on Incremental Growth
      • Executive Summary - Chart on Company Market Positioning

    2 Technavio Analysis

    • 2.1 Analysis of price sensitivity, lifecycle, customer purchase basket, adoption rates, and purchase criteria
      • Analysis of price sensitivity, lifecycle, customer purchase basket, adoption rates, and purchase criteria
    • 2.2 Criticality of inputs and Factors of differentiation
      • Overview on criticality of inputs and factors of differentiation
    • 2.3 Factors of disruption
      • Overview on factors of disruption
    • 2.4 Impact of drivers and challenges
      • Impact of drivers and challenges in 2024 and 2029

    3 Market Landscape

    • 3.1 Market ecosystem
      • Parent Market
      • Data Table on - Parent Market
    • 3.2 Market characteristics
      • Market characteristics analysis
    • 3.3 Value chain analysis
      • Value chain analysis

    4 Market Sizing

    • 4.1 Market definition
      • Offerings of companies included in the market definition
    • 4.2 Market segment analysis
      • Market segments
    • 4.3 Market size 2024
      • 4.4 Market outlook: Forecast for 2024-2029
        • Chart on Global - Market size and forecast 2024-2029 ($ million)
        • Data Table on Global - Market size and forecast 2024-2029 ($ million)
        • Chart on Global Market: Year-over-year growth 2024-2029 (%)
        • Data Table on Global Market: Year-over-year growth 2024-2029 (%)

      5 Historic Market Size

      • 5.1 Global Sports Technology Market 2019 - 2023
        • Historic Market Size - Data Table on Global Sports Technology Market 2019 - 2023 ($ million)
      • 5.2 End-user segment analysis 2019 - 2023
        • Historic Market Size - End-user Segment 2019 - 2023 ($ million)
      • 5.3 Technology segment analysis 2019 - 2023
        • Historic Market Size - Technology Segment 2019 - 2023 ($ million)
      • 5.4 Geography segment analysis 2019 - 2023
        • Historic Market Size - Geography Segment 2019 - 2023 ($ million)
      • 5.5 Country segment analysis 2019 - 2023
        • Historic Market Size - Country Segment 2019 - 2023 ($ million)

      6 Qualitative Analysis

      • 6.1 Impact of AI on the global sports technology market

        7 Five Forces Analysis

        • 7.1 Five forces summary
          • Five forces analysis - Comparison between 2024 and 2029
        • 7.2 Bargaining power of buyers
          • Bargaining power of buyers - Impact of key factors 2024 and 2029
        • 7.3 Bargaining power of suppliers
          • Bargaining power of suppliers - Impact of key factors in 2024 and 2029
        • 7.4 Threat of new entrants
          • Threat of new entrants - Impact of key factors in 2024 and 2029
        • 7.5 Threat of substitutes
          • Threat of substitutes - Impact of key factors in 2024 and 2029
        • 7.6 Threat of rivalry
          • Threat of rivalry - Impact of key factors in 2024 and 2029
        • 7.7 Market condition
          • Chart on Market condition - Five forces 2024 and 2029

        8 Market Segmentation by End-user

        • 8.1 Market segments
          • Chart on End-user - Market share (2024-2029) (%)
          • Data Table on End-user - Market share (2024-2029) (%)
        • 8.2 Comparison by End-user
          • Chart on Comparison by End-user
          • Data Table on Comparison by End-user
        • 8.3 Sports association - Market size and forecast (2024-2029)
          • Chart on Sports association - Market size and forecast (2024-2029) ($ million)
          • Data Table on Sports association - Market size and forecast (2024-2029) ($ million)
          • Chart on Sports association - Year-over-year growth (2024-2029) (%)
          • Data Table on Sports association - Year-over-year growth (2024-2029) (%)
        • 8.4 Clubs and leagues - Market size and forecast (2024-2029)
          • Chart on Clubs and leagues - Market size and forecast (2024-2029) ($ million)
          • Data Table on Clubs and leagues - Market size and forecast (2024-2029) ($ million)
          • Chart on Clubs and leagues - Year-over-year growth (2024-2029) (%)
          • Data Table on Clubs and leagues - Year-over-year growth (2024-2029) (%)
        • 8.5 Athletes - Market size and forecast (2024-2029)
          • Chart on Athletes - Market size and forecast (2024-2029) ($ million)
          • Data Table on Athletes - Market size and forecast (2024-2029) ($ million)
          • Chart on Athletes - Year-over-year growth (2024-2029) (%)
          • Data Table on Athletes - Year-over-year growth (2024-2029) (%)
        • 8.6 Coaches - Market size and forecast (2024-2029)
          • Chart on Coaches - Market size and forecast (2024-2029) ($ million)
          • Data Table on Coaches - Market size and forecast (2024-2029) ($ million)
          • Chart on Coaches - Year-over-year growth (2024-2029) (%)
          • Data Table on Coaches - Year-over-year growth (2024-2029) (%)
        • 8.7 Fans/Spectators - Market size and forecast (2024-2029)
          • Chart on Fans/Spectators - Market size and forecast (2024-2029) ($ million)
          • Data Table on Fans/Spectators - Market size and forecast (2024-2029) ($ million)
          • Chart on Fans/Spectators - Year-over-year growth (2024-2029) (%)
          • Data Table on Fans/Spectators - Year-over-year growth (2024-2029) (%)
        • 8.8 Market opportunity by End-user
          • Market opportunity by End-user ($ million)
          • Data Table on Market opportunity by End-user ($ million)

        9 Market Segmentation by Technology

        • 9.1 Market segments
          • Chart on Technology - Market share (2024-2029) (%)
          • Data Table on Technology - Market share (2024-2029) (%)
        • 9.2 Comparison by Technology
          • Chart on Comparison by Technology
          • Data Table on Comparison by Technology
        • 9.3 Artificial intelligence/machine learning - Market size and forecast (2024-2029)
          • Chart on Artificial intelligence/machine learning - Market size and forecast (2024-2029) ($ million)
          • Data Table on Artificial intelligence/machine learning - Market size and forecast (2024-2029) ($ million)
          • Chart on Artificial intelligence/machine learning - Year-over-year growth (2024-2029) (%)
          • Data Table on Artificial intelligence/machine learning - Year-over-year growth (2024-2029) (%)
        • 9.4 Internet of Things (IoT) - Market size and forecast (2024-2029)
          • Chart on Internet of Things (IoT) - Market size and forecast (2024-2029) ($ million)
          • Data Table on Internet of Things (IoT) - Market size and forecast (2024-2029) ($ million)
          • Chart on Internet of Things (IoT) - Year-over-year growth (2024-2029) (%)
          • Data Table on Internet of Things (IoT) - Year-over-year growth (2024-2029) (%)
        • 9.5 Augmented reality/virtual reality - Market size and forecast (2024-2029)
          • Chart on Augmented reality/virtual reality - Market size and forecast (2024-2029) ($ million)
          • Data Table on Augmented reality/virtual reality - Market size and forecast (2024-2029) ($ million)
          • Chart on Augmented reality/virtual reality - Year-over-year growth (2024-2029) (%)
          • Data Table on Augmented reality/virtual reality - Year-over-year growth (2024-2029) (%)
        • 9.6 Market opportunity by Technology
          • Market opportunity by Technology ($ million)
          • Data Table on Market opportunity by Technology ($ million)

        10 Market Segmentation by Solution

        • 10.1 Market segments
          • Chart on Solution - Market share (2024-2029) (%)
          • Data Table on Solution - Market share (2024-2029) (%)
        • 10.2 Comparison by Solution
          • Chart on Comparison by Solution
          • Data Table on Comparison by Solution
        • 10.3 AR based - Market size and forecast (2024-2029)
          • Chart on AR based - Market size and forecast (2024-2029) ($ million)
          • Data Table on AR based - Market size and forecast (2024-2029) ($ million)
          • Chart on AR based - Year-over-year growth (2024-2029) (%)
          • Data Table on AR based - Year-over-year growth (2024-2029) (%)
        • 10.4 Conventional - Market size and forecast (2024-2029)
          • Chart on Conventional - Market size and forecast (2024-2029) ($ million)
          • Data Table on Conventional - Market size and forecast (2024-2029) ($ million)
          • Chart on Conventional - Year-over-year growth (2024-2029) (%)
          • Data Table on Conventional - Year-over-year growth (2024-2029) (%)
        • 10.5 Market opportunity by Solution
          • Market opportunity by Solution ($ million)
          • Data Table on Market opportunity by Solution ($ million)

        11 Market Segmentation by Application

        • 11.1 Market segments
          • Chart on Application - Market share (2024-2029) (%)
          • Data Table on Application - Market share (2024-2029) (%)
        • 11.2 Comparison by Application
          • Chart on Comparison by Application
          • Data Table on Comparison by Application
        • 11.3 Sports Associations - Market size and forecast (2024-2029)
          • Chart on Sports Associations - Market size and forecast (2024-2029) ($ million)
          • Data Table on Sports Associations - Market size and forecast (2024-2029) ($ million)
          • Chart on Sports Associations - Year-over-year growth (2024-2029) (%)
          • Data Table on Sports Associations - Year-over-year growth (2024-2029) (%)
        • 11.4 Sports Leagues - Market size and forecast (2024-2029)
          • Chart on Sports Leagues - Market size and forecast (2024-2029) ($ million)
          • Data Table on Sports Leagues - Market size and forecast (2024-2029) ($ million)
          • Chart on Sports Leagues - Year-over-year growth (2024-2029) (%)
          • Data Table on Sports Leagues - Year-over-year growth (2024-2029) (%)
        • 11.5 Sports Clubs - Market size and forecast (2024-2029)
          • Chart on Sports Clubs - Market size and forecast (2024-2029) ($ million)
          • Data Table on Sports Clubs - Market size and forecast (2024-2029) ($ million)
          • Chart on Sports Clubs - Year-over-year growth (2024-2029) (%)
          • Data Table on Sports Clubs - Year-over-year growth (2024-2029) (%)
        • 11.6 Market opportunity by Application
          • Market opportunity by Application ($ million)
          • Data Table on Market opportunity by Application ($ million)

        12 Customer Landscape

        • 12.1 Customer landscape overview
          • Analysis of price sensitivity, lifecycle, customer purchase basket, adoption rates, and purchase criteria

        13 Geographic Landscape

        • 13.1 Geographic segmentation
          • Chart on Market share by geography 2024-2029 (%)
          • Data Table on Market share by geography 2024-2029 (%)
        • 13.2 Geographic comparison
          • Chart on Geographic comparison
          • Data Table on Geographic comparison
        • 13.3 Europe - Market size and forecast 2024-2029
          • Chart on Europe - Market size and forecast 2024-2029 ($ million)
          • Data Table on Europe - Market size and forecast 2024-2029 ($ million)
          • Chart on Europe - Year-over-year growth 2024-2029 (%)
          • Data Table on Europe - Year-over-year growth 2024-2029 (%)
        • 13.4 North America - Market size and forecast 2024-2029
          • Chart on North America - Market size and forecast 2024-2029 ($ million)
          • Data Table on North America - Market size and forecast 2024-2029 ($ million)
          • Chart on North America - Year-over-year growth 2024-2029 (%)
          • Data Table on North America - Year-over-year growth 2024-2029 (%)
        • 13.5 APAC - Market size and forecast 2024-2029
          • Chart on APAC - Market size and forecast 2024-2029 ($ million)
          • Data Table on APAC - Market size and forecast 2024-2029 ($ million)
          • Chart on APAC - Year-over-year growth 2024-2029 (%)
          • Data Table on APAC - Year-over-year growth 2024-2029 (%)
        • 13.6 South America - Market size and forecast 2024-2029
          • Chart on South America - Market size and forecast 2024-2029 ($ million)
          • Data Table on South America - Market size and forecast 2024-2029 ($ million)
          • Chart on South America - Year-over-year growth 2024-2029 (%)
          • Data Table on South America - Year-over-year growth 2024-2029 (%)
        • 13.7 Middle East and Africa - Market size and forecast 2024-2029
          • Chart on Middle East and Africa - Market size and forecast 2024-2029 ($ million)
          • Data Table on Middle East and Africa - Market size and forecast 2024-2029 ($ million)
          • Chart on Middle East and Africa - Year-over-year growth 2024-2029 (%)
          • Data Table on Middle East and Africa - Year-over-year growth 2024-2029 (%)
        • 13.8 US - Market size and forecast 2024-2029
          • Chart on US - Market size and forecast 2024-2029 ($ million)
          • Data Table on US - Market size and forecast 2024-2029 ($ million)
          • Chart on US - Year-over-year growth 2024-2029 (%)
          • Data Table on US - Year-over-year growth 2024-2029 (%)
        • 13.9 Germany - Market size and forecast 2024-2029
          • Chart on Germany - Market size and forecast 2024-2029 ($ million)
          • Data Table on Germany - Market size and forecast 2024-2029 ($ million)
          • Chart on Germany - Year-over-year growth 2024-2029 (%)
          • Data Table on Germany - Year-over-year growth 2024-2029 (%)
        • 13.10 China - Market size and forecast 2024-2029
          • Chart on China - Market size and forecast 2024-2029 ($ million)
          • Data Table on China - Market size and forecast 2024-2029 ($ million)
          • Chart on China - Year-over-year growth 2024-2029 (%)
          • Data Table on China - Year-over-year growth 2024-2029 (%)
        • 13.11 UK - Market size and forecast 2024-2029
          • Chart on UK - Market size and forecast 2024-2029 ($ million)
          • Data Table on UK - Market size and forecast 2024-2029 ($ million)
          • Chart on UK - Year-over-year growth 2024-2029 (%)
          • Data Table on UK - Year-over-year growth 2024-2029 (%)
        • 13.12 Canada - Market size and forecast 2024-2029
          • Chart on Canada - Market size and forecast 2024-2029 ($ million)
          • Data Table on Canada - Market size and forecast 2024-2029 ($ million)
          • Chart on Canada - Year-over-year growth 2024-2029 (%)
          • Data Table on Canada - Year-over-year growth 2024-2029 (%)
        • 13.13 Japan - Market size and forecast 2024-2029
          • Chart on Japan - Market size and forecast 2024-2029 ($ million)
          • Data Table on Japan - Market size and forecast 2024-2029 ($ million)
          • Chart on Japan - Year-over-year growth 2024-2029 (%)
          • Data Table on Japan - Year-over-year growth 2024-2029 (%)
        • 13.14 France - Market size and forecast 2024-2029
          • Chart on France - Market size and forecast 2024-2029 ($ million)
          • Data Table on France - Market size and forecast 2024-2029 ($ million)
          • Chart on France - Year-over-year growth 2024-2029 (%)
          • Data Table on France - Year-over-year growth 2024-2029 (%)
        • 13.15 India - Market size and forecast 2024-2029
          • Chart on India - Market size and forecast 2024-2029 ($ million)
          • Data Table on India - Market size and forecast 2024-2029 ($ million)
          • Chart on India - Year-over-year growth 2024-2029 (%)
          • Data Table on India - Year-over-year growth 2024-2029 (%)
        • 13.16 Italy - Market size and forecast 2024-2029
          • Chart on Italy - Market size and forecast 2024-2029 ($ million)
          • Data Table on Italy - Market size and forecast 2024-2029 ($ million)
          • Chart on Italy - Year-over-year growth 2024-2029 (%)
          • Data Table on Italy - Year-over-year growth 2024-2029 (%)
        • 13.17 South Korea - Market size and forecast 2024-2029
          • Chart on South Korea - Market size and forecast 2024-2029 ($ million)
          • Data Table on South Korea - Market size and forecast 2024-2029 ($ million)
          • Chart on South Korea - Year-over-year growth 2024-2029 (%)
          • Data Table on South Korea - Year-over-year growth 2024-2029 (%)
        • 13.18 Market opportunity by geography
          • Market opportunity by geography ($ million)
          • Data Tables on Market opportunity by geography ($ million)
        • 13.19 Brazil - Market size and forecast (2024-2029)
          • Chart on Brazil - Market size and forecast (2024-2029) ($ million)
          • Data Table on Brazil - Market size and forecast (2024-2029) ($ million)
          • Chart on Brazil - Year-over-year growth (2024-2029) (%)
          • Data Table on Brazil - Year-over-year growth (2024-2029) (%)
        • 13.20 Egypt - Market size and forecast (2024-2029)
          • Chart on Egypt - Market size and forecast (2024-2029) ($ million)
          • Data Table on Egypt - Market size and forecast (2024-2029) ($ million)
          • Chart on Egypt - Year-over-year growth (2024-2029) (%)
          • Data Table on Egypt - Year-over-year growth (2024-2029) (%)
        • 13.21 UAE - Market size and forecast (2024-2029)
          • Chart on UAE - Market size and forecast (2024-2029) ($ million)
          • Data Table on UAE - Market size and forecast (2024-2029) ($ million)
          • Chart on UAE - Year-over-year growth (2024-2029) (%)
          • Data Table on UAE - Year-over-year growth (2024-2029) (%)
        • 13.22 Oman - Market size and forecast (2024-2029)
          • Chart on Oman - Market size and forecast (2024-2029) ($ million)
          • Data Table on Oman - Market size and forecast (2024-2029) ($ million)
          • Chart on Oman - Year-over-year growth (2024-2029) (%)
          • Data Table on Oman - Year-over-year growth (2024-2029) (%)
        • 13.23 Argentina - Market size and forecast (2024-2029)
          • Chart on Argentina - Market size and forecast (2024-2029) ($ million)
          • Data Table on Argentina - Market size and forecast (2024-2029) ($ million)
          • Chart on Argentina - Year-over-year growth (2024-2029) (%)
          • Data Table on Argentina - Year-over-year growth (2024-2029) (%)
        • 13.24 KSA - Market size and forecast (2024-2029)
          • Chart on KSA - Market size and forecast (2024-2029) ($ million)
          • Data Table on KSA - Market size and forecast (2024-2029) ($ million)
          • Chart on KSA - Year-over-year growth (2024-2029) (%)
          • Data Table on KSA - Year-over-year growth (2024-2029) (%)
        • 13.25 Rest of World (ROW) - Market size and forecast (2024-2029)
          • Chart on Rest of World (ROW) - Market size and forecast (2024-2029) ($ million)
          • Data Table on Rest of World (ROW) - Market size and forecast (2024-2029) ($ million)
          • Chart on Rest of World (ROW) - Year-over-year growth (2024-2029) (%)
          • Data Table on Rest of World (ROW) - Year-over-year growth (2024-2029) (%)

        14 Drivers, Challenges, and Opportunity/Restraints

        • 14.1 Market drivers
          • 14.2 Market challenges
            • 14.3 Impact of drivers and challenges
              • Impact of drivers and challenges in 2024 and 2029
            • 14.4 Market opportunities/restraints

              15 Competitive Landscape

              • 15.1 Overview
                • 15.2 Competitive Landscape
                  • Overview on criticality of inputs and factors of differentiation
                • 15.3 Landscape disruption
                  • Overview on factors of disruption
                • 15.4 Industry risks
                  • Impact of key risks on business

                16 Competitive Analysis

                • 16.1 Companies profiled
                  • Companies covered
                • 16.2 Market positioning of companies
                  • Matrix on companies position and classification
                • 16.3 Apple Inc.
                  • Apple Inc. - Overview
                  • Apple Inc. - Product / Service
                  • Apple Inc. - Key offerings
                • 16.4 Catapult Group International Ltd.
                  • Catapult Group International Ltd. - Overview
                  • Catapult Group International Ltd. - Product / Service
                  • Catapult Group International Ltd. - Key offerings
                • 16.5 Cisco Systems Inc.
                  • Cisco Systems Inc. - Overview
                  • Cisco Systems Inc. - Product / Service
                  • Cisco Systems Inc. - Key offerings
                • 16.6 Deltatre
                  • Deltatre - Overview
                  • Deltatre - Product / Service
                  • Deltatre - Key offerings
                • 16.7 Fitbit Inc.
                  • Fitbit Inc. - Overview
                  • Fitbit Inc. - Product / Service
                  • Fitbit Inc. - Key offerings
                • 16.8 Fujitsu Ltd.
                  • Fujitsu Ltd. - Overview
                  • Fujitsu Ltd. - Product / Service
                  • Fujitsu Ltd. - Key offerings
                • 16.9 Garmin Ltd.
                  • Garmin Ltd. - Overview
                  • Garmin Ltd. - Product / Service
                  • Garmin Ltd. - Key offerings
                • 16.10 Genius Sports Limited
                  • Genius Sports Limited - Overview
                  • Genius Sports Limited - Product / Service
                  • Genius Sports Limited - Key offerings
                • 16.11 Hawk-Eye Innovations Ltd.
                  • Hawk-Eye Innovations Ltd. - Overview
                  • Hawk-Eye Innovations Ltd. - Product / Service
                  • Hawk-Eye Innovations Ltd. - Key offerings
                • 16.12 IBM Corporation
                  • IBM Corporation - Overview
                  • IBM Corporation - Product / Service
                  • IBM Corporation - Key offerings
                • 16.13 Kinexon GmbH
                  • Kinexon GmbH - Overview
                  • Kinexon GmbH - Product / Service
                  • Kinexon GmbH - Key offerings
                • 16.14 Oracle Corporation
                  • Oracle Corporation - Overview
                  • Oracle Corporation - Product / Service
                  • Oracle Corporation - Key offerings
                • 16.15 PlaySight Interactive Ltd.
                  • PlaySight Interactive Ltd. - Overview
                  • PlaySight Interactive Ltd. - Product / Service
                  • PlaySight Interactive Ltd. - Key offerings
                • 16.16 Samsung Electronics Co. Ltd.
                  • Samsung Electronics Co. Ltd. - Overview
                  • Samsung Electronics Co. Ltd. - Product / Service
                  • Samsung Electronics Co. Ltd. - Key offerings
                • 16.17 SAP SE
                  • SAP SE - Overview
                  • SAP SE - Product / Service
                  • SAP SE - Key offerings
                • 16.18 Sony Corporation
                  • Sony Corporation - Overview
                  • Sony Corporation - Product / Service
                  • Sony Corporation - Key offerings
                • 16.19 Sportradar AG
                  • Sportradar AG - Overview
                  • Sportradar AG - Product / Service
                  • Sportradar AG - Key offerings
                • 16.20 Stats Perform
                  • Stats Perform - Overview
                  • Stats Perform - Product / Service
                  • Stats Perform - Key offerings
                • 16.21 Tencent Holdings Ltd.
                  • Tencent Holdings Ltd. - Overview
                  • Tencent Holdings Ltd. - Product / Service
                  • Tencent Holdings Ltd. - Key offerings
                • 16.22 Zebra Technologies Corporation
                  • Zebra Technologies Corporation - Overview
                  • Zebra Technologies Corporation - Product / Service
                  • Zebra Technologies Corporation - Key offerings
                • 16.23 Agile Sports Technologies Inc.
                  • Agile Sports Technologies Inc. - Overview
                  • Agile Sports Technologies Inc. - Product / Service
                  • Agile Sports Technologies Inc. - Key offerings
                • 16.24 Athlete Intelligence
                  • Athlete Intelligence - Overview
                  • Athlete Intelligence - Product / Service
                  • Athlete Intelligence - Key offerings
                • 16.25 Catapult Group International Ltd.
                  • Catapult Group International Ltd. - Overview
                  • Catapult Group International Ltd. - Product / Service
                  • Catapult Group International Ltd. - Key offerings
                • 16.26 Chetu Inc.
                  • Chetu Inc. - Overview
                  • Chetu Inc. - Product / Service
                  • Chetu Inc. - Key offerings
                • 16.27 Cisco Systems Inc.
                  • Cisco Systems Inc. - Overview
                  • Cisco Systems Inc. - Product / Service
                  • Cisco Systems Inc. - Key offerings
                • 16.28 Epicor Software Corp.
                  • Epicor Software Corp. - Overview
                  • Epicor Software Corp. - Product / Service
                  • Epicor Software Corp. - Key offerings
                • 16.29 Garmin Ltd.
                  • Garmin Ltd. - Overview
                  • Garmin Ltd. - Product / Service
                  • Garmin Ltd. - Key offerings
                • 16.30 International Business Machines Corp.
                  • International Business Machines Corp. - Overview
                  • International Business Machines Corp. - Product / Service
                  • International Business Machines Corp. - Key offerings
                • 16.31 Jonas Club Software
                  • Jonas Club Software - Overview
                  • Jonas Club Software - Product / Service
                  • Jonas Club Software - Key offerings
                • 16.32 Kinexon GmbH
                  • Kinexon GmbH - Overview
                  • Kinexon GmbH - Product / Service
                  • Kinexon GmbH - Key offerings
                • 16.33 Orreco
                  • Orreco - Overview
                  • Orreco - Product / Service
                  • Orreco - Key offerings
                • 16.34 PlaySight Interactive Ltd.
                  • PlaySight Interactive Ltd. - Overview
                  • PlaySight Interactive Ltd. - Product / Service
                  • PlaySight Interactive Ltd. - Key offerings
                • 16.35 Samsung Electronics Co. Ltd.
                  • Samsung Electronics Co. Ltd. - Overview
                  • Samsung Electronics Co. Ltd. - Product / Service
                  • Samsung Electronics Co. Ltd. - Key offerings
                • 16.36 SAP SE
                  • SAP SE - Overview
                  • SAP SE - Product / Service
                  • SAP SE - Key offerings
                • 16.37 Sportradar Group AG
                  • Sportradar Group AG - Overview
                  • Sportradar Group AG - Product / Service
                  • Sportradar Group AG - Key offerings
                • 16.38 Apple Inc.
                  • Apple Inc. - Overview
                  • Apple Inc. - Product / Service
                  • Apple Inc. - Key offerings
                • 16.39 HUDL
                  • HUDL - Overview
                  • HUDL - Product / Service
                  • HUDL - Key offerings
                • 16.40 Alphabet Inc.
                  • Alphabet Inc. - Overview
                  • Alphabet Inc. - Product / Service
                  • Alphabet Inc. - Key offerings
                • 16.41 Oracle Corporation
                  • Oracle Corporation - Overview
                  • Oracle Corporation - Product / Service
                  • Oracle Corporation - Key offerings
                • 16.42 Genius Sports Group
                  • Genius Sports Group - Overview
                  • Genius Sports Group - Product / Service
                  • Genius Sports Group - Key offerings
                • 16.43 Coach logic
                  • Coach logic - Overview
                  • Coach logic - Product / Service
                  • Coach logic - Key offerings

                17 Appendix

                • 17.1 Scope of the report
                  • 17.2 Inclusions and exclusions checklist
                    • Inclusions checklist
                    • Exclusions checklist
                  • 17.3 Currency conversion rates for US$
                    • Currency conversion rates for US$
                  • 17.4 Research methodology
                    • Research methodology
                  • 17.5 Data procurement
                    • Information sources
                  • 17.6 Data validation
                    • Data validation
                  • 17.7 Validation techniques employed for market sizing
                    • Validation techniques employed for market sizing
                  • 17.8 Data synthesis
                    • Data synthesis
                  • 17.9 360 degree market analysis
                    • 360 degree market analysis
                  • 17.10 List of abbreviations
                    • List of abbreviations

                  Research Methodology

                  Technavio presents a detailed picture of the market by way of study, synthesis, and summation of data from multiple sources. The analysts have presented the various facets of the market with a particular focus on identifying the key industry influencers. The data thus presented is comprehensive, reliable, and the result of extensive research, both primary and secondary.

                  INFORMATION SOURCES

                  Primary sources

                  • Manufacturers and suppliers
                  • Channel partners
                  • Industry experts
                  • Strategic decision makers

                  Secondary sources

                  • Industry journals and periodicals
                  • Government data
                  • Financial reports of key industry players
                  • Historical data
                  • Press releases

                  DATA ANALYSIS

                  Data Synthesis

                  • Collation of data
                  • Estimation of key figures
                  • Analysis of derived insights

                  Data Validation

                  • Triangulation with data models
                  • Reference against proprietary databases
                  • Corroboration with industry experts

                  REPORT WRITING

                  Qualitative

                  • Market drivers
                  • Market challenges
                  • Market trends
                  • Five forces analysis

                  Quantitative

                  • Market size and forecast
                  • Market segmentation
                  • Geographical insights
                  • Competitive landscape

                  Interested in this report?

                  Get your sample now to see our research methodology and insights!

                  Download Now

                  Frequently Asked Questions

                  Sports Technology market growth will increase by $ 25687.3 mn during 2025-2029 .

                  The Sports Technology market is expected to grow at a CAGR of 19.8% during 2025-2029 .

                  Sports Technology market is segmented by End-user( Sports association, Clubs and leagues, Athletes, Coaches, Fans/Spectators) Technology( Artificial intelligence/machine learning, Internet of Things (IoT), Augmented reality/virtual reality, South America, MEA)

                  Apple Inc., Catapult Group International Ltd., Cisco Systems Inc., Deltatre, Fitbit Inc., Fujitsu Ltd., Garmin Ltd., Genius Sports Limited, Hawk-Eye Innovations Ltd., IBM Corporation, Kinexon GmbH, Oracle Corporation, PlaySight Interactive Ltd., Samsung Electronics Co. Ltd., SAP SE, Sony Corporation, Sportradar AG, Stats Perform, Tencent Holdings Ltd., Zebra Technologies Corporation are a few of the key vendors in the Sports Technology market.

                  Europe will register the highest growth rate of 38% among the other regions. Therefore, the Sports Technology market in Europe is expected to garner significant business opportunities for the vendors during the forecast period.

                  US, Canada, Germany, UK, Italy, France, China, India, Japan, Brazil, Egypt, UAE, Oman, Argentina, KSA, UAE, Brazil, Rest of World (ROW)

                  • Rising number of sports technology eventsEvents using sports technology are not limited to an online audience only. They also take place at different physical locations is the driving factor this market.
                  • such as sports technology arenas is the driving factor this market.
                  • local sports technology bars is the driving factor this market.
                  • home venues is the driving factor this market.
                  • and other locations. Using sports technology at physical locations widens the audience base is the driving factor this market.
                  • actively promotes the sports technology concept locally and boosts the morale of sports technology players. The investments required for physically arranging a sports technology event are relatively high. This limits the participation of teams or players from different parts of the world. For instance is the driving factor this market.
                  • the US has sports technology arenas in seven different locations is the driving factor this market.
                  • while Meltdown sports technology bars are present at 27 global locations is the driving factor this market.
                  • and Wangyu Cybernet Cafés are present at around 1 is the driving factor this market.
                  • 000 locations worldwide. Organizations that conduct sports technology events at physical locations are popular is the driving factor this market.
                  • especially in China is the driving factor this market.
                  • where six cities are making efforts to become key sports technology hubs in the country. These cities are introducing policies and signing partnership deals or agreements to promote sports technology events. Versus Programming Network (VSPN) is the driving factor this market.
                  • Banana Culture is the driving factor this market.
                  • and Team WE signed partnership deals that focus on tournaments is the driving factor this market.
                  • property is the driving factor this market.
                  • and education with the government of Xian is the driving factor this market.
                  • the capital of Shaanxi Province (China). Some of the recent sports technology events are mentioned below:In July 2023 is the driving factor this market.
                  • the PUBG Mobile World Invitational (PMWI) 2023 was held in Riyad between 14 July 2023 and 16 July 2023Such developments are expected to continue is the driving factor this market.
                  • which will propel the growth of the sports technology during the forecast period. is the driving factor this market.

                  The Sports Technology market vendors should focus on grabbing business opportunities from the Sports association segment as it accounted for the largest market share in the base year.