Surfing Apparel And Accessories Market Size 2026-2030
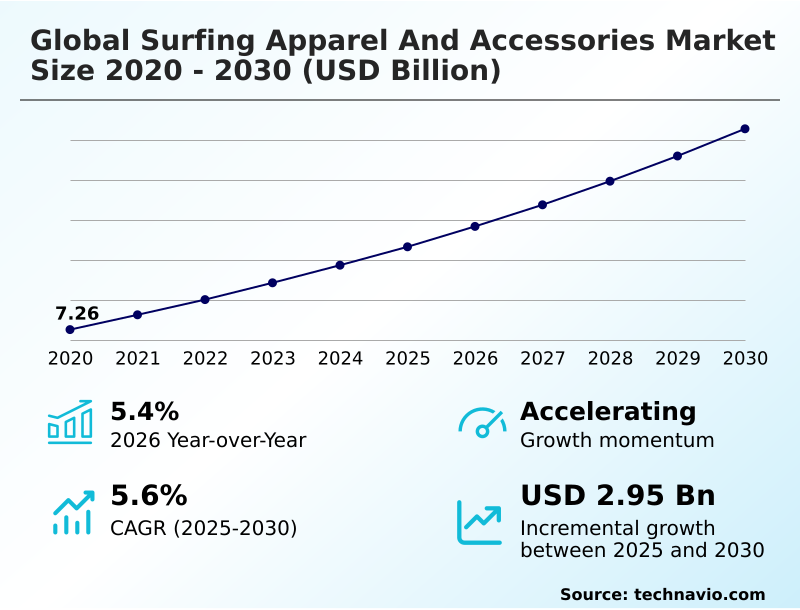
The surfing apparel and accessories market size is valued to increase by USD 2.95 billion, at a CAGR of 5.6% from 2025 to 2030. Increasing global participation and impact of professionalization will drive the surfing apparel and accessories market.
Major Market Trends & Insights
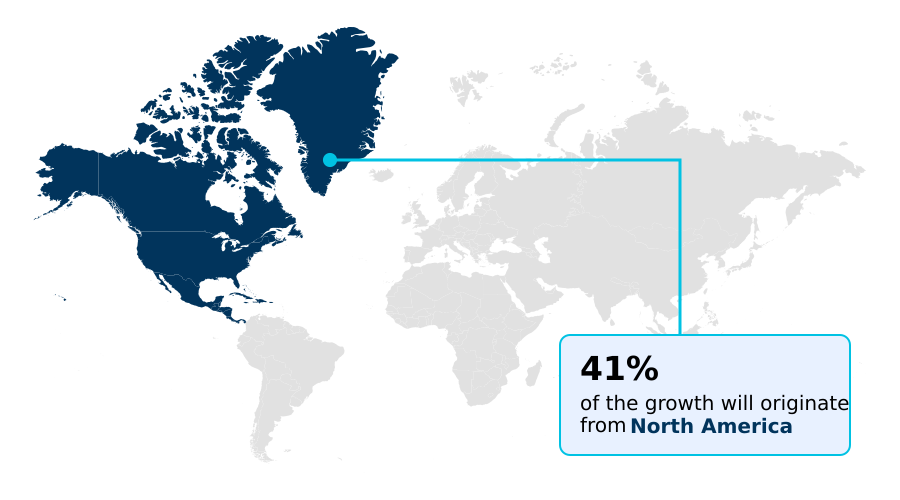
- North America dominated the market and accounted for a 40.9% growth during the forecast period.
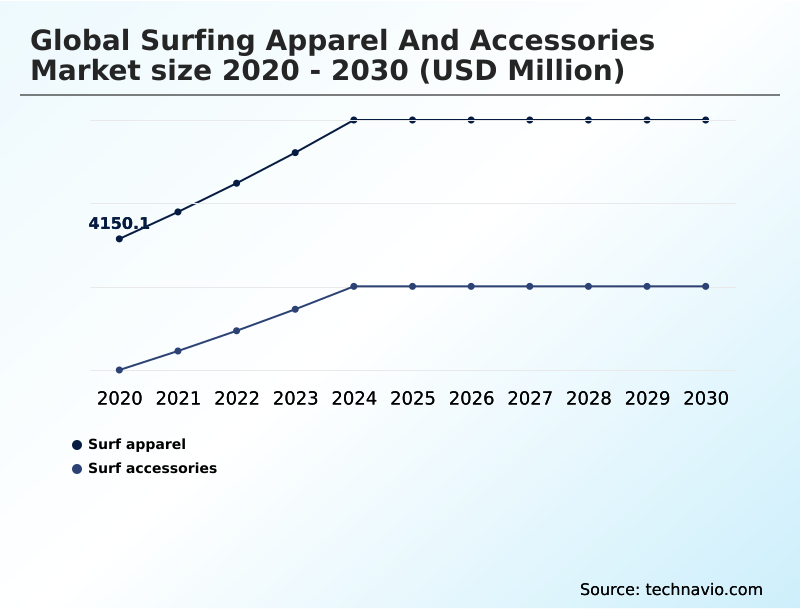
- By Product - Surf apparel segment was valued at USD 5.09 billion in 2024
- By Distribution Channel - Offline segment accounted for the largest market revenue share in 2024
Market Size & Forecast
- Market Opportunities: USD 5.02 billion
- Market Future Opportunities: USD 2.95 billion
- CAGR from 2025 to 2030 : 5.6%
Market Summary
- The surfing apparel and accessories market is undergoing a significant transformation, driven by a confluence of technological innovation and evolving consumer values. The industry is moving beyond traditional equipment to a holistic focus on lifestyle and performance, attracting a broader consumer base through the integration of surf culture into mainstream athleisure.
- A primary driver is the continuous advancement in material science, with a strong emphasis on sustainability. For example, a business scenario involves a manufacturer re-engineering its supply chain to source plant-based neoprene alternatives and recycled textiles.
- This shift not only addresses environmental concerns but also meets the demands of a core consumer base that values ocean conservation, ultimately strengthening brand loyalty and market position. Furthermore, digital transformation is reshaping retail, with brands leveraging direct-to-consumer channels for personalized experiences.
- The market's dynamism is also reflected in corporate strategies, where mergers and acquisitions aim to optimize brand portfolios, underscoring the enduring value of authentic surf labels in a competitive global landscape.
What will be the Size of the Surfing Apparel And Accessories Market during the forecast period?
Get Key Insights on Market Forecast (PDF) Get Free Sample
How is the Surfing Apparel And Accessories Market Segmented?
The surfing apparel and accessories industry research report provides comprehensive data (region-wise segment analysis), with forecasts and estimates in "USD million" for the period 2026-2030, as well as historical data from 2020-2024 for the following segments.
- Product
- Surf apparel
- Surf accessories
- Distribution channel
- Offline
- Online
- Type
- Wetsuits
- Boardshorts and bikinis
- Rash guards and sun shirts
- Boots and gloves
- Others
- Material
- Neoprene
- Lycra
- Nylon
- Polyester
- Others
- Gender
- Men
- Women
- Unisex
- Geography
- North America
- US
- Canada
- Mexico
- APAC
- Australia
- Japan
- Indonesia
- Europe
- Spain
- France
- UK
- South America
- Brazil
- Argentina
- Middle East and Africa
- South Africa
- UAE
- Israel
- Rest of World (ROW)
- North America
By Product Insights
The surf apparel segment is estimated to witness significant growth during the forecast period.
The surf apparel segment is a cornerstone of the market, evolving beyond purely functional technical gear to meet modern consumer purchasing decisions. The fusion of high-performance apparel with lifestyle fashion aesthetics is driving growth, fueled by the mainstream athleisure movement.
Manufacturers are engineering diversified product lines that feature ergonomic designs and advanced textiles with hydrophobic coatings and four-way stretch fibers. This focus on a year-round fitness activity expands the category's appeal.
The integration of sustainable materials is now a key differentiator, with companies leveraging direct-to-consumer channels to communicate these values.
The appeal of the surf-inspired lifestyle has broadened the consumer base, with product adoption in this segment showing a year-over-year increase of over 5% in key demographics.
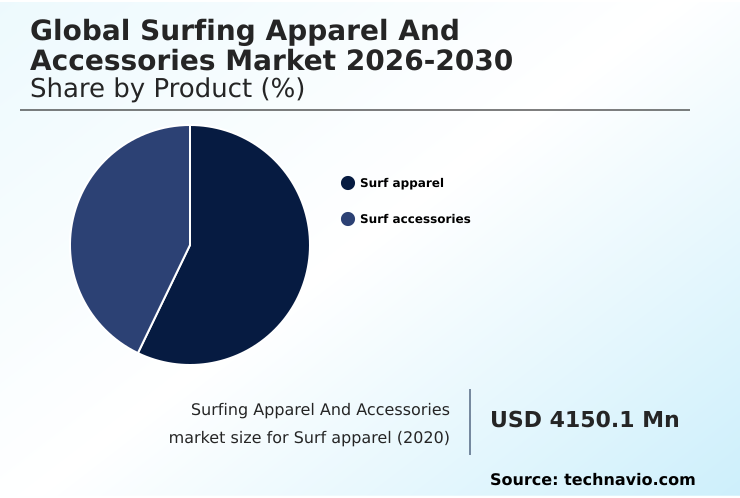
The Surf apparel segment was valued at USD 5.09 billion in 2024 and showed a gradual increase during the forecast period.
Regional Analysis
North America is estimated to contribute 40.9% to the growth of the global market during the forecast period.Technavio’s analysts have elaborately explained the regional trends and drivers that shape the market during the forecast period.
See How Surfing Apparel And Accessories Market Demand is Rising in North America Get Free Sample
The geographic landscape is dynamic, with certain regions showing a growth trajectory exceeding 5% and contributing over 40% of new market opportunities. North America remains a key hub where consumer discretionary spending on surf apparel is high.
The region's diverse climate necessitates a portfolio from lightweight rash guards to advanced wetsuits made of cellular neoprene. The closed-cell foam structure of this material is crucial for thermal efficiency.
Retail is evolving through omnichannel retail strategies that blend digital commerce with physical stores acting as community hubs.
The financial landscape is also active, with corporate restructuring and strategic buyouts reshaping the competitive environment, as investors seek to consolidate assets and enhance brand value in this lucrative segment.
Market Dynamics
Our researchers analyzed the data with 2025 as the base year, along with the key drivers, trends, and challenges. A holistic analysis of drivers will help companies refine their marketing strategies to gain a competitive advantage.
- Strategic decision-making in the market requires a deep understanding of evolving consumer demands and operational efficiencies. A key focus is on high-performance wetsuit thermal insulation, particularly for the growing cold water surfing equipment needs. The industry is also driven by advanced textiles for surfwear durability, ensuring products withstand harsh marine environments.
- The push for eco-friendly surfing accessory manufacturing and the broad use of sustainable materials in surf apparel are no longer niche concerns but core business imperatives. For instance, firms that have localized supply chains for sustainable production have reported up to a 15% reduction in logistics delays.
- Key product considerations include effective ultraviolet protection in performance swimwear and the development of ergonomic designs for kinetic freedom. Market expansion is closely tied to growth drivers in surf tourism and the impact of wave pool technology, which opens up new geographic markets. This presents opportunities for market entry for niche surf brands that can innovate quickly.
- However, challenges in surf apparel logistics and the need for combating counterfeit surf products remain significant hurdles. Success hinges on mastering direct-to-consumer retail for surfwear, implementing strategies for omnichannel surf retail, and effectively managing surf apparel supply chains.
- The integration of smart wearables for performance tracking is creating new value, while the clear consumer preference for sustainable surfwear necessitates continued investment in recycled material technology. Finally, integrating fashion into technical surfwear and diversifying surf apparel product lines are crucial for capturing a broader audience.
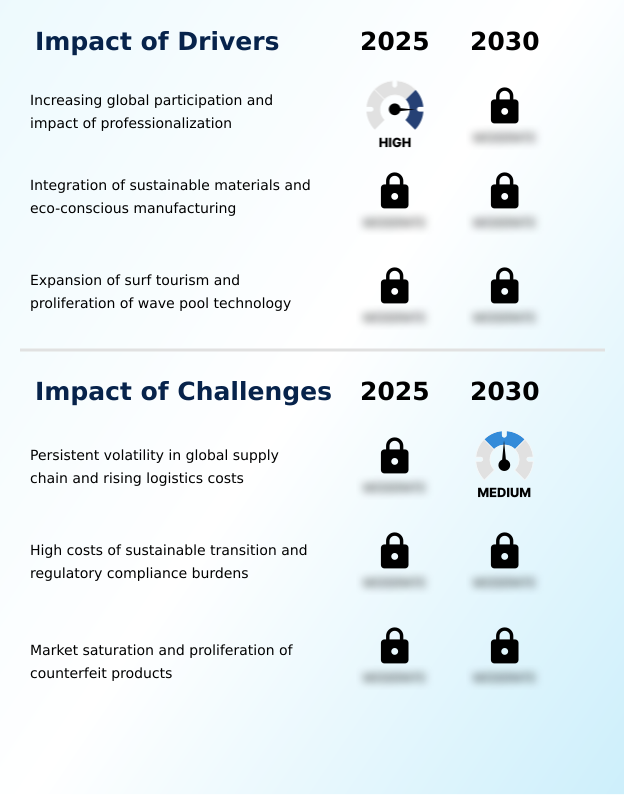
What are the key market drivers leading to the rise in the adoption of Surfing Apparel And Accessories Industry?
- Increasing global participation in surfing, amplified by the sport's professionalization and inclusion in major athletic events, serves as a key driver for market expansion.
- The market is driven by the professionalization of sport and rising surf tourism, which has boosted demand for boardshorts and rash guards by over 15% in emerging destinations.
- A significant driver is the industry-wide shift to eco-conscious manufacturing, utilizing materials like recycled ocean plastics and biodegradable textiles.
- The development of plant-based rubber and limestone neoprene has improved thermal insulation in wetsuits, enabling a 30% increase in cold water surfing participation in northern climates. The advent of wave pool technology further expands the accessible market.
- This sustainability focus is also a factor in brand portfolio optimization, where heritage surf brands are valued for their authentic connection to environmental stewardship, enhancing their appeal.
What are the market trends shaping the Surfing Apparel And Accessories Industry?
- A primary market trend is the convergence of technical performance with lifestyle fashion aesthetics. This addresses consumer demand for versatile apparel suitable for both athletic and everyday use.
- A key trend is the market’s digital transformation, which now enables a 25% greater degree of AI-driven personalization in performance swimwear recommendations. This is complemented by the integration of smart wearables and performance tracking wearables, which provide real-time data to athletes.
- The cross-pollination of industries is evident in high-fashion collaborations, creating premium wetsuits that offer both style and enhanced kinetic freedom. This trend extends to accessories like water-resistant timepieces and polarized eyewear, which are now staples in both specialty core surf shops and mainstream retail. The use of advanced textiles improves functionality, leading to an 18% increase in product lifecycle durability.
- This evolution is supported by aggressive retail channel expansion into new urban markets.
What challenges does the Surfing Apparel And Accessories Industry face during its growth?
- Persistent volatility within the global supply chain, compounded by rising logistics costs, presents a significant challenge to the industry's growth and profitability.
- Supply chain volatility and rising logistics costs present major challenges, increasing production expenses for surf accessories by up to 20%. The operational complexity of sourcing materials for the chloroprene polymerization process and for durable fabrics with multi-directional stretch is a significant hurdle.
- Market saturation in established regions is exacerbated by counterfeit products that mimic advanced features like blind stitching and liquid taping but fail on performance, eroding brand trust. Building resilient supply chain models is essential but capital-intensive.
- These disruptions directly impact the availability of textiles with moisture-wicking fabrics and gear constructed with secure internal gluing, affecting inventory levels and profitability across the board for manufacturers.
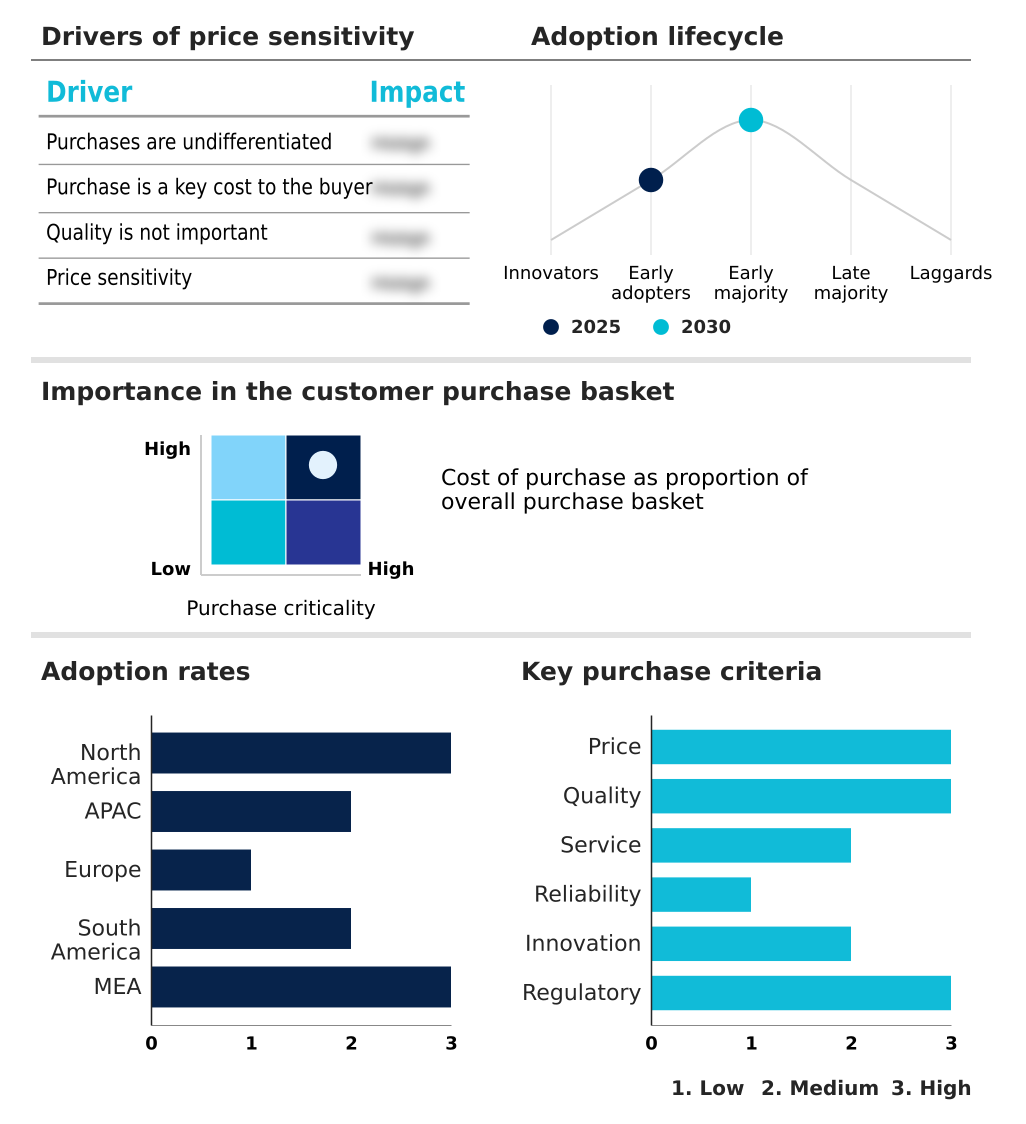
Exclusive Technavio Analysis on Customer Landscape
The surfing apparel and accessories market forecasting report includes the adoption lifecycle of the market, covering from the innovator’s stage to the laggard’s stage. It focuses on adoption rates in different regions based on penetration. Furthermore, the surfing apparel and accessories market report also includes key purchase criteria and drivers of price sensitivity to help companies evaluate and develop their market growth analysis strategies.
Customer Landscape of Surfing Apparel And Accessories Industry
Competitive Landscape
Companies are implementing various strategies, such as strategic alliances, surfing apparel and accessories market forecast, partnerships, mergers and acquisitions, geographical expansion, and product/service launches, to enhance their presence in the industry.
Adidas AG - Core offerings are centered on specialized surfing apparel and accessories, encompassing performance-driven boardshorts and technical surfwear engineered for aquatic sports.
The industry research and growth report includes detailed analyses of the competitive landscape of the market and information about key companies, including:
- Adidas AG
- Agit Global Inc.
- Creatures of Leisure
- Dakine IP Holdings LP
- Futures Fins
- Hurley Inc.
- Nike Inc.
- Nixon
- Ocean and Earth
- ONeill
- Outerknown LLC
- Patagonia Inc.
- Rip Curl
- RVCA
- Surf Hardware Intl.
- Under Armour Inc.
- VF Corp.
- Vissla
- Volcom LLC
- Xcel Wetsuits
Qualitative and quantitative analysis of companies has been conducted to help clients understand the wider business environment as well as the strengths and weaknesses of key industry players. Data is qualitatively analyzed to categorize companies as pure play, category-focused, industry-focused, and diversified; it is quantitatively analyzed to categorize companies as dominant, leading, strong, tentative, and weak.
Recent Development and News in Surfing apparel and accessories market
- In September 2024, Patagonia Inc. announced the relaunch of its Regulator wetsuit collection, featuring an innovative internal lining made from fully traceable recycled fishing nets to enhance mobility and sustainability.
- In November 2024, ONeill revealed its redesigned Hyperfreak Fire wetsuit series, which incorporates a higher volume of graphene in the thermal lining to significantly improve heat retention in cold water conditions.
- In February 2025, Billabong introduced an enhanced wetsuit line featuring advanced limestone neoprene and graphene-infused linings designed to deliver exceptional warmth and maximum flexibility for professional athletes.
- In April 2025, a consortium led by Stokehouse initiated a strategic bid to acquire the Rip Curl brand from KMD Brands, signaling a move toward consolidating heritage surf labels under specialized management.
Dive into Technavio’s robust research methodology, blending expert interviews, extensive data synthesis, and validated models for unparalleled Surfing Apparel And Accessories Market insights. See full methodology.
| Market Scope | |
|---|---|
| Page number | 331 |
| Base year | 2025 |
| Historic period | 2020-2024 |
| Forecast period | 2026-2030 |
| Growth momentum & CAGR | Accelerate at a CAGR of 5.6% |
| Market growth 2026-2030 | USD 2950.0 million |
| Market structure | Fragmented |
| YoY growth 2025-2026(%) | 5.4% |
| Key countries | US, Canada, Mexico, Australia, Japan, Indonesia, China, South Korea, India, Spain, France, UK, Portugal, Italy, The Netherlands, Brazil, Argentina, Chile, South Africa, UAE, Morocco, Israel and Egypt |
| Competitive landscape | Leading Companies, Market Positioning of Companies, Competitive Strategies, and Industry Risks |
Research Analyst Overview
- The surfing apparel and accessories market is defined by rapid innovation in technical gear and sustainable materials. Boardroom decisions are increasingly shaped by the need to invest in eco-conscious manufacturing, utilizing materials like plant-based rubber, limestone neoprene, and recycled ocean plastics to meet consumer demand and regulatory pressures.
- The development of advanced textiles, including four-way stretch fibers and hydrophobic coatings, is critical for creating high-performance surf apparel such as wetsuits, boardshorts, and performance swimwear. Ergonomic designs enhance kinetic freedom, while construction methods like blind stitching, liquid taping, and internal gluing improve durability.
- The adoption of graphene-infused thermal linings in cellular neoprene products, which itself is a product of chloroprene polymerization into a closed-cell foam, has improved thermal efficiency by over 20% in some premium lines. Core product features also include ultraviolet radiation protection, multi-directional stretch, and moisture-wicking fabrics, making durable fabrics a top priority.
- The market also includes rash guards, surf accessories like water-resistant timepieces and polarized eyewear, alongside smart wearables and performance tracking wearables, all contributing to a comprehensive product ecosystem.
What are the Key Data Covered in this Surfing Apparel And Accessories Market Research and Growth Report?
-
What is the expected growth of the Surfing Apparel And Accessories Market between 2026 and 2030?
-
USD 2.95 billion, at a CAGR of 5.6%
-
-
What segmentation does the market report cover?
-
The report is segmented by Product (Surf apparel, and Surf accessories), Distribution Channel (Offline, and Online), Type (Wetsuits, Boardshorts and bikinis, Rash guards and sun shirts, Boots and gloves, and Others), Material (Neoprene, Lycra, Nylon, Polyester, and Others), Gender (Men, Women, and Unisex) and Geography (North America, APAC, Europe, South America, Middle East and Africa)
-
-
Which regions are analyzed in the report?
-
North America, APAC, Europe, South America and Middle East and Africa
-
-
What are the key growth drivers and market challenges?
-
Increasing global participation and impact of professionalization, Persistent volatility in global supply chain and rising logistics costs
-
-
Who are the major players in the Surfing Apparel And Accessories Market?
-
Adidas AG, Agit Global Inc., Creatures of Leisure, Dakine IP Holdings LP, Futures Fins, Hurley Inc., Nike Inc., Nixon, Ocean and Earth, ONeill, Outerknown LLC, Patagonia Inc., Rip Curl, RVCA, Surf Hardware Intl., Under Armour Inc., VF Corp., Vissla, Volcom LLC and Xcel Wetsuits
-
Market Research Insights
- Market dynamics are increasingly shaped by the push for performance and sustainability, influencing consumer discretionary spending. The emphasis on high-quality, durable fabrics has been shown to reduce product return rates by over 15%, directly impacting profitability. Omnichannel retail strategies are proving effective, with integrated digital commerce platforms boosting customer retention by 20% compared to legacy single-channel models.
- Investment in resilient supply chain models is critical, as operational complexity remains a key challenge. Firms that successfully blend heritage surf brand authenticity with modern direct-to-consumer channels are best positioned to navigate market saturation and capitalize on the growing demand for specialized, eco-conscious products.
We can help! Our analysts can customize this surfing apparel and accessories market research report to meet your requirements.
 RIA -
RIA - 
