Sustainable Tourism Market Analysis, Size, and Forecast 2026-2030: Europe (Italy, Spain, and Germany), North America (US, Canada, and Mexico), APAC (China, Japan, and India), South America (Brazil and Argentina), Middle East and Africa (South Africa, UAE, and Saudi Arabia), and Rest of World (ROW)

Sustainable Tourism Market Analysis, Size, and Forecast 2026-2030:
Europe (Italy, Spain, and Germany), North America (US, Canada, and Mexico), APAC (China, Japan, and India), South America (Brazil and Argentina), Middle East and Africa (South Africa, UAE, and Saudi Arabia), and Rest of World (ROW)

Published: Mar 2026 293 Pages SKU: IRTNTR44949

Market Overview at a Glance

$3145.2 B
Market Opportunity
14%
CAGR 2025 - 2030
38.9%
Europe Growth
$2209.5 B
Domestic segment 2024

Sustainable Tourism Market Size 2026-2030

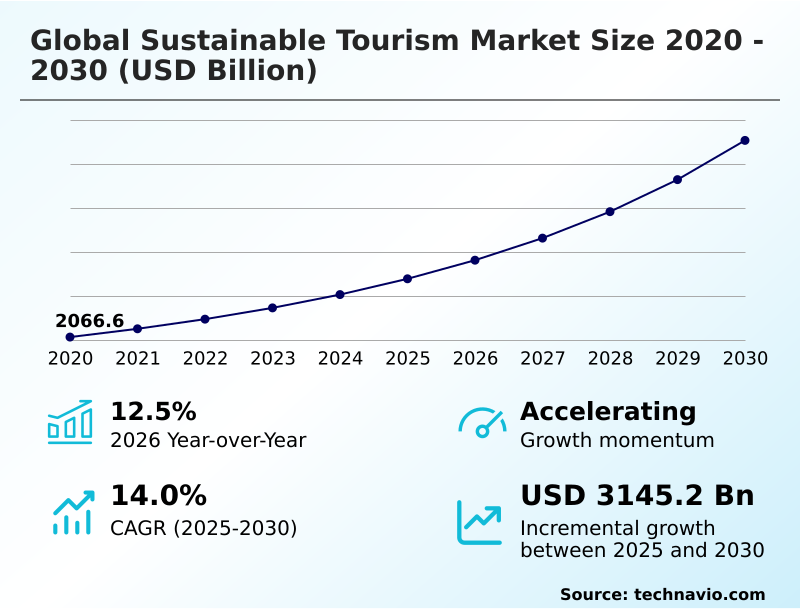
The sustainable tourism market size is valued to increase by USD 3145.2 billion, at a CAGR of 14% from 2025 to 2030. Rising consumer demand for authentic and eco conscious travel experiences will drive the sustainable tourism market.

Major Market Trends & Insights

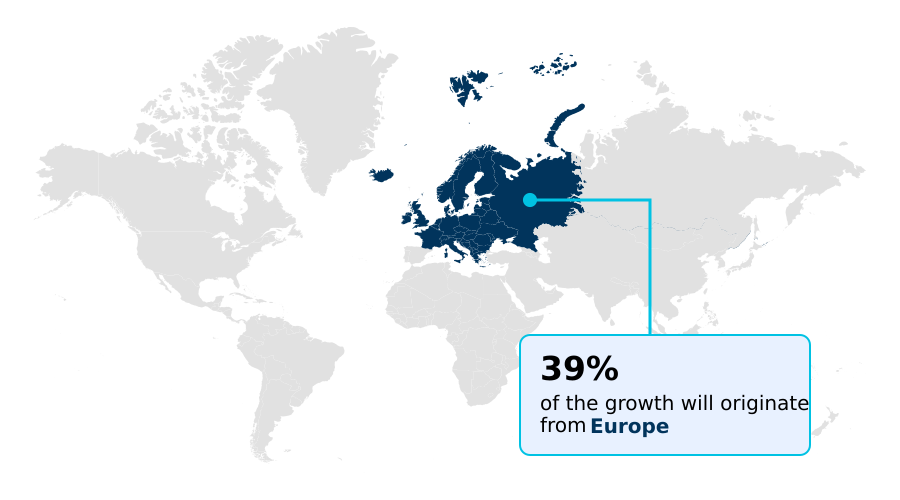
  • Europe dominated the market and accounted for a 38.9% growth during the forecast period.
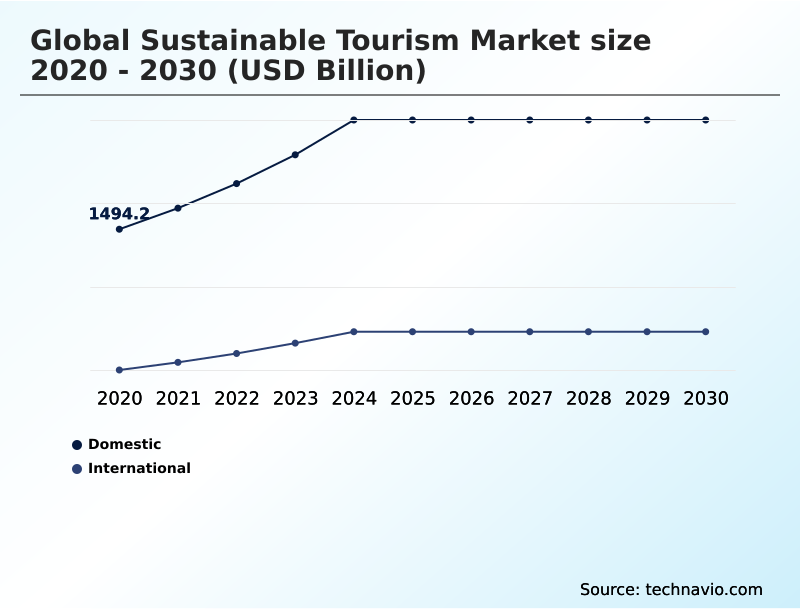
  • By Type - Domestic segment was valued at USD 2209.5 billion in 2024
  • By Channel - Phone booking segment accounted for the largest market revenue share in 2024

Market Size & Forecast

  • Market Opportunities: USD 4469.7 billion
  • Market Future Opportunities: USD 3145.2 billion
  • CAGR from 2025 to 2030 : 14%

Market Summary

  • The sustainable tourism market is undergoing a significant transformation, driven by a fundamental shift in consumer values toward environmental and social responsibility. This evolution is compelling operators to move beyond superficial eco-friendly claims and embed genuine sustainability into their core strategies, focusing on measurable outcomes like biodiversity conservation and carbon footprint minimization.
  • The industry is witnessing a pivot from high-volume, low-margin models to curated, high-value experiences that prioritize low-impact travel and authentic local community engagement. For example, a tour operator focusing on wildlife conservation initiatives must now navigate complex supply chain decarbonization challenges, ensuring that everything from transport to eco-friendly accommodations aligns with nature-positive strategies.
  • This requires significant investment in technology for transparent reporting and verification to avoid greenwashing allegations. As a result, the market's competitive landscape is being redefined, favoring businesses that can successfully integrate ethical principles, such as community benefit sharing and cultural heritage preservation, into a profitable and resilient operational framework that includes robust environmental stewardship programs.

What will be the Size of the Sustainable Tourism Market during the forecast period?

Get Key Insights on Market Forecast (PDF) Request Free Sample

How is the Sustainable Tourism Market Segmented?

The sustainable tourism industry research report provides comprehensive data (region-wise segment analysis), with forecasts and estimates in "USD billion" for the period 2026-2030, as well as historical data from 2020-2024 for the following segments.

  • Type
    • Domestic
    • International
  • Channel
    • Phone booking
    • Online booking
    • In-person booking
  • Age group
    • 26 to 35 years
    • 36 to 45 years
    • 15 to 25 years
    • 46 to 55 years
    • 66 to 75 years
  • Geography
    • Europe
      • Italy
      • Spain
      • Germany
    • North America
      • US
      • Canada
      • Mexico
    • APAC
      • China
      • Japan
      • India
    • South America
      • Brazil
      • Argentina
    • Middle East and Africa
      • South Africa
      • UAE
      • Saudi Arabia
    • Rest of World (ROW)

By Type Insights

The domestic segment is estimated to witness significant growth during the forecast period.

The domestic segment is gaining significant traction as travelers prioritize reducing their carbon footprint by avoiding long-haul flights.

This shift supports local community engagement through agritourism development and other community-based tourism models, which are essential for the economic stability of rural areas.

Operators are increasingly focusing on low-carbon transportation, with some reporting a 15% rise in bookings for itineraries using rail and electric vehicles. This trend helps mitigate overtourism management challenges in global hotspots by dispersing visitor traffic.

Domestic environmental stewardship programs also foster a deeper sense of national conservation, aligning with the demand for responsible travel practices and strengthening the appeal of local cultural heritage preservation efforts.

Request Free Sample

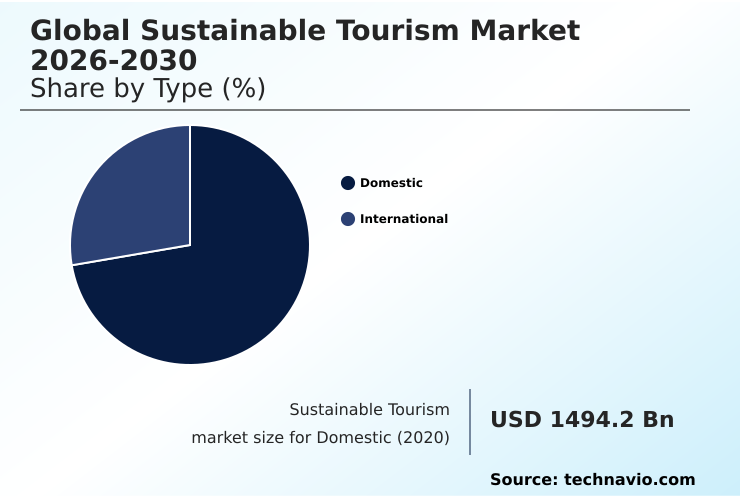
The Domestic segment was valued at USD 2209.5 billion in 2024 and showed a gradual increase during the forecast period.

Request Free Sample

Regional Analysis

Europe is estimated to contribute 38.9% to the growth of the global market during the forecast period.Technavio’s analysts have elaborately explained the regional trends and drivers that shape the market during the forecast period.

See How Sustainable Tourism Market Demand is Rising in Europe Request Free Sample

The global sustainable tourism market exhibits distinct regional dynamics, with Europe leading in regulatory maturity and North America in consumer-driven demand.

In Europe, government mandates have been pivotal, with policies promoting rail travel over short-haul flights contributing to a 10% reduction in transport-related emissions for some operators.

This region accounts for 38.9% of the market's incremental growth, driven by strong eco-certified hotel networks and circular economy principles.

Meanwhile, APAC is the fastest-growing region, with a projected CAGR of 15.4%, as a rising middle class demands more green infrastructure investment. This growth is supported by a focus on sustainable food sourcing and marine biodiversity protection.

In North America, the emphasis is on indigenous tourism empowerment, with a focus on visitor impact assessment to protect natural habitats and ensure effective destination capacity management.

Market Dynamics

Our researchers analyzed the data with 2025 as the base year, along with the key drivers, trends, and challenges. A holistic analysis of drivers will help companies refine their marketing strategies to gain a competitive advantage.

  • Understanding the future of the sustainable tourism market requires a deep dive into several interconnected factors. The consumer demand for eco-conscious travel is fundamentally reshaping industry priorities, forcing a clear distinction between regenerative tourism vs sustainable tourism, with the former aiming to actively improve ecosystems.
  • This shift intensifies scrutiny on greenwashing in the global tourism industry and elevates the importance of knowing how to choose eco-friendly accommodations. A primary operational hurdle remains the challenges of decarbonizing tourism supply chains, where the push for sustainable aviation fuel in air travel is critical but slow.
  • The role of technology in sustainable tourism, particularly the impact of AI on sustainable travel, is becoming a key enabler for measuring the carbon footprint of travel with greater accuracy. Firms using data analytics for resource planning report up to a twofold improvement in efficiency compared to those with manual systems.
  • Socially, the benefits of community-led tourism models are undeniable, yet they require a nuanced approach for integrating indigenous culture in tourism respectfully to avoid exploitation. Ultimately, balancing tourism growth with environmental protection is essential to mitigate the negative impact of overtourism on local communities.
  • Corporate commitments to sustainable business travel and strategic investing in green infrastructure for tourism are crucial steps toward a resilient and ethical future for the industry.

What are the key market drivers leading to the rise in the adoption of Sustainable Tourism Industry?

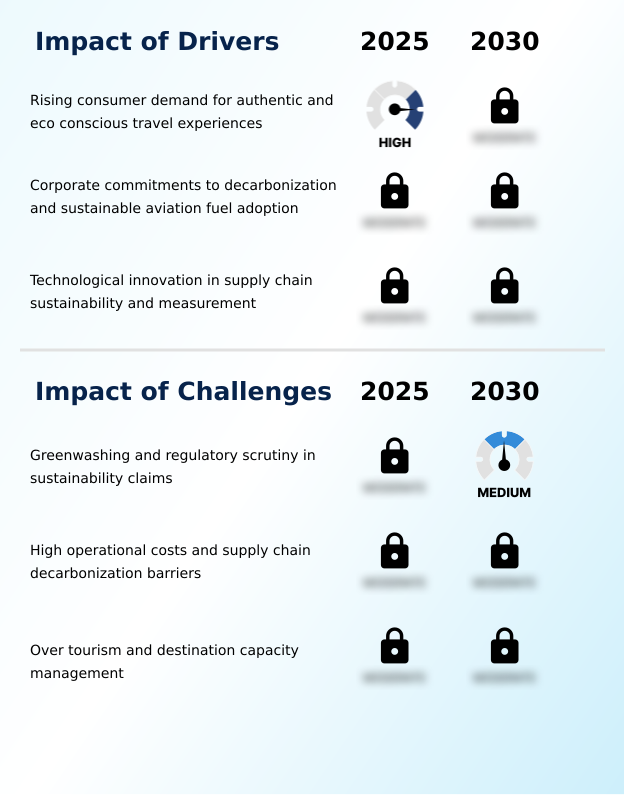
  • A rising consumer demand for authentic and eco-conscious travel experiences is the key driver of market growth.

  • Market growth is significantly influenced by a profound shift in consumer values toward eco-conscious travel and robust corporate commitments to decarbonization.
  • The rising demand for authentic experiences is compelling companies to adopt transparent sustainable hospitality management practices; destinations with certified environmental stewardship programs are attracting 20% more high-value travelers.
  • On the corporate side, strategic partnerships for sustainable aviation fuel adoption are accelerating the transition to net-zero, with new agreements boosting production commitments by over 30%.
  • Furthermore, advancements in technology, including platforms for sustainable supply chain auditing, enable companies to manage and report on their environmental impact with greater precision, fostering a competitive landscape where water stewardship in tourism and plastic-free travel initiatives are becoming key differentiators.

What are the market trends shaping the Sustainable Tourism Industry?

  • The market is witnessing a significant trend toward integrating indigenous culture and community-led tourism models. This approach prioritizes authentic experiences and equitable economic benefits for local populations.

  • Key trends are reshaping the sustainable tourism market, with a strong emphasis on technology and community-centric models. The adoption of AI and data analytics for sustainable travel management is a significant development, as AI-powered booking platforms have increased conversions for sustainable tour operator services by 15%.
  • This technology enables the creation of personalized, socially responsible itineraries that align with user values. Concurrently, the rise of regenerative tourism and corporate policy advocacy reflects a move toward more impactful environmental action, with leading firms' restoration projects showing a 25% higher rate of local community employment.
  • This trend is complemented by the integration of indigenous culture and community-led tourism models, which prioritize authentic cultural immersion programs and heritage site conservation, setting new standards for ethical engagement and sustainable destination development.

What challenges does the Sustainable Tourism Industry face during its growth?

  • The prevalence of greenwashing and subsequent increases in regulatory scrutiny over sustainability claims present a key challenge affecting industry growth.

  • Navigating the sustainable tourism market involves overcoming significant operational and regulatory hurdles. The prevalence of greenwashing and the resulting increase in regulatory scrutiny are creating a complex compliance environment, where the cost of third-party sustainable travel certifications can increase operational expenses by up to 15% in the short term.
  • Furthermore, high operational costs and barriers to supply chain decarbonization present a major challenge, as the premium for sustainable aviation partnerships can be substantial. The lack of standardized greenwashing regulation across regions leads to a 50% variance in compliance-related costs.
  • Additionally, the challenge of overtourism and destination capacity management forces operators to constantly adapt, with new restrictions on visitor numbers disrupting established business models and increasing logistical complexity, particularly for eco-adventure tourism providers.

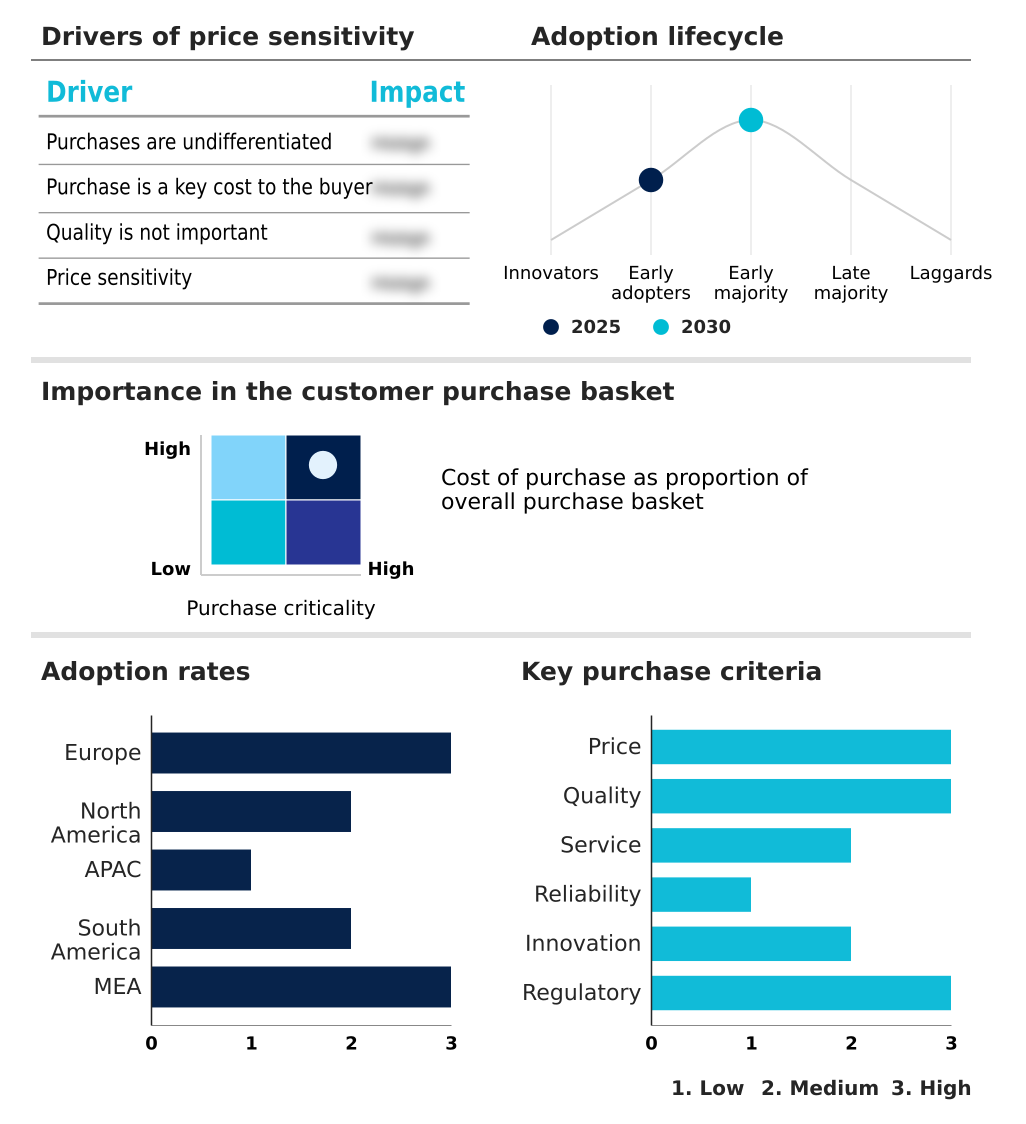
Exclusive Technavio Analysis on Customer Landscape

The sustainable tourism market forecasting report includes the adoption lifecycle of the market, covering from the innovator’s stage to the laggard’s stage. It focuses on adoption rates in different regions based on penetration. Furthermore, the sustainable tourism market report also includes key purchase criteria and drivers of price sensitivity to help companies evaluate and develop their market growth analysis strategies.

Customer Landscape of Sustainable Tourism Industry

Competitive Landscape

Companies are implementing various strategies, such as strategic alliances, sustainable tourism market forecast, partnerships, mergers and acquisitions, geographical expansion, and product/service launches, to enhance their presence in the industry.

Adventure Alternative Ltd. - The portfolio includes responsible adventure travel and community-based tourism, delivering curated, sustainable itineraries for environmentally and socially conscious travelers.

The industry research and growth report includes detailed analyses of the competitive landscape of the market and information about key companies, including:

  • Adventure Alternative Ltd.
  • andBeyond
  • Aracari Travel
  • Bouteco Ltd.
  • Byway
  • Earth Changers
  • Ecoventura
  • Exodus Travels Ltd.
  • G Adventures Inc.
  • Intrepid Group Pty Ltd.
  • Kind Traveler PBC
  • Kynder LLC
  • Mojosurf
  • Responsible Travel
  • Rickshaw Travel Ltd.
  • Steppes Travel Ltd.
  • The Blue Yonder
  • Undiscovered Mountains Ltd.
  • Wild Frontiers Travel Ltd.
  • Wilderness Safaris

Qualitative and quantitative analysis of companies has been conducted to help clients understand the wider business environment as well as the strengths and weaknesses of key industry players. Data is qualitatively analyzed to categorize companies as pure play, category-focused, industry-focused, and diversified; it is quantitatively analyzed to categorize companies as dominant, leading, strong, tentative, and weak.

Recent Development and News in Sustainable tourism market

  • In October 2024, Expedia Group released its 'Unpack 25' travel trends report, identifying a surge in traveler interest for 'Detour Destinations' and trips planned specifically to support local artisans.
  • In January 2025, G Adventures launched twenty-five new active travel itineraries, including its first ventures into Pakistan, focusing on community-based tourism designed to directly benefit remote villages.
  • In April 2025, Booking.com expanded its verified labeling system to prioritize properties with third-party environmental certifications, following the release of its tenth annual sustainability research report.
  • In June 2025, Lufthansa Group entered a partnership with Airbus to decarbonize business travel by using sustainable aviation fuel for all domestic flights taken by Airbus employees within Germany.

Dive into Technavio’s robust research methodology, blending expert interviews, extensive data synthesis, and validated models for unparalleled Sustainable Tourism Market insights. See full methodology.

Market Scope
Page number 293
Base year 2025
Historic period 2020-2024
Forecast period 2026-2030
Growth momentum & CAGR Accelerate at a CAGR of 14%
Market growth 2026-2030 USD 3145.2 billion
Market structure Fragmented
YoY growth 2025-2026(%) 12.5%
Key countries Italy, Spain, Germany, Switzerland, France, UK, US, Canada, Mexico, China, Japan, India, Australia, South Korea, Indonesia, Brazil, Argentina, Peru, South Africa, UAE, Saudi Arabia, Kenya and Egypt
Competitive landscape Leading Companies, Market Positioning of Companies, Competitive Strategies, and Industry Risks

Request Free Sample

Research Analyst Overview

  • The sustainable tourism market is evolving from a niche segment into a core business imperative, driven by a profound shift in consumer ethics and regulatory pressures. The focus is now on tangible, measurable actions such as biodiversity conservation, carbon footprint minimization, and comprehensive waste reduction systems.
  • Forward-thinking organizations are operationalizing nature-positive strategies, moving beyond simple claims to implement robust environmental stewardship programs and verifiable cultural heritage preservation efforts. A key boardroom consideration is the allocation of capital toward authentic community-based tourism models, which have demonstrated an ability to increase guest satisfaction scores by an average of 12% compared to conventional tours.
  • This transition involves deep supply chain decarbonization and investment in renewable energy integration. Success in this landscape depends on a company's ability to prove its commitment through actions like supporting reforestation projects, ensuring ethical wildlife encounters, practicing responsible travel practices, and achieving low-impact travel across its portfolio.

What are the Key Data Covered in this Sustainable Tourism Market Research and Growth Report?

  • What is the expected growth of the Sustainable Tourism Market between 2026 and 2030?

    • USD 3145.2 billion, at a CAGR of 14%

  • What segmentation does the market report cover?

    • The report is segmented by Type (Domestic, and International), Channel (Phone booking, Online booking, and In-person booking), Age Group (26 to 35 years, 36 to 45 years, 15 to 25 years, 46 to 55 years, and 66 to 75 years) and Geography (Europe, North America, APAC, South America, Middle East and Africa)

  • Which regions are analyzed in the report?

    • Europe, North America, APAC, South America and Middle East and Africa

  • What are the key growth drivers and market challenges?

    • Rising consumer demand for authentic and eco conscious travel experiences, Greenwashing and regulatory scrutiny in sustainability claims

  • Who are the major players in the Sustainable Tourism Market?

    • Adventure Alternative Ltd., andBeyond, Aracari Travel, Bouteco Ltd., Byway, Earth Changers, Ecoventura, Exodus Travels Ltd., G Adventures Inc., Intrepid Group Pty Ltd., Kind Traveler PBC, Kynder LLC, Mojosurf, Responsible Travel, Rickshaw Travel Ltd., Steppes Travel Ltd., The Blue Yonder, Undiscovered Mountains Ltd., Wild Frontiers Travel Ltd. and Wilderness Safaris

Market Research Insights

  • The sustainable tourism market is shaped by a dynamic interplay of consumer demand and technological enablement. The shift toward sustainable travel certifications is gaining momentum, with operators that achieve recognized green hotel standards reporting an average energy consumption reduction of over 20%.
  • Concurrently, implementing rigorous sustainable supply chain auditing has improved regulatory compliance rates by nearly 40% for leading firms, reinforcing the business case for ethical tourism experiences. The adoption of sustainable travel technology allows for enhanced personalization, with platforms offering socially responsible itineraries seeing higher customer retention.
  • This landscape rewards companies that effectively manage overtourism mitigation strategies and foster authentic cultural immersion programs, turning sustainability from a cost center into a competitive advantage.

We can help! Our analysts can customize this sustainable tourism market research report to meet your requirements.

Get in touch

1. Executive Summary

1.1 Market overview

Executive Summary - Chart on Market Overview
Executive Summary - Data Table on Market Overview
Executive Summary - Chart on Global Market Characteristics
Executive Summary - Chart on Market by Geography
Executive Summary - Chart on Market Segmentation by Type
Executive Summary - Chart on Market Segmentation by Channel
Executive Summary - Chart on Market Segmentation by Age Group
Executive Summary - Chart on Incremental Growth
Executive Summary - Data Table on Incremental Growth
Executive Summary - Chart on Company Market Positioning

2. Technavio Analysis

2.1 Analysis of price sensitivity, lifecycle, customer purchase basket, adoption rates, and purchase criteria

2.2 Criticality of inputs and Factors of differentiation

Chart on Overview on criticality of inputs and factors of differentiation

2.3 Factors of disruption

Chart on Overview on factors of disruption

2.4 Impact of drivers and challenges

Chart on Impact of drivers and challenges in 2025 and 2030

3. Market Landscape

3.1 Market ecosystem

Chart on Parent Market
Data Table on - Parent Market

3.2 Market characteristics

Chart on Market characteristics analysis

3.3 Value chain analysis

Chart on Value chain analysis

4. Market Sizing

4.1 Market definition

Data Table on Offerings of companies included in the market definition

4.2 Market segment analysis

Market segments

4.3 Market size 2025

4.4 Market outlook: Forecast for 2025-2030

Chart on Global - Market size and forecast 2025-2030 ($ billion)
Data Table on Global - Market size and forecast 2025-2030 ($ billion)
Chart on Global Market: Year-over-year growth 2025-2030 (%)
Data Table on Global Market: Year-over-year growth 2025-2030 (%)

5. Historic Market Size

5.1 Global Sustainable Tourism Market 2020 - 2024

Historic Market Size - Data Table on Global Sustainable Tourism Market 2020 - 2024 ($ billion)

5.2 Type segment analysis 2020 - 2024

Historic Market Size - Type Segment 2020 - 2024 ($ billion)

5.3 Channel segment analysis 2020 - 2024

Historic Market Size - Channel Segment 2020 - 2024 ($ billion)

5.4 Age Group segment analysis 2020 - 2024

Historic Market Size - Age Group Segment 2020 - 2024 ($ billion)

5.5 Geography segment analysis 2020 - 2024

Historic Market Size - Geography Segment 2020 - 2024 ($ billion)

5.6 Country segment analysis 2020 - 2024

Historic Market Size - Country Segment 2020 - 2024 ($ billion)

6. Qualitative Analysis

6.1 Impact of AI on the Global Sustainable Tourism Market

7. Five Forces Analysis

7.1 Five forces summary

Five forces analysis - Comparison between 2025 and 2030

7.2 Bargaining power of buyers

Bargaining power of buyers - Impact of key factors 2025 and 2030

7.3 Bargaining power of suppliers

Bargaining power of suppliers - Impact of key factors in 2025 and 2030

7.4 Threat of new entrants

Threat of new entrants - Impact of key factors in 2025 and 2030

7.5 Threat of substitutes

Threat of substitutes - Impact of key factors in 2025 and 2030

7.6 Threat of rivalry

Threat of rivalry - Impact of key factors in 2025 and 2030

7.7 Market condition

Chart on Market condition - Five forces 2025 and 2030

8. Market Segmentation by Type

8.1 Market segments

Chart on Type - Market share 2025-2030 (%)
Data Table on Type - Market share 2025-2030 (%)

8.2 Comparison by Type

Chart on Comparison by Type
Data Table on Comparison by Type

8.3 Domestic - Market size and forecast 2025-2030

Chart on Domestic - Market size and forecast 2025-2030 ($ billion)
Data Table on Domestic - Market size and forecast 2025-2030 ($ billion)
Chart on Domestic - Year-over-year growth 2025-2030 (%)
Data Table on Domestic - Year-over-year growth 2025-2030 (%)

8.4 International - Market size and forecast 2025-2030

Chart on International - Market size and forecast 2025-2030 ($ billion)
Data Table on International - Market size and forecast 2025-2030 ($ billion)
Chart on International - Year-over-year growth 2025-2030 (%)
Data Table on International - Year-over-year growth 2025-2030 (%)

8.5 Market opportunity by Type

Market opportunity by Type ($ billion)
Data Table on Market opportunity by Type ($ billion)

9. Market Segmentation by Channel

9.1 Market segments

Chart on Channel - Market share 2025-2030 (%)
Data Table on Channel - Market share 2025-2030 (%)

9.2 Comparison by Channel

Chart on Comparison by Channel
Data Table on Comparison by Channel

9.3 Phone booking - Market size and forecast 2025-2030

Chart on Phone booking - Market size and forecast 2025-2030 ($ billion)
Data Table on Phone booking - Market size and forecast 2025-2030 ($ billion)
Chart on Phone booking - Year-over-year growth 2025-2030 (%)
Data Table on Phone booking - Year-over-year growth 2025-2030 (%)

9.4 Online booking - Market size and forecast 2025-2030

Chart on Online booking - Market size and forecast 2025-2030 ($ billion)
Data Table on Online booking - Market size and forecast 2025-2030 ($ billion)
Chart on Online booking - Year-over-year growth 2025-2030 (%)
Data Table on Online booking - Year-over-year growth 2025-2030 (%)

9.5 In-person booking - Market size and forecast 2025-2030

Chart on In-person booking - Market size and forecast 2025-2030 ($ billion)
Data Table on In-person booking - Market size and forecast 2025-2030 ($ billion)
Chart on In-person booking - Year-over-year growth 2025-2030 (%)
Data Table on In-person booking - Year-over-year growth 2025-2030 (%)

9.6 Market opportunity by Channel

Market opportunity by Channel ($ billion)
Data Table on Market opportunity by Channel ($ billion)

10. Market Segmentation by Age Group

10.1 Market segments

Chart on Age Group - Market share 2025-2030 (%)
Data Table on Age Group - Market share 2025-2030 (%)

10.2 Comparison by Age Group

Chart on Comparison by Age Group
Data Table on Comparison by Age Group

10.3 26 to 35 years - Market size and forecast 2025-2030

Chart on 26 to 35 years - Market size and forecast 2025-2030 ($ billion)
Data Table on 26 to 35 years - Market size and forecast 2025-2030 ($ billion)
Chart on 26 to 35 years - Year-over-year growth 2025-2030 (%)
Data Table on 26 to 35 years - Year-over-year growth 2025-2030 (%)

10.4 36 to 45 years - Market size and forecast 2025-2030

Chart on 36 to 45 years - Market size and forecast 2025-2030 ($ billion)
Data Table on 36 to 45 years - Market size and forecast 2025-2030 ($ billion)
Chart on 36 to 45 years - Year-over-year growth 2025-2030 (%)
Data Table on 36 to 45 years - Year-over-year growth 2025-2030 (%)

10.5 15 to 25 years - Market size and forecast 2025-2030

Chart on 15 to 25 years - Market size and forecast 2025-2030 ($ billion)
Data Table on 15 to 25 years - Market size and forecast 2025-2030 ($ billion)
Chart on 15 to 25 years - Year-over-year growth 2025-2030 (%)
Data Table on 15 to 25 years - Year-over-year growth 2025-2030 (%)

10.6 46 to 55 years - Market size and forecast 2025-2030

Chart on 46 to 55 years - Market size and forecast 2025-2030 ($ billion)
Data Table on 46 to 55 years - Market size and forecast 2025-2030 ($ billion)
Chart on 46 to 55 years - Year-over-year growth 2025-2030 (%)
Data Table on 46 to 55 years - Year-over-year growth 2025-2030 (%)

10.7 66 to 75 years - Market size and forecast 2025-2030

Chart on 66 to 75 years - Market size and forecast 2025-2030 ($ billion)
Data Table on 66 to 75 years - Market size and forecast 2025-2030 ($ billion)
Chart on 66 to 75 years - Year-over-year growth 2025-2030 (%)
Data Table on 66 to 75 years - Year-over-year growth 2025-2030 (%)

10.8 Market opportunity by Age Group

Market opportunity by Age Group ($ billion)
Data Table on Market opportunity by Age Group ($ billion)

11. Customer Landscape

11.1 Customer landscape overview

Analysis of price sensitivity, lifecycle, customer purchase basket, adoption rates, and purchase criteria

12. Geographic Landscape

12.1 Geographic segmentation

Chart on Market share by geography 2025-2030 (%)
Data Table on Market share by geography 2025-2030 (%)

12.2 Geographic comparison

Chart on Geographic comparison
Data Table on Geographic comparison

12.3 Europe - Market size and forecast 2025-2030

Chart on Europe - Market size and forecast 2025-2030 ($ billion)
Data Table on Europe - Market size and forecast 2025-2030 ($ billion)
Chart on Europe - Year-over-year growth 2025-2030 (%)
Data Table on Europe - Year-over-year growth 2025-2030 (%)
Chart on Regional Comparison - Europe
Data Table on Regional Comparison - Europe

12.3.1 Italy - Market size and forecast 2025-2030

Chart on Italy - Market size and forecast 2025-2030 ($ billion)
Data Table on Italy - Market size and forecast 2025-2030 ($ billion)
Chart on Italy - Year-over-year growth 2025-2030 (%)
Data Table on Italy - Year-over-year growth 2025-2030 (%)

12.3.2 Spain - Market size and forecast 2025-2030

Chart on Spain - Market size and forecast 2025-2030 ($ billion)
Data Table on Spain - Market size and forecast 2025-2030 ($ billion)
Chart on Spain - Year-over-year growth 2025-2030 (%)
Data Table on Spain - Year-over-year growth 2025-2030 (%)

12.3.3 Germany - Market size and forecast 2025-2030

Chart on Germany - Market size and forecast 2025-2030 ($ billion)
Data Table on Germany - Market size and forecast 2025-2030 ($ billion)
Chart on Germany - Year-over-year growth 2025-2030 (%)
Data Table on Germany - Year-over-year growth 2025-2030 (%)

12.3.4 Switzerland - Market size and forecast 2025-2030

Chart on Switzerland - Market size and forecast 2025-2030 ($ billion)
Data Table on Switzerland - Market size and forecast 2025-2030 ($ billion)
Chart on Switzerland - Year-over-year growth 2025-2030 (%)
Data Table on Switzerland - Year-over-year growth 2025-2030 (%)

12.3.5 France - Market size and forecast 2025-2030

Chart on France - Market size and forecast 2025-2030 ($ billion)
Data Table on France - Market size and forecast 2025-2030 ($ billion)
Chart on France - Year-over-year growth 2025-2030 (%)
Data Table on France - Year-over-year growth 2025-2030 (%)

12.3.6 UK - Market size and forecast 2025-2030

Chart on UK - Market size and forecast 2025-2030 ($ billion)
Data Table on UK - Market size and forecast 2025-2030 ($ billion)
Chart on UK - Year-over-year growth 2025-2030 (%)
Data Table on UK - Year-over-year growth 2025-2030 (%)

12.4 North America - Market size and forecast 2025-2030

Chart on North America - Market size and forecast 2025-2030 ($ billion)
Data Table on North America - Market size and forecast 2025-2030 ($ billion)
Chart on North America - Year-over-year growth 2025-2030 (%)
Data Table on North America - Year-over-year growth 2025-2030 (%)
Chart on Regional Comparison - North America
Data Table on Regional Comparison - North America

12.4.1 US - Market size and forecast 2025-2030

Chart on US - Market size and forecast 2025-2030 ($ billion)
Data Table on US - Market size and forecast 2025-2030 ($ billion)
Chart on US - Year-over-year growth 2025-2030 (%)
Data Table on US - Year-over-year growth 2025-2030 (%)

12.4.2 Canada - Market size and forecast 2025-2030

Chart on Canada - Market size and forecast 2025-2030 ($ billion)
Data Table on Canada - Market size and forecast 2025-2030 ($ billion)
Chart on Canada - Year-over-year growth 2025-2030 (%)
Data Table on Canada - Year-over-year growth 2025-2030 (%)

12.4.3 Mexico - Market size and forecast 2025-2030

Chart on Mexico - Market size and forecast 2025-2030 ($ billion)
Data Table on Mexico - Market size and forecast 2025-2030 ($ billion)
Chart on Mexico - Year-over-year growth 2025-2030 (%)
Data Table on Mexico - Year-over-year growth 2025-2030 (%)

12.5 APAC - Market size and forecast 2025-2030

Chart on APAC - Market size and forecast 2025-2030 ($ billion)
Data Table on APAC - Market size and forecast 2025-2030 ($ billion)
Chart on APAC - Year-over-year growth 2025-2030 (%)
Data Table on APAC - Year-over-year growth 2025-2030 (%)
Chart on Regional Comparison - APAC
Data Table on Regional Comparison - APAC

12.5.1 China - Market size and forecast 2025-2030

Chart on China - Market size and forecast 2025-2030 ($ billion)
Data Table on China - Market size and forecast 2025-2030 ($ billion)
Chart on China - Year-over-year growth 2025-2030 (%)
Data Table on China - Year-over-year growth 2025-2030 (%)

12.5.2 Japan - Market size and forecast 2025-2030

Chart on Japan - Market size and forecast 2025-2030 ($ billion)
Data Table on Japan - Market size and forecast 2025-2030 ($ billion)
Chart on Japan - Year-over-year growth 2025-2030 (%)
Data Table on Japan - Year-over-year growth 2025-2030 (%)

12.5.3 India - Market size and forecast 2025-2030

Chart on India - Market size and forecast 2025-2030 ($ billion)
Data Table on India - Market size and forecast 2025-2030 ($ billion)
Chart on India - Year-over-year growth 2025-2030 (%)
Data Table on India - Year-over-year growth 2025-2030 (%)

12.5.4 Australia - Market size and forecast 2025-2030

Chart on Australia - Market size and forecast 2025-2030 ($ billion)
Data Table on Australia - Market size and forecast 2025-2030 ($ billion)
Chart on Australia - Year-over-year growth 2025-2030 (%)
Data Table on Australia - Year-over-year growth 2025-2030 (%)

12.5.5 South Korea - Market size and forecast 2025-2030

Chart on South Korea - Market size and forecast 2025-2030 ($ billion)
Data Table on South Korea - Market size and forecast 2025-2030 ($ billion)
Chart on South Korea - Year-over-year growth 2025-2030 (%)
Data Table on South Korea - Year-over-year growth 2025-2030 (%)

12.5.6 Indonesia - Market size and forecast 2025-2030

Chart on Indonesia - Market size and forecast 2025-2030 ($ billion)
Data Table on Indonesia - Market size and forecast 2025-2030 ($ billion)
Chart on Indonesia - Year-over-year growth 2025-2030 (%)
Data Table on Indonesia - Year-over-year growth 2025-2030 (%)

12.6 South America - Market size and forecast 2025-2030

Chart on South America - Market size and forecast 2025-2030 ($ billion)
Data Table on South America - Market size and forecast 2025-2030 ($ billion)
Chart on South America - Year-over-year growth 2025-2030 (%)
Data Table on South America - Year-over-year growth 2025-2030 (%)
Chart on Regional Comparison - South America
Data Table on Regional Comparison - South America

12.6.1 Brazil - Market size and forecast 2025-2030

Chart on Brazil - Market size and forecast 2025-2030 ($ billion)
Data Table on Brazil - Market size and forecast 2025-2030 ($ billion)
Chart on Brazil - Year-over-year growth 2025-2030 (%)
Data Table on Brazil - Year-over-year growth 2025-2030 (%)

12.6.2 Argentina - Market size and forecast 2025-2030

Chart on Argentina - Market size and forecast 2025-2030 ($ billion)
Data Table on Argentina - Market size and forecast 2025-2030 ($ billion)
Chart on Argentina - Year-over-year growth 2025-2030 (%)
Data Table on Argentina - Year-over-year growth 2025-2030 (%)

12.6.3 Peru - Market size and forecast 2025-2030

Chart on Peru - Market size and forecast 2025-2030 ($ billion)
Data Table on Peru - Market size and forecast 2025-2030 ($ billion)
Chart on Peru - Year-over-year growth 2025-2030 (%)
Data Table on Peru - Year-over-year growth 2025-2030 (%)

12.7 Middle East and Africa - Market size and forecast 2025-2030

Chart on Middle East and Africa - Market size and forecast 2025-2030 ($ billion)
Data Table on Middle East and Africa - Market size and forecast 2025-2030 ($ billion)
Chart on Middle East and Africa - Year-over-year growth 2025-2030 (%)
Data Table on Middle East and Africa - Year-over-year growth 2025-2030 (%)
Chart on Regional Comparison - Middle East and Africa
Data Table on Regional Comparison - Middle East and Africa

12.7.1 South Africa - Market size and forecast 2025-2030

Chart on South Africa - Market size and forecast 2025-2030 ($ billion)
Data Table on South Africa - Market size and forecast 2025-2030 ($ billion)
Chart on South Africa - Year-over-year growth 2025-2030 (%)
Data Table on South Africa - Year-over-year growth 2025-2030 (%)

12.7.2 UAE - Market size and forecast 2025-2030

Chart on UAE - Market size and forecast 2025-2030 ($ billion)
Data Table on UAE - Market size and forecast 2025-2030 ($ billion)
Chart on UAE - Year-over-year growth 2025-2030 (%)
Data Table on UAE - Year-over-year growth 2025-2030 (%)

12.7.3 Saudi Arabia - Market size and forecast 2025-2030

Chart on Saudi Arabia - Market size and forecast 2025-2030 ($ billion)
Data Table on Saudi Arabia - Market size and forecast 2025-2030 ($ billion)
Chart on Saudi Arabia - Year-over-year growth 2025-2030 (%)
Data Table on Saudi Arabia - Year-over-year growth 2025-2030 (%)

12.7.4 Kenya - Market size and forecast 2025-2030

Chart on Kenya - Market size and forecast 2025-2030 ($ billion)
Data Table on Kenya - Market size and forecast 2025-2030 ($ billion)
Chart on Kenya - Year-over-year growth 2025-2030 (%)
Data Table on Kenya - Year-over-year growth 2025-2030 (%)

12.7.5 Egypt - Market size and forecast 2025-2030

Chart on Egypt - Market size and forecast 2025-2030 ($ billion)
Data Table on Egypt - Market size and forecast 2025-2030 ($ billion)
Chart on Egypt - Year-over-year growth 2025-2030 (%)
Data Table on Egypt - Year-over-year growth 2025-2030 (%)

12.8 Market opportunity by geography

Market opportunity by geography ($ billion)
Data Tables on Market opportunity by geography ($ billion)

13. Drivers, Challenges, and Opportunity

13.1 Market drivers

Rising consumer demand for authentic and eco conscious travel experiences
Corporate commitments to decarbonization and sustainable aviation fuel adoption
Technological innovation in supply chain sustainability and measurement

13.2 Market challenges

Greenwashing and regulatory scrutiny in sustainability claims
High operational costs and supply chain decarbonization barriers
Over tourism and destination capacity management

13.3 Impact of drivers and challenges

Impact of drivers and challenges in 2025 and 2030

13.4 Market opportunities

Integration of indigenous culture and community led tourism models
AI and data analytics for sustainable travel management
Regenerative tourism and corporate policy advocacy

14. Competitive Landscape

14.1 Overview

14.2

Overview on criticality of inputs and factors of differentiation

14.3 Landscape disruption

Overview on factors of disruption

14.4 Industry risks

Impact of key risks on business

15. Competitive Analysis

15.1 Companies profiled

Companies covered

15.2 Company ranking index

15.3 Market positioning of companies

Matrix on companies position and classification

15.4 Adventure Alternative Ltd.

Adventure Alternative Ltd. - Overview
Adventure Alternative Ltd. - Product / Service
Adventure Alternative Ltd. - Key offerings
SWOT

15.5 andBeyond

andBeyond - Overview
andBeyond - Product / Service
andBeyond - Key offerings
SWOT

15.6 Aracari Travel

Aracari Travel - Overview
Aracari Travel - Product / Service
Aracari Travel - Key offerings
SWOT

15.7 Bouteco Ltd.

Bouteco Ltd. - Overview
Bouteco Ltd. - Product / Service
Bouteco Ltd. - Key offerings
SWOT

15.8 Earth Changers

Earth Changers - Overview
Earth Changers - Product / Service
Earth Changers - Key offerings
SWOT

15.9 Ecoventura

Ecoventura - Overview
Ecoventura - Product / Service
Ecoventura - Key offerings
SWOT

15.10 G Adventures Inc.

G Adventures Inc. - Overview
G Adventures Inc. - Product / Service
G Adventures Inc. - Key offerings
SWOT

15.11 Intrepid Group Pty Ltd.

Intrepid Group Pty Ltd. - Overview
Intrepid Group Pty Ltd. - Product / Service
Intrepid Group Pty Ltd. - Key offerings
SWOT

15.12 Kind Traveler PBC

Kind Traveler PBC - Overview
Kind Traveler PBC - Product / Service
Kind Traveler PBC - Key offerings
SWOT

15.13 Kynder LLC

Kynder LLC - Overview
Kynder LLC - Product / Service
Kynder LLC - Key offerings
SWOT

15.14 Mojosurf

Mojosurf - Overview
Mojosurf - Product / Service
Mojosurf - Key offerings
SWOT

15.15 Responsible Travel

Responsible Travel - Overview
Responsible Travel - Product / Service
Responsible Travel - Key offerings
SWOT

15.16 Rickshaw Travel Ltd.

Rickshaw Travel Ltd. - Overview
Rickshaw Travel Ltd. - Product / Service
Rickshaw Travel Ltd. - Key offerings
SWOT

15.17 Wild Frontiers Travel Ltd.

Wild Frontiers Travel Ltd. - Overview
Wild Frontiers Travel Ltd. - Product / Service
Wild Frontiers Travel Ltd. - Key offerings
SWOT

15.18 Wilderness Safaris

Wilderness Safaris - Overview
Wilderness Safaris - Product / Service
Wilderness Safaris - Key offerings
SWOT

16. Appendix

16.1 Scope of the report

Market definition
Objectives
Notes and caveats

16.2 Inclusions and exclusions checklist

Inclusions checklist
Exclusions checklist

16.3 Currency conversion rates for US$

16.4 Research methodology

16.5 Data procurement

Information sources

16.6 Data validation

16.7 Validation techniques employed for market sizing

16.8 Data synthesis

16.9 360 degree market analysis

16.10 List of abbreviations

Research Methodology

Technavio presents a detailed picture of the market by way of study, synthesis, and summation of data from multiple sources. The analysts have presented the various facets of the market with a particular focus on identifying the key industry influencers. The data thus presented is comprehensive, reliable, and the result of extensive research, both primary and secondary.

INFORMATION SOURCES

Primary sources

  • Manufacturers and suppliers
  • Channel partners
  • Industry experts
  • Strategic decision makers

Secondary sources

  • Industry journals and periodicals
  • Government data
  • Financial reports of key industry players
  • Historical data
  • Press releases

DATA ANALYSIS

Data Synthesis

  • Collation of data
  • Estimation of key figures
  • Analysis of derived insights

Data Validation

  • Triangulation with data models
  • Reference against proprietary databases
  • Corroboration with industry experts

REPORT WRITING

Qualitative

  • Market drivers
  • Market challenges
  • Market trends
  • Five forces analysis

Quantitative

  • Market size and forecast
  • Market segmentation
  • Geographical insights
  • Competitive landscape

Interested in this report?

Get your sample now to see our research methodology and insights!

Download Now

Frequently Asked Questions

Sustainable Tourism market growth will increase by USD 3145.2 billion during 2026-2030.

The Sustainable Tourism market is expected to grow at a CAGR of 14% during 2026-2030.

Sustainable Tourism market is segmented by Type (Domestic, International) Channel (Phone booking, Online booking, In-person booking) Age group (26 to 35 years, 36 to 45 years, 15 to 25 years, 46 to 55 years, 66 to 75 years)

Adventure Alternative Ltd., andBeyond, Aracari Travel, Bouteco Ltd., Byway, Earth Changers, Ecoventura, Exodus Travels Ltd., G Adventures Inc., Intrepid Group Pty Ltd., Kind Traveler PBC, Kynder LLC, Mojosurf, Responsible Travel, Rickshaw Travel Ltd., Steppes Travel Ltd., The Blue Yonder, Undiscovered Mountains Ltd., Wild Frontiers Travel Ltd., Wilderness Safaris are a few of the key vendors in the Sustainable Tourism market.

Europe will register the highest growth rate of 38.9% among the other regions. Therefore, the Sustainable Tourism market in Europe is expected to garner significant business opportunities for the vendors during the forecast period.

Italy, Spain, Germany, Switzerland, France, UK, US, Canada, Mexico, China, Japan, India, Australia, South Korea, Indonesia, Brazil, Argentina, Peru, South Africa, UAE, Saudi Arabia, Kenya, Egypt

  • Rising consumer demand for authentic and eco conscious travel experiences is the driving factor this market.

The Sustainable Tourism market vendors should focus on grabbing business opportunities from the Type segment as it accounted for the largest market share in the base year.