Tea Capsules Market Size 2024-2028
The tea capsules market size is forecast to increase by USD 777.1 million at a CAGR of 8% between 2023 and 2028.
- The market is witnessing significant growth due to several key factors. One of the primary drivers is the increasing awareness of health benefits linked to tea consumption. Tea is known for its numerous health advantages, such as boosting immunity, improving focus, and reducing stress. As a result, consumers are increasingly turning to these capsules as a convenient and effective way to incorporate tea into their daily routine. Material innovations, such as the shift from conventional plastic to bio plastics, further add to the market's dynamism. Another growth factor is companies' focus on new product launches. Companies are introducing innovative tea capsule products to cater to diverse consumer preferences, including organic, flavored, and functional teas. Compliance with food safety regulations and labeling requirements is also a crucial trend In the market. With the growing concern for health and wellness, consumers demand transparency and safety In the products they consume. As a result, companies are investing in obtaining necessary certifications and providing clear labeling to meet consumer expectations.
What will be the Size of the Tea Capsules Market During the Forecast Period?
- The market encompasses the production and distribution of encapsulated tea leaves in various forms, including red, green, oolong, black, and yellow tea capsules. This market exhibits growth, driven by the increasing preference for convenience and portability in tea consumption. Traditional tea drinkers seek the familiarity of their favorite tea types in capsule form, while decaf options cater to those who prefer a caffeine-free alternative. The market spans various channels, including specialty stores, online platforms, convenience stores, and supermarkets. The commercial sector, including offices and foodservice establishments, also represents a significant market for these capsules. Overall, the market continues to evolve, offering consumers a diverse range of options to meet their evolving tea preferences and lifestyles.
How is this Tea Capsules Industry segmented and which is the largest segment?
The tea capsules industry research report provides comprehensive data (region-wise segment analysis), with forecasts and estimates in "USD million" for the period 2024-2028, as well as historical data from 2018-2022 for the following segments.
- Application
- Residential
- Commercial
- Distribution Channel
- Offline
- Online
- Geography
- APAC
- China
- India
- Japan
- North America
- Canada
- US
- Europe
- Germany
- UK
- France
- Italy
- Middle East and Africa
- South America
- APAC
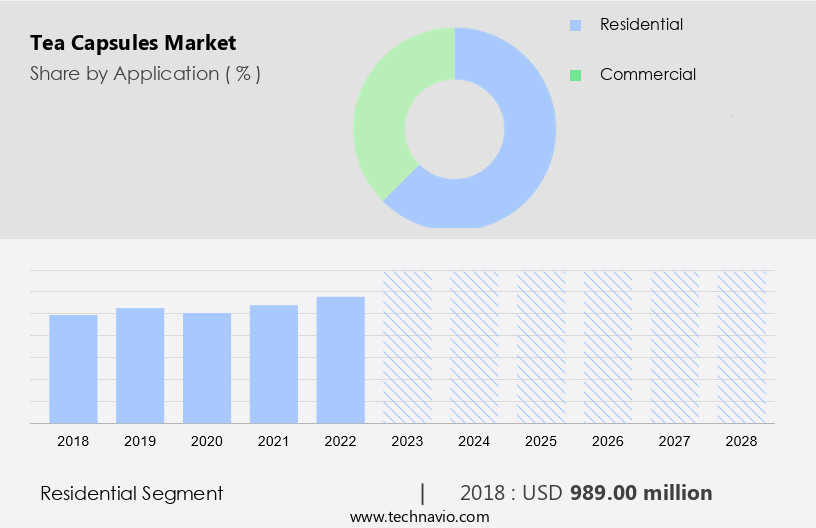
By Application Insights
- The residential segment is estimated to witness significant growth during the forecast period.
The market In the US has witnessed significant growth, particularly In the residential sector. Individual consumers prioritize convenience, quality, and variety In their home tea consumption, making these capsules an attractive option. Tea is the second most popular beverage globally, with over 80% of US households consuming it daily. In 2023, the US saw nearly 86 billion servings of tea, equivalent to around 4 billion gallons. Single-serve brewing systems, such as those provided by Nestle's Nespresso and Keurig, have fueled the adoption of these capsules in households. With the increasing preference for on-the-go and convenient tea options, the market is poised for continued growth.
Tea capsules come in various types, including red tea capsules, green tea capsules, oolong tea capsules, black tea capsules, and yellow tea capsules. The market caters to diverse consumer needs through specialty stores, online stores, convenience stores, health and wellness channels, and e-commerce platforms. The use of eco-friendly packaging, such as bio plastics and fabric, adds to the appeal of these capsules for environmentally conscious consumers. The market also offers decaf, traditional, and ready-to-use tea capsules, catering to various lifestyle changes and cosmetic applications. The market is expected to continue growing, driven by the increasing popularity of tea consumption and the convenience of tea capsules.
Get a glance at the Tea Capsules Industry report of share of various segments Request Free Sample
The residential segment was valued at USD 989.00 million in 2018 and showed a gradual increase during the forecast period.
Regional Analysis
- APAC is estimated to contribute 35% to the growth of the global market during the forecast period.
Technavio's analysts have elaborately explained the regional trends and drivers that shape the market during the forecast period.
For more insights on the market share of various regions, Request Free Sample
The Asia-Pacific region is a major contributor to The market, fueled by the distinctive tea customs and preferences of its key nations. In China, as the world's leading tea producer and consumer, there is a discernible trend toward luxury and inventive tea items, such as tea capsules. In 2023, Chinese tea production amounted to 3.55 million tons, marking a 6.1% rise from the prior year. This expansion is fueled by China's enduring tea-drinking heritage, which is now adopting advanced brewing technologies to provide premium tea experiences with minimal hassle. The burgeoning e-commerce sector in China amplifies the accessibility of assorted tea capsule brands, catering to a wider demographic.
Key tea types include red, green, oolong, black, and yellow tea capsules. The market encompasses various sectors, including specialty stores, online stores, convenience stores, health and wellness, and supermarkets/convenience stores. Sustainable packaging solutions, such as eco-friendly plastics, fabrics, and ready-to-use products, are gaining traction to reduce environmental impact. Lifestyle changes and cosmetic applications are additional growth drivers. The market caters to residential and commercial consumers, offering conventional plastic, bio-plastics, and decaf options. Digital marketing, e-commerce, and
Market Dynamics
Our researchers analyzed the data with 2023 as the base year, along with the key drivers, trends, and challenges. A holistic analysis of drivers will help companies refine their marketing strategies to gain a competitive advantage.
What are the key market drivers leading to the rise In the adoption of Tea Capsules Industry?
Increasing awareness of health benefits associated with tea consumption is the key driver of the market.
- The market experiences growth due to increasing health consciousness among consumers. These capsules come in various types, such as red, green, oolong, black, and yellow. Each type offers distinct health benefits. For example, red tea is rich in antioxidants and may help reduce inflammation and improve heart health. Green capsules are popular for their potential cancer-fighting properties and enhanced cardiovascular health. Oolong capsules contain l-theanine, which can reduce anxiety and support cognitive function. Black capsules, abundant in flavonoids, boost immune function and offer topical relief for minor skin irritations. Yellow capsules are known for their antioxidant properties and potential weight loss benefits. In addition to health advantages, these capsules offer convenience and eco-friendly packaging options. These ready-to-use products cater to residential and commercial consumers. Traditional tea drinkers and those adopting lifestyle changes towards healthier choices are turning to these capsules.
- Specialty, online, and convenience stores, health and wellness services, supermarkets, and even service stations stock these capsules. Coffee capsules have gained popularity, but these capsules are not far behind. Decaf options are also available for those who prefer a caffeine-free experience. The market for these capsules is expanding, with eco-friendly packaging solutions, such as conventional plastic, bio plastics, and fabric, becoming increasingly popular. As consumers become more conscious of their environmental impact, sustainable capsules made from renewable resources are gaining traction. Digital marketing, e-commerce, and lifestyle trends are driving the growth of the market. Consumers can easily purchase these capsules online and have them delivered to their doorstep. With the convenience of ready-to-use products, these capsules are becoming a popular choice for those seeking a quick and healthy beverage option.
What are the market trends shaping the Tea Capsules Industry?
Market players focusing on new product launches is the upcoming market trend.
- The market is experiencing significant growth due to the increasing demand for convenient and diverse tea options. Leading brands are responding to this trend by launching innovative tea capsule products, catering to both tea enthusiasts and health-conscious consumers. For example, on January 3, 2023, The Republic of Tea introduced new additions to its Tea Capsule line, designed for use with Original Nespresso machines. This expansion includes a variety of flavors and blends, reflecting the company's commitment to premium tea offerings. The market is not limited to residential use; commercial applications are also gaining traction. In response, companies are offering eco-friendly packaging options, such as those made from bio plastics, fabric, or sustainable materials, to appeal to consumers seeking environmentally responsible products.
- Additionally, the market extends beyond traditional channels, with ready-to-use products available through specialty stores, online retailers, convenience stores, health and wellness outlets, and e-commerce platforms. Digital marketing and e-commerce have become essential tools for reaching consumers and driving sales in this dynamic market. Overall, the market is poised for continued growth as consumers embrace lifestyle changes and seek out convenient, high-quality tea options.
What challenges does the Tea capsule industry face during its growth?
Compliance with food safety regulations and labeling requirements is a key challenge affecting the industry growth.
- The market faces intricate regulatory hurdles, necessitating adherence to diverse food safety standards, labeling requirements, and environmental regulations. Each jurisdiction sets unique regulations for food and beverage products, subject to frequent modifications. Compliance with these regulations is indispensable for ensuring consumer safety and market access. In the European Union, tea capsule manufacturers must conform to stringent food safety standards as per the EU Regulation (EC) No 178/2002. This regulation mandates the safety of food products, entailing rigorous testing for contaminants and precise labeling of ingredients. Tea capsules, encapsulated tea leaves In the forms of Red, Green, Oolong, Black, and Yellow Tea Capsules, are increasingly popular ready-to-use products In the lifestyle changes sector.
- These capsules are available at specialty stores, online stores, convenience stores, health and wellness centers, supermarkets, and service outlets like Convenience Stores Service and Tea consumption is on the rise, fueled by the convenience and eco-friendly packaging options such as Conventional Plastics, Bio Plastics, and Fabric. Additionally, the market for decaf and sustainable coffee capsules is growing, as consumers seek healthier alternatives. Digital marketing, e-commerce, and strategies are essential for businesses to reach their target audience and remain competitive.
Exclusive Customer Landscape
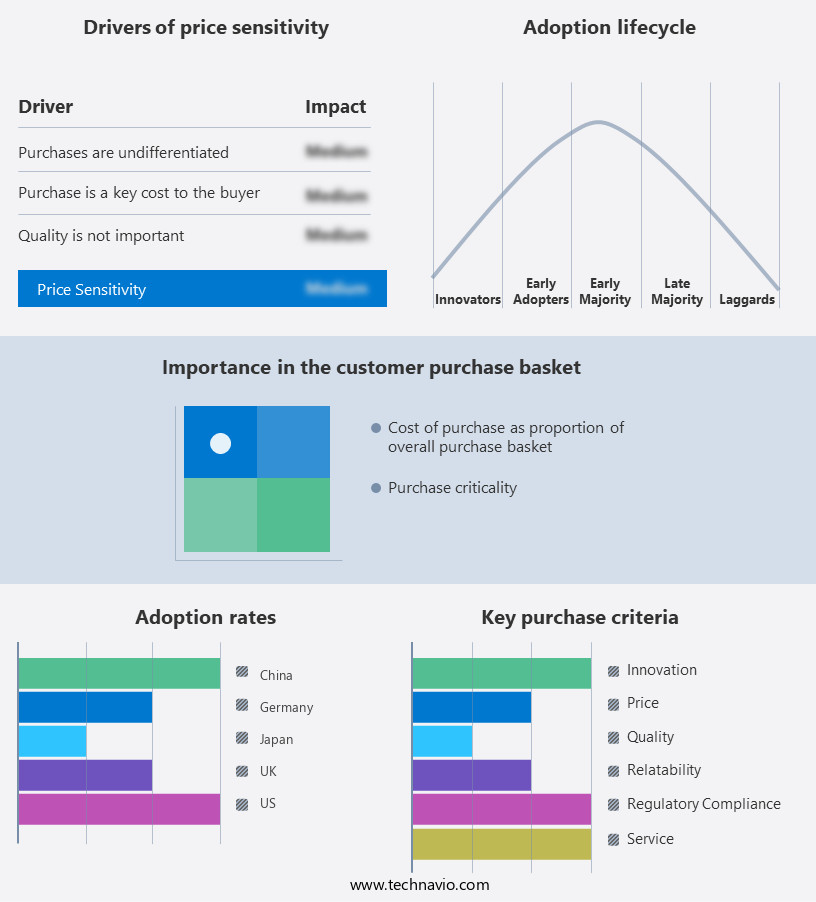
The market forecasting report includes the adoption lifecycle of the market, market growth and forecasting, covering from the innovator's stage to the laggard's stage. It focuses on adoption rates in different regions based on penetration. Furthermore, the market report also includes key purchase criteria and drivers of price sensitivity to help companies evaluate and develop their market growth analysis strategies.
Customer Landscape
Key Companies & Market Insights
Companies are implementing various strategies, such as strategic alliances, tea capsules market forecast, partnerships, mergers and acquisitions, geographical expansion, and product/service launches, to enhance their presence In the industry.
The industry research and growth report includes detailed analyses of the competitive landscape of the market and information about key companies, including:
- AdvaCare Pharma
- Apex International
- Asymmetric Brands LLC
- Arkure Health Care
- Bonhomiaworld
- Ikvans Healthcare
- K.B. & Co.
- LIPTON Teas and Infusions
- Nestle SA
- Numi Inc.
- Panacea Herbals
- Plants Med Laboratories Pvt. Ltd.
- PREPARADOS ALIMENTICIOS SIMAT S.L
- Red Espresso USA
- Rene Coffee Pads Magmar
- Sita Impex
- The Republic of Tea Inc.
- TYMK HEALTH & WELLNESS PVT. LTD.
Qualitative and quantitative analysis of companies has been conducted to help clients understand the wider business environment as well as the strengths and weaknesses of key industry players. Data is qualitatively analyzed to categorize companies as pure play, category-focused, industry-focused, and diversified; it is quantitatively analyzed to categorize companies as dominant, leading, strong, tentative, and weak.
Research Analyst Overview
The market encompasses a range of capsule formats for various types of tea, including red, green, oolong, black, and yellow. These capsules offer consumers the convenience of preparing and consuming tea in a quick and easy manner. The market for tea capsules has seen significant growth in recent years due to several factors. Firstly, the increasing trend towards healthier lifestyle choices has driven demand for tea capsules. Tea is known for its numerous health benefits, such as boosting metabolism, reducing stress, and improving focus. The capsule format allows consumers to easily incorporate tea into their daily routine, making it a popular choice for those looking to make positive lifestyle changes. Another factor contributing to the growth of the market is the increasing preference for ready-to-use products. With busy schedules and hectic lifestyles, consumers are looking for convenient solutions for their daily needs. Tea capsules offer a quick and easy way to prepare and consume tea, making them a popular choice for both residential and commercial consumers. Moreover, the market for tea capsules is also being driven by the growing trend towards sustainability.
Consequently, consumers are increasingly concerned about the environmental impact of their purchases, and are looking for eco-friendly alternatives. Some tea capsule manufacturers are responding to this trend by using sustainable materials, such as bio plastics and fabric, for their packaging. The market is also being influenced by digital marketing and e-commerce. With the rise of online shopping, consumers have greater access to a wider range of tea capsule options than ever before. Digital marketing efforts, such as targeted advertising and social media campaigns, are helping to increase awareness and drive sales In the market. Furthermore, the market for tea capsules is also being influenced by the growth of health and wellness trends. Specialty stores, online retailers, convenience stores, and supermarkets are all offering a wider range of tea capsule options to cater to this trend. Health and wellness-focused digital marketing efforts, such as influencer partnerships and content marketing, are also helping to drive sales In the market.
Thus, the market is expected to continue growing In the coming years, driven by these and other factors. As consumer preferences and trends continue to evolve, it is likely that we will see further innovation and development In the tea capsule market. Thus, the market is experiencing significant growth due to a range of factors, including the trend towards healthier lifestyle choices, the preference for convenience, and the growing trend towards sustainability. The market is also being influenced by digital marketing and e-commerce, as well as the growth of health and wellness trends. With these factors driving demand, the market is expected to continue growing In the coming years.
|
Market Scope |
|
|
Report Coverage |
Details |
|
Page number |
197 |
|
Base year |
2023 |
|
Historic period |
2018-2022 |
|
Forecast period |
2024-2028 |
|
Growth momentum & CAGR |
Accelerate at a CAGR of 8% |
|
Market growth 2024-2028 |
USD 777.1 million |
|
Market structure |
Fragmented |
|
YoY growth 2023-2024(%) |
7.3 |
|
Key countries |
China, Japan, US, UK, Germany, India, France, Canada, Australia, and Italy |
|
Competitive landscape |
Leading Companies, Market Positioning of Companies, Competitive Strategies, and Industry Risks |
What are the Key Data Covered in this Tea Capsules Market Research and Growth Report?
- CAGR of the Tea Capsules industry during the forecast period
- Detailed information on factors that will drive the growth and forecasting between 2024 and 2028
- Precise estimation of the size of the market and its contribution of the industry in focus to the parent market
- Accurate predictions about upcoming growth and trends and changes in consumer behaviour
- Growth of the market across APAC, North America, Europe, Middle East and Africa, and South America
- Thorough analysis of the market's competitive landscape and detailed information about companies
- Comprehensive analysis of factors that will challenge the tea capsules market growth of industry companies
We can help! Our analysts can customize this tea capsules market research report to meet your requirements.


