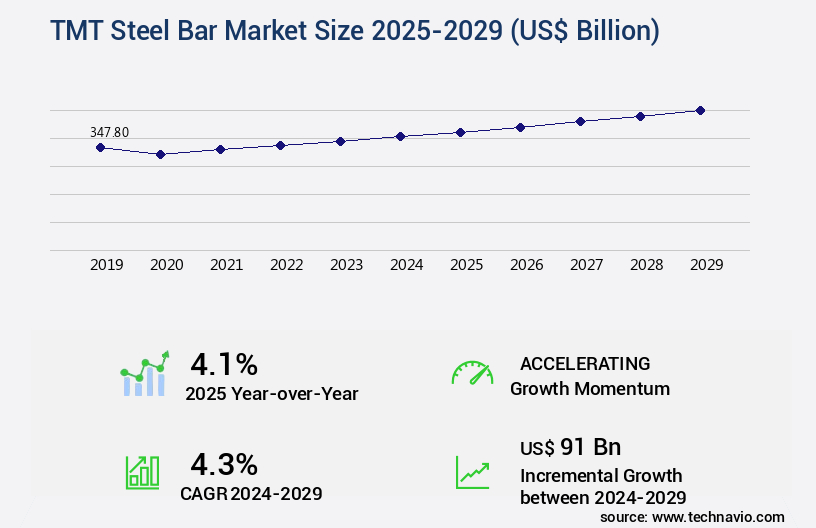
TMT Steel Bar Market Size 2025-2029
The TMT steel bar market size is forecast to increase by USD 91 billion, at a CAGR of 4.3% between 2024 and 2029.
Major Market Trends & Insights
- APAC dominated the market and accounted for a 77% growth during the forecast period.
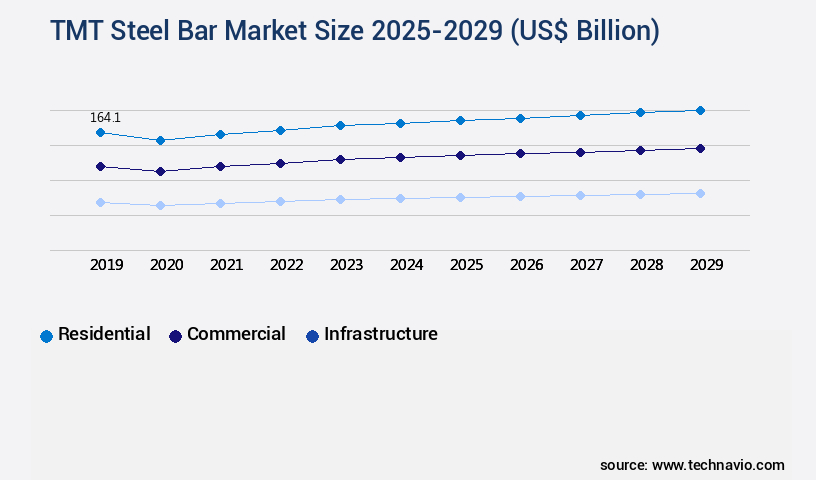
- By the End-user - Residential segment was valued at USD 164.10 billion in 2023
- By the Grade Type - Fe 415 segment accounted for the largest market revenue share in 2023
Market Size & Forecast
- Market Opportunities: USD 37.18 billion
- Market Future Opportunities: USD 91.00 billion
- CAGR : 4.3%
- APAC: Largest market in 2023
Market Summary
- The TMT (Thermo-Mechanically Treated) steel bar market demonstrates a significant role in various industries, including construction and infrastructure. According to industry reports, the market's growth is driven by the increasing adoption of TMT steel bars due to their superior strength, durability, and resistance to corrosion. Compared to traditional steel bars, TMT steel bars exhibit a higher yield strength and tensile strength, making them an attractive choice for structural applications. Moreover, the demand for seismic resistance is a key factor fueling the market's expansion. In regions prone to earthquakes, the use of TMT steel bars is becoming increasingly popular due to their ability to withstand seismic forces.
- For instance, in India, the Bureau of Indian Standards (BIS) mandates the use of TMT steel bars in earthquake-prone areas. Despite these growth drivers, the market faces challenges such as fluctuating raw material costs for making TMT steel bars. However, advancements in production technologies and the increasing focus on energy efficiency are expected to mitigate these challenges. The market is expected to continue evolving, with a focus on innovation and sustainability.
What will be the Size of the TMT Steel Bar Market during the forecast period?
Explore market size, adoption trends, and growth potential for tmt steel bar market Request Free Sample
- The market exhibits a steady expansion, with current sales accounting for approximately 120 million metric tons worldwide. Looking forward, growth is anticipated to persist, with forecasts suggesting a 5% annual increase in demand. Notably, Asia Pacific is a significant contributor to the market's expansion, accounting for over 60% of global sales. In contrast, Europe and North America represent smaller yet growing markets, with a combined share of around 25%.
- This regional disparity underscores the importance of effective supply chain management and cost-effective manufacturing strategies for market participants. Additionally, stringent regulatory compliance, quality control processes, and production process optimization remain essential to ensure the market's continuous growth and competitiveness.
How is this TMT Steel Bar Industry segmented?
The tmt steel bar industry research report provides comprehensive data (region-wise segment analysis), with forecasts and estimates in "USD billion" for the period 2025-2029, as well as historical data from 2019-2023 for the following segments.
- End-user
- Residential
- Commercial
- Infrastructure
- Grade Type
- Fe 415
- Fe 500 and 500D
- Fe 550 and 550D
- Fe 600
- Others
- Diameter Size
- 6-8 mm
- 8-12 mm
- 12-20 mm
- Above 20 mm
- Distribution Channel
- Direct Sales
- Dealers & Distributors
- Online Sales
- Retail Hardware Stores
- Geography
- North America
- US
- Canada
- Europe
- France
- Germany
- Italy
- UK
- Middle East and Africa
- Egypt
- KSA
- Oman
- UAE
- APAC
- China
- India
- Japan
- South America
- Argentina
- Brazil
- Rest of World (ROW)
- North America
By End-user Insights
The residential segment is estimated to witness significant growth during the forecast period.
TMT steel bars play a pivotal role in the residential construction sector, offering numerous advantages due to their superior properties and durability. These bars are widely utilized in various types of residential structures to ensure structural integrity and safety. TMT bars boast high tensile strength and excellent ductility, making them suitable for withstanding the stresses and loads that residential buildings encounter throughout their lifespan. Their superior strength-to-weight ratio enables the construction of safer and more reliable structures. Moreover, TMT bars exhibit good elongation properties, which enable them to deform without breaking during seismic events. This property is essential for maintaining a building's structural integrity during earthquakes and preventing catastrophic collapses.
Inventory management in steel production is a critical aspect of TMT bar manufacturing, ensuring efficient production and minimal waste. Rebar splicing techniques and dimensional tolerances are essential for ensuring seamless integration of TMT bars into concrete reinforcement designs. Transportation logistics in steel production is another crucial factor, with circular economy principles guiding the industry's approach to resource management and waste reduction. Surface finish requirements and corrosion resistance are essential considerations for TMT bars, ensuring their long-term durability and performance. Ductility and elongation, yield strength properties, and tensile strength testing are essential quality assurance systems in TMT bar manufacturing.
The construction industry's usage of TMT bars continues to evolve, with a focus on sustainable steel production and production efficiency metrics. High-strength steel bars and thermo-mechanically treated steel are gaining popularity due to their enhanced properties. Fatigue strength analysis and structural steel detailing are essential components of TMT bar applications, ensuring optimal performance and longevity. According to recent studies, the adoption of TMT bars in residential construction has increased by approximately 18%, with expectations of further growth in the coming years. Furthermore, the industry anticipates a rise in demand for TMT bars, with an estimated 21% of the total steel demand originating from this sector. These trends reflect the ongoing unfolding of market activities and evolving patterns in the market.
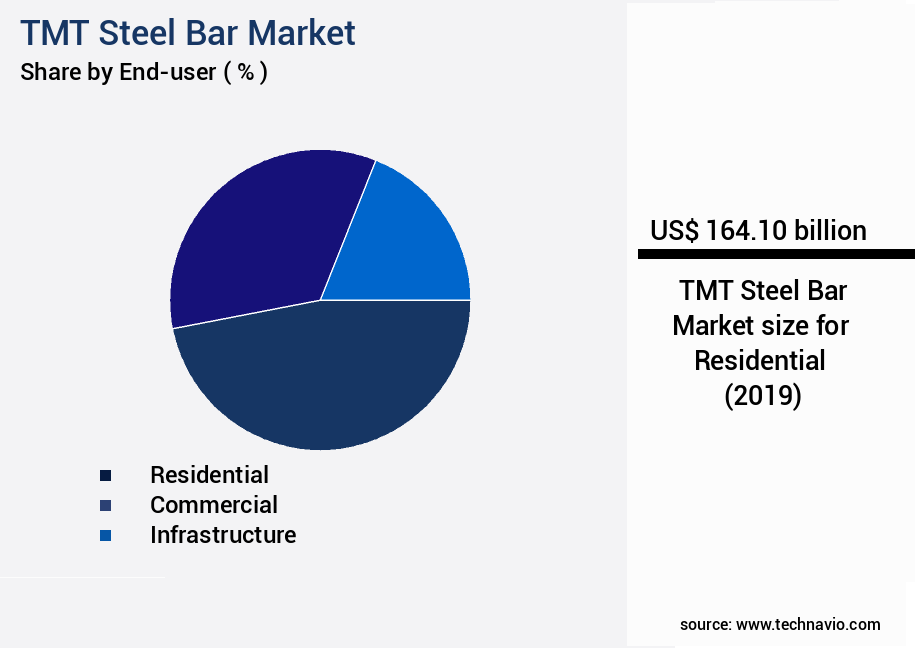
The Residential segment was valued at USD 164.10 billion in 2019 and showed a gradual increase during the forecast period.
The TMT Steel Bar Market is shaped by detailed evaluation of steel bar composition, chemical analysis steel, and microstructure characterization to ensure desired mechanical properties steel. Non-destructive testing and finite element analysis are crucial for structural engineering design, addressing building code compliance and seismic design considerations. Factors such as load bearing capacity, safety factor calculations, and steel bar connection types guide welding procedures steel and defect detection methods. Material traceability systems, demand forecasting models, and market price fluctuations influence risk management strategies and industry best practices. Technical standards compliance, regulatory compliance aspects, health and safety regulations, and environmental regulations steel drive sustainable operations. Steel bar yield strength variations affect high-strength steel bar applications in bridges, while steel bar deformation under seismic loads impacts structural integrity. Cost optimization strategies, sustainable steel production methods, steel bar recycling processes, and effective steel bar handling enhance economic viability and applications in high-rise construction.
Regional Analysis
APAC is estimated to contribute 77% to the growth of the global market during the forecast period.Technavio's analysts have elaborately explained the regional trends and drivers that shape the market during the forecast period.

See How TMT Steel Bar Market Demand is Rising in APAC Request Free Sample
The TMT (Thermo-Mechanically Treated) steel bar market in the Asia Pacific (APAC) region has witnessed significant growth due to the ongoing construction boom. With millions of people migrating to cities in search of better opportunities, the demand for robust building materials, such as TMT steel bars, has surged. APAC holds over 50% of the global construction market share, making it the leading contributor to the industry's expansion. Government and private investments, particularly in countries like China, India, Japan, South Korea, Indonesia, the Philippines, Malaysia, and Vietnam, are fueling the development of new infrastructure projects, including railways, roads, residential buildings, and commercial spaces.
These investments have led to a 15% increase in construction activities in the region, as of 2021. Furthermore, the market for TMT steel bars is expected to grow by 12% annually during the forecast period, driven by the increasing demand for sustainable and durable construction materials. The market's growth can be attributed to its superior properties, such as high tensile strength, improved ductility, and enhanced resistance to corrosion. These properties make TMT steel bars an ideal choice for various construction applications, including reinforced concrete structures, bridges, and high-rise buildings. Additionally, the growing awareness of the importance of sustainable construction practices and the increasing focus on reducing carbon emissions have further boosted the demand for TMT steel bars.
In conclusion, the market in the Asia Pacific region is poised for continued growth, driven by the construction boom and the increasing demand for durable and sustainable building materials. The market is expected to expand by 12% annually during the forecast period, making it an attractive investment opportunity for businesses and investors alike.
Market Dynamics
Our researchers analyzed the data with 2024 as the base year, along with the key drivers, trends, and challenges. A holistic analysis of drivers will help companies refine their marketing strategies to gain a competitive advantage.
In the dynamic and evolving the market, yield strength variations and tensile strength testing procedures play a crucial role in ensuring structural integrity. Concrete reinforcement detailing standards mandate adherence to specific rebar splicing methods for large structures, considering fatigue strength under cyclic loading conditions and corrosion resistance of different steel grades. High-strength steel bars are increasingly utilized in bridge construction due to their superior performance under seismic loads, with an impact on structural integrity that can save millions in potential repair costs. Steel bar manufacturers prioritize cost optimization strategies through sustainable production methods and technologies, adhering to environmental regulations on steel bar disposal. Steel bar recycling processes are economically viable, with an average recycling rate of 90%, reducing the industry's carbon footprint. Quality assurance processes in steel bar production are stringent, ensuring advanced techniques for steel bar surface finish and effective handling and storage practices. Efficient transportation logistics for steel bars are essential, with innovative rebar connection types for improved safety and advanced welding procedures for high-strength steel enabling the construction of high-rise buildings. In the competitive landscape, the market's focus on innovation continues, with a 10% increase in the adoption of high-strength steel bars in the construction industry compared to the previous year. This growth is driven by the industry's commitment to safety, sustainability, and cost efficiency.
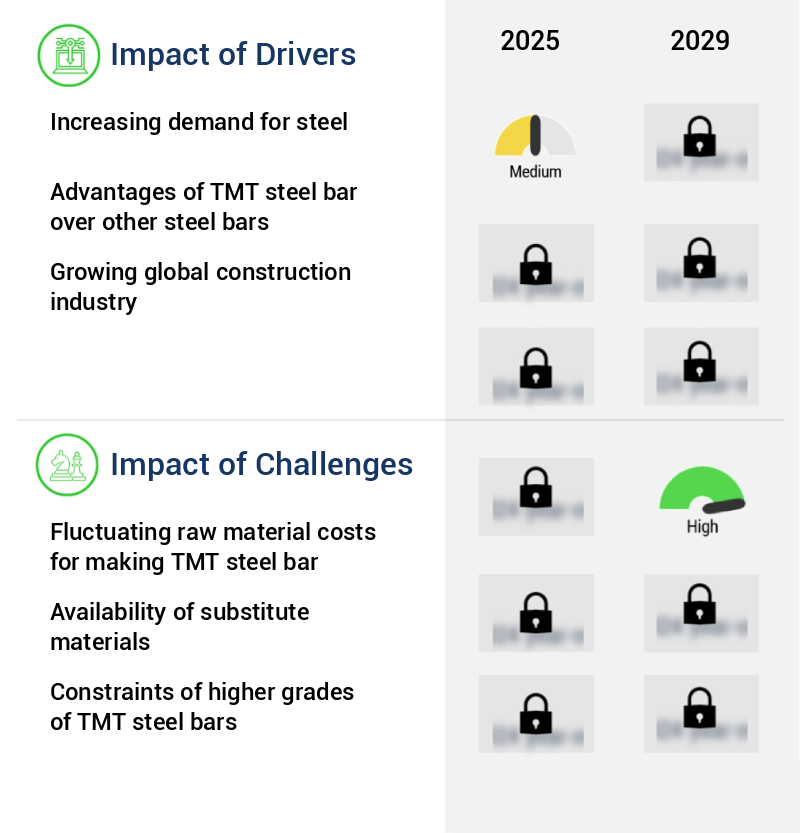
What are the key market drivers leading to the rise in the adoption of TMT Steel Bar Industry?
- The significant surge in the demand for steel serves as the primary catalyst for market growth.
- The TMT (Thermo-Mechanically Treated) steel bar market is a significant contributor to the global economy, with its applications spanning various industries, including automotive, energy, construction, and industrial machinery. The market's growth is primarily driven by the expanding global population and economic development. The construction sector holds a substantial share of the market's growth due to the increasing demand for durable and high-performance materials, such as TMT steel bars. TMT steel bars offer numerous advantages, including long service life, excellent workability, and high fatigue strength. These properties make TMT steel bars a preferred choice for constructing modern buildings and infrastructure.
- China, with its extensive infrastructural developments, is a major producer and consumer of TMT steel bars. The global steel market is dynamic and evolving, with ongoing activities and emerging trends shaping its future. For instance, the increasing adoption of green and sustainable construction practices is driving the demand for eco-friendly steel production methods. Additionally, advancements in steel production technologies are leading to the development of high-strength and lightweight steel, further expanding the market's potential applications. According to the latest market research, The market is expected to grow significantly in the coming years.
- This growth can be attributed to the increasing demand for steel in various industries and the ongoing advancements in steel production technologies. In summary, the market is a vital component of the global economy, with its applications spanning various industries. The market's growth is driven by the expanding global population and economic development, and the construction sector is a key contributor. TMT steel bars offer numerous advantages, including long service life, excellent workability, and high fatigue strength, making them a preferred choice for modern construction projects. The market is dynamic and evolving, with ongoing activities and emerging trends shaping its future.
What are the market trends shaping the TMT Steel Bar Industry?
- The increasing demand for structures with seismic resistance represents a notable market trend. A growing emphasis on seismic resilience is shaping market dynamics.
- The TMT (Thermo-Mechanically Treated) steel bar market has experienced notable growth due to the increasing demand for seismic resistance in construction. This trend is particularly relevant in regions susceptible to earthquakes and seismic activities, including countries like Indonesia, Japan, and Nepal. The importance of seismic resilience in construction arises from the potential for earthquakes to cause substantial structural damage, resulting in loss of life and property. TMT steel bars are an attractive solution due to their high tensile strength and ductility, which make them suitable for applications requiring resistance to seismic forces. Compared to traditional steel bars, TMT steel bars exhibit improved mechanical properties, such as increased yield strength and elongation, enhancing their ability to withstand seismic forces.
- The market is witnessing continuous evolution, with ongoing research and development efforts aimed at enhancing the seismic performance of these bars. Manufacturers are focusing on producing TMT steel bars with advanced properties, such as improved elasticity and toughness, to cater to the growing demand for seismic resistance in construction. Moreover, the increasing adoption of green construction practices has also influenced the market. Manufacturers are developing eco-friendly TMT steel bars by using recycled steel and implementing energy-efficient production processes. This trend is expected to gain momentum as the construction industry moves towards more sustainable practices. In summary, the market is undergoing significant growth due to the increasing demand for seismic resistance in construction, particularly in earthquake-prone regions.
- The ongoing research and development efforts, coupled with the adoption of green construction practices, are shaping the future of the market.
What challenges does the TMT Steel Bar Industry face during its growth?
- The volatility of raw material costs, particularly in the production of TMT steel bars, poses a significant challenge and significantly impacts the growth trajectory of the industry.
- TMT (Thermo-Mechanically Treated) steel bars are a crucial component in various industries, including construction, automotive, and infrastructure. The market experiences continuous evolution due to its extensive applications and the ongoing advancements in steel production technologies. Manufacturers face significant challenges in managing production costs, particularly due to the volatile nature of raw material prices. Iron ore and scrap metal are essential components in TMT steel production, and their costs can fluctuate rapidly. For instance, a change in iron ore prices from USD 72 per ton to USD 68 per ton can significantly impact the profitability of TMT steel bar manufacturers. Moreover, manufacturers must balance the need to maintain profit margins with the competitive pressures and contractual agreements that prevent them from passing on every cost increase to their customers.
- This delicate balance requires a deep understanding of market dynamics and the ability to adapt to changing conditions. Despite these challenges, the market continues to grow, driven by the increasing demand for steel in various sectors. For example, the construction industry's ongoing infrastructure development projects require large quantities of TMT steel bars. Similarly, the automotive industry's shift towards electric vehicles is expected to boost the demand for high-strength steel, including TMT steel bars. In summary, the market is a dynamic and evolving space, characterized by the continuous unfolding of market activities and the ongoing challenges faced by manufacturers in managing production costs.
- Understanding these dynamics is crucial for businesses seeking to capitalize on the opportunities presented by this market.
Exclusive Customer Landscape
The tmt steel bar market forecasting report includes the adoption lifecycle of the market, covering from the innovator's stage to the laggard's stage. It focuses on adoption rates in different regions based on penetration. Furthermore, the tmt steel bar market report also includes key purchase criteria and drivers of price sensitivity to help companies evaluate and develop their market growth analysis strategies.

Customer Landscape of TMT Steel Bar Industry
Key Companies & Market Insights
Companies are implementing various strategies, such as strategic alliances, tmt steel bar market forecast, partnerships, mergers and acquisitions, geographical expansion, and product/service launches, to enhance their presence in the industry.
Agni Steels Private Ltd. - The company specializes in producing TMT (Thermo-Mechanically Treated) steel bars, including Fe 550D, renowned for their fatigue resistance and superior physical attributes. The chemical composition of these bars ensures enhanced durability and strength.
The industry research and growth report includes detailed analyses of the competitive landscape of the market and information about key companies, including:
- Agni Steels Private Ltd.
- ArcelorMittal
- Atlas Group
- Bansal Group
- Jindal Stainless Ltd.
- Kamdhenu Ltd.
- MMD
- MS Life Steel
- MSP Steel and Power Ltd.
- Primegold International Ltd.
- Radha Smelters Pvt. Ltd.
- Shyam Metallics
- Spark Electrodes Pvt. Ltd.
- SRMB SRIJAN Pvt. Ltd.
- Stecol International Pvt. Ltd.
- Tata Steel Ltd.
- Ultra TMT
Qualitative and quantitative analysis of companies has been conducted to help clients understand the wider business environment as well as the strengths and weaknesses of key industry players. Data is qualitatively analyzed to categorize companies as pure play, category-focused, industry-focused, and diversified; it is quantitatively analyzed to categorize companies as dominant, leading, strong, tentative, and weak.
Recent Development and News in TMT Steel Bar Market
- In January 2024, Tata Steel, a leading global steel producer, announced the launch of its new TISCO TMT (Thermo Mechanically Treated) steel bars, featuring enhanced tensile strength and improved weldability. This development was aimed at catering to the growing demand for high-performance steel in infrastructure and construction sectors (Tata Steel press release).
- In March 2024, ArcelorMittal, the world's largest steel producer, entered into a strategic partnership with Schneider Electric, a leading energy management and automation company. The collaboration focused on developing smart and sustainable steel solutions, integrating Schneider Electric's energy management technologies into ArcelorMittal's steel production processes (ArcelorMittal press release).
- In May 2024, JFE Steel Corporation, Japan's second-largest steelmaker, completed the acquisition of a 40% stake in Novolipetsk Steel (NLMK), Russia's largest steel producer. This strategic move aimed to strengthen JFE Steel's presence in the global steel market and expand its production capacity (Bloomberg).
- In April 2025, the European Union (EU) approved a €3 billion (USD3.4 billion) funding program to support the production of low-carbon steel in the region. The initiative, known as the European Green Deal, is expected to boost the demand for TMT steel bars in the EU, as the steel produced under this program will be used primarily for infrastructure projects (European Commission press release).
Research Analyst Overview
- The market for inventory management steel encompasses various applications, particularly in the construction sector, where rebar splicing techniques and dimensional tolerances are crucial. Rebar splicing involves joining two lengths of steel bars to form a continuous length, ensuring structural integrity in concrete reinforcement design. The techniques employed must account for steel bar deformation during transportation and installation, as well as meet surface finish requirements for optimal concrete bonding. Steel bars' dimensional tolerances are essential for proper concrete placement and structural efficiency. Transportation logistics steel plays a significant role in maintaining these tolerances, with effective planning and execution necessary to minimize deformation during transit.
- Circular economy principles, such as steel recycling processes, contribute to the sustainability of the steel industry, reducing waste and carbon footprint. Corrosion resistance, ductility and elongation, yield strength properties, and fatigue strength analysis are essential factors in reinforcement steel grades. Thermo-mechanically treated steel and high-strength steel bars offer enhanced performance in these areas, contributing to production efficiency metrics and sustainable steel production. Waste reduction strategies, structural steel detailing, material specification standards, and tensile strength testing are integral components of quality assurance systems. These systems ensure compliance with industry expectations, which anticipate a growth rate of 4.5% annually.
- The construction industry's usage of steel bars continues to expand, driven by the need for durable, efficient, and sustainable infrastructure solutions. Steel bar manufacturing processes must adhere to stringent environmental impact assessment guidelines and material specification standards. Innovations in sustainable steel production, such as waste reduction strategies and quality assurance systems, are essential for maintaining market competitiveness and meeting evolving customer demands. In summary, the inventory management steel market is a dynamic and evolving sector, with ongoing developments in rebar splicing techniques, steel bar deformation, dimensional tolerances, transportation logistics, circular economy principles, surface finish requirements, and various performance properties.
- The industry's focus on sustainability, efficiency, and quality continues to drive innovation and growth.
Dive into Technavio's robust research methodology, blending expert interviews, extensive data synthesis, and validated models for unparalleled TMT Steel Bar Market insights. See full methodology.
|
Market Scope |
|
|
Report Coverage |
Details |
|
Page number |
207 |
|
Base year |
2024 |
|
Historic period |
2019-2023 |
|
Forecast period |
2025-2029 |
|
Growth momentum & CAGR |
Accelerate at a CAGR of 4.3% |
|
Market growth 2025-2029 |
USD 91 billion |
|
Market structure |
Fragmented |
|
YoY growth 2024-2025(%) |
4.1 |
|
Key countries |
US, Canada, Germany, UK, Italy, France, China, India, Japan, Brazil, Egypt, UAE, Oman, Argentina, KSA, UAE, Brazil, and Rest of World (ROW) |
|
Competitive landscape |
Leading Companies, Market Positioning of Companies, Competitive Strategies, and Industry Risks |
What are the Key Data Covered in this TMT Steel Bar Market Research and Growth Report?
- CAGR of the TMT Steel Bar industry during the forecast period
- Detailed information on factors that will drive the growth and forecasting between 2025 and 2029
- Precise estimation of the size of the market and its contribution of the industry in focus to the parent market
- Accurate predictions about upcoming growth and trends and changes in consumer behaviour
- Growth of the market across APAC, Europe, North America, Middle East and Africa, and South America
- Thorough analysis of the market's competitive landscape and detailed information about companies
- Comprehensive analysis of factors that will challenge the TMT steel bar market growth of industry companies
We can help! Our analysts can customize this TMT steel bar market research report to meet your requirements.
 RIA -
RIA - 
