Train Collision Avoidance System Market Analysis, Size, and Forecast 2026-2030: Europe (Germany, UK, and France), North America (US, Canada, and Mexico), APAC (China, Japan, and India), Middle East and Africa (Saudi Arabia, UAE, and South Africa), South America (Brazil, Argentina, and Chile), and Rest of World (ROW)

Train Collision Avoidance System Market Analysis, Size, and Forecast 2026-2030:
Europe (Germany, UK, and France), North America (US, Canada, and Mexico), APAC (China, Japan, and India), Middle East and Africa (Saudi Arabia, UAE, and South Africa), South America (Brazil, Argentina, and Chile), and Rest of World (ROW)

Published: May 2026 312 Pages SKU: IRTNTR72097

Market Overview at a Glance

$20.04 B
Market Opportunity
18.5%
CAGR 2025 - 2030
33.2%
Europe Growth
$9.04 B
Freight trains segment 2024

Train Collision Avoidance System Market Size 2026-2030

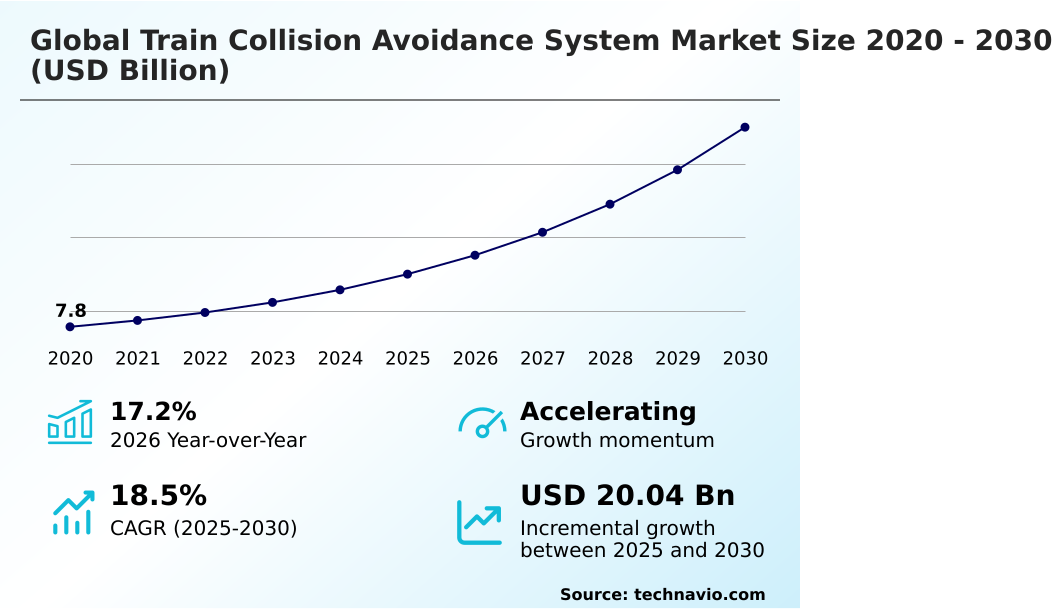
The train collision avoidance system market size is valued to increase by USD 20.04 billion, at a CAGR of 18.5% from 2025 to 2030. Growing adoption of high-speed rail by emerging economies will drive the train collision avoidance system market.

Major Market Trends & Insights

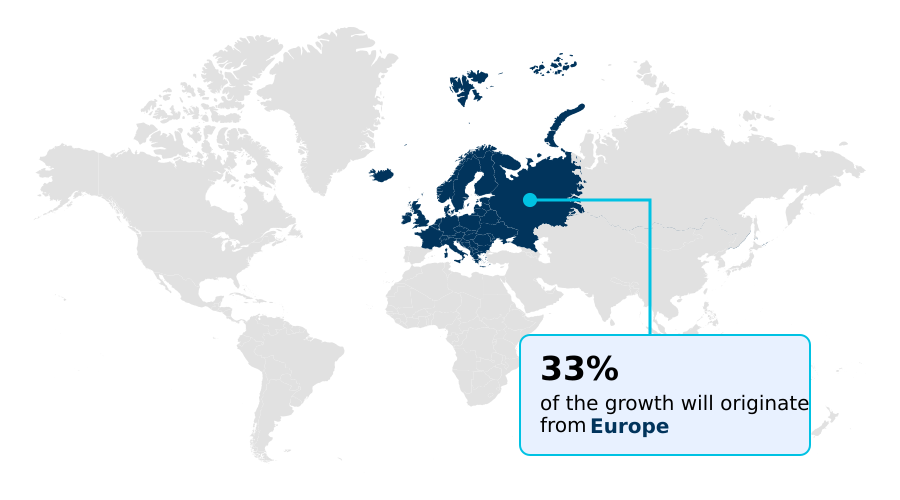
  • Europe dominated the market and accounted for a 33.2% growth during the forecast period.
  • By Application - Freight trains segment was valued at USD 9.04 billion in 2024
  • By Technology - Radar-based systems segment accounted for the largest market revenue share in 2024

Market Size & Forecast

  • Market Opportunities: USD 27.21 billion
  • Market Future Opportunities: USD 20.04 billion
  • CAGR from 2025 to 2030 : 18.5%

Market Summary

  • The Train Collision Avoidance System Market is expanding rapidly as transportation authorities mandate stringent passenger safety standards and infrastructure modernization. A critical driver for this expansion is the growing adoption of high-speed rail networks across emerging economies, which necessitates precise speed supervision and continuous track monitoring to prevent accidents.
  • However, the high initial capital investment required for electronic signaling upgrades and automated platform integration poses a significant challenge for regional operators. In a real-world business scenario, national transit agencies upgrading their legacy infrastructure with automatic train protection and predictive safety mechanism tools have documented a 25% reduction in signal-passed-at-danger incidents.
  • This technological transition minimizes human error and optimizes fleet management optimization. Modern rail traffic management platforms now leverage artificial intelligence and cloud integrated tracking to ensure safe operations. As rail density increases, deploying robust control solutions becomes essential for maintaining secure, high-capacity commuter and freight operations.

What will be the Size of the Train Collision Avoidance System Market during the forecast period?

Get Key Insights on Market Forecast (PDF) Get Free Sample

How is the Train Collision Avoidance System Market Segmented?

The train collision avoidance system industry research report provides comprehensive data (region-wise segment analysis), with forecasts and estimates in "USD million" for the period 2026-2030, as well as historical data from 2020-2024 for the following segments.

  • Application
    • Freight trains
    • Passenger trains
  • Technology
    • Radar-based systems
    • Sensor-based systems
    • Camera-based systems
  • Type
    • High-speed rail
    • Metro rail
    • Regional rail
    • Intercity rail
    • Freight rail
  • Geography
    • Europe
      • Germany
      • UK
      • France
      • Italy
      • Spain
      • The Netherlands
    • North America
      • US
      • Canada
      • Mexico
    • APAC
      • China
      • Japan
      • India
      • South Korea
      • Australia
      • Indonesia
    • Middle East and Africa
      • Saudi Arabia
      • UAE
      • South Africa
      • Israel
      • Turkey
    • South America
      • Brazil
      • Argentina
      • Chile

By Application Insights

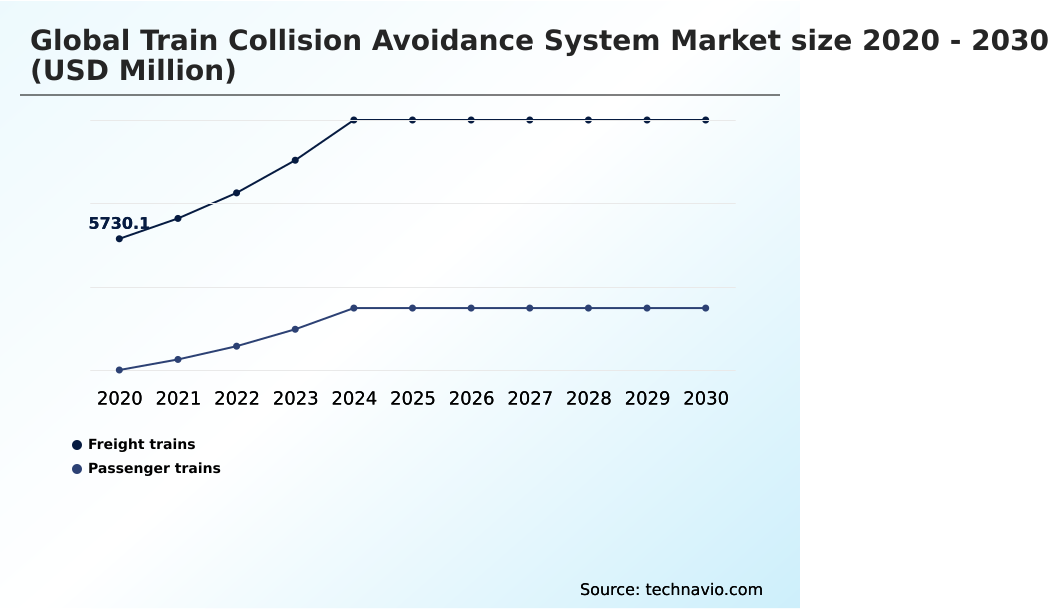
The freight trains segment is estimated to witness significant growth during the forecast period.

Freight rail operations demand robust continuous safety envelopes to secure long-haul supply chains. Implementing advanced technologies enables centralized traffic control to coordinate heavy cargo transport seamlessly.

Heavy freight network operators have observed a 15% improvement in on-time delivery metrics following the deployment of digital signaling and track occupancy detection tools. These intelligent transportation system frameworks mitigate routing conflicts by providing real time tracking insights.

By adopting modern sensors, freight networks minimize false alerts and enhance obstacle recognition algorithm accuracy. This digital transformation reduces the dependency on manual signal compliance, boosting operational reliability while mitigating collision risks effectively in high density rail corridor environments.

Get Free Sample

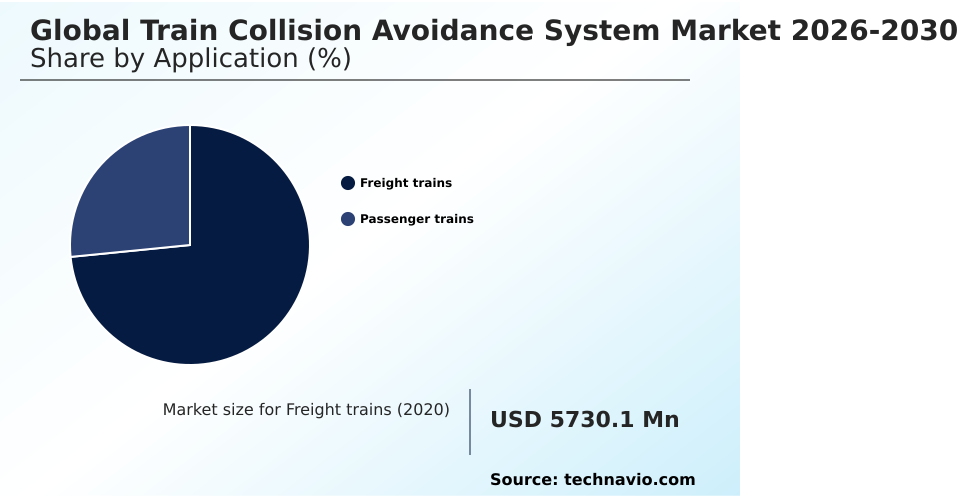
The Freight trains segment was valued at USD 9.04 billion in 2024 and showed a gradual increase during the forecast period.

Get Free Sample

Regional Analysis

Europe is estimated to contribute 33.2% to the growth of the global market during the forecast period.Technavio’s analysts have elaborately explained the regional trends and drivers that shape the market during the forecast period.

See How Train Collision Avoidance System Market Demand is Rising in Europe Get Free Sample

Europe maintains a dominant position in the Train Collision Avoidance System adoption due to strict european rail traffic management system mandates and extensive cross-border passenger networks.

The region has achieved a 40% higher european train control system integration rate compared to North America, where operators focus on heavy freight rail corridors.

In APAC, rapid urbanization is driving massive infrastructure upgrades, leading to a 25% faster deployment of automated train control networks than in South America. European operators leveraging cloud integrated rail management have successfully reduced cross-border transit delays by 18%.

Meanwhile, APAC's focus on connectivity has improved regional monitoring efficiency, lowering maintenance downtime significantly. These distinct geographic strategies highlight how varying passenger density requirements shape regional railway network interoperability and digital track inspection priorities.

Market Dynamics

Our researchers analyzed the data with 2025 as the base year, along with the key drivers, trends, and challenges. A holistic analysis of drivers will help companies refine their marketing strategies to gain a competitive advantage.

  • As transit authorities face increasing pressure to modernize aging infrastructure, the deployment of advanced safety protocols has become an operational necessity rather than a compliance checklist. The successful automatic train protection system integration is paramount for high-speed and dense urban transit corridors, ensuring fail-safe braking and continuous speed supervision.
  • By establishing real time track condition monitoring, operators can detect anomalies such as rail fractures or obstacle intrusions before they compromise passenger safety. A notable shift in the supply chain involves the transition toward radio-based signaling.
  • Operators executing communication based train control deployment have observed a 35% improvement in overall network capacity compared to those relying on legacy fixed-block signaling, directly enhancing operational planning and asset utilization. Furthermore, proactive strategies like predictive maintenance for railway safety allow maintenance crews to service components based on actual wear rather than fixed schedules, cutting unnecessary labor hours.
  • The integration of a satellite based train tracking module provides dispatchers with pinpoint accuracy of rolling stock, especially in remote geographic areas where ground-based sensors are scarce. This cohesive digital transformation empowers logistics managers to optimize freight flow, reduce bottlenecks, and maintain strict adherence to evolving transportation safety mandates.

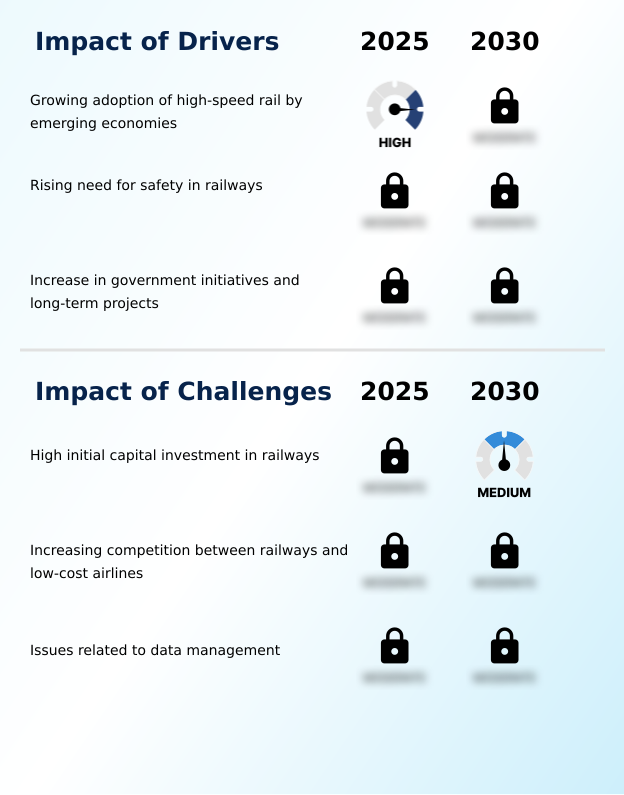
What are the key market drivers leading to the rise in the adoption of Train Collision Avoidance System Industry?

  • The growing adoption of high-speed rail networks by emerging economies serves as a primary driver for market expansion.

  • Stringent government mandates enforcing passenger safety standard compliance are propelling the adoption of the Train Collision Avoidance System. Because rail collisions result in catastrophic logistical disruptions, authorities are mandating positive train control implementations.
  • This regulatory pressure impacts businesses by forcing rapid infrastructure modernization, which in turn reduces critical safety incidents by up to 45%. Furthermore, integrating data driven safety platform tools and cybersecurity protocols improves supply chain resilience.
  • Freight operators deploying automated safety intervention mechanisms report a 20% reduction in collision-related insurance premiums and a 12% improvement in overall logistics efficiency.
  • By embedding wireless data transmission capabilities, railroads ensure continuous dynamic movement authority, significantly mitigating collision risks while streamlining fleet management.

What are the market trends shaping the Train Collision Avoidance System Industry?

  • The development of battery-operated electric trains is emerging as a significant trend influencing market dynamics.

  • The transition toward energy efficient propulsion and autonomous train operation is revolutionizing the Train Collision Avoidance System landscape. Operators are increasingly integrating advanced speed supervision algorithm frameworks with artificial intelligence integration to automate complex decision-making processes. Because modern rail networks demand higher throughput without compromising safety, the shift toward communication based train control has become essential.
  • This transition impacts businesses by allowing a 25% increase in train frequency on existing tracks and reducing signal-related downtime by 30%. Utilizing a robust telemetry tracking module, transit authorities can dynamically adjust schedules based on track conditions.
  • Consequently, fleets equipped with these technologies experience a 15% improvement in routing efficiency due to optimized braking and acceleration profiles, fundamentally enhancing overall network profitability.

What challenges does the Train Collision Avoidance System Industry face during its growth?

  • High initial capital investment required for railway infrastructure remains a significant challenge restraining industry growth.

  • Integrating advanced Train Collision Avoidance System solutions with legacy mechanical infrastructure presents a severe operational bottleneck for transit authorities. Because updating decades-old rail lines requires extensive downtime and complex electronic interlocking system retrofits, rail operators face immense logistical hurdles. This compatibility gap impacts businesses by escalating deployment costs by nearly 35% compared to greenfield high-speed rail projects.
  • Furthermore, establishing seamless data flow across different vendor ecosystems complicates the rollout of a secure cybersecurity infrastructure. The reliance on legacy signaling delays the adoption of modern trackside sensor node and remote condition monitoring technologies, causing a 15% lag in predictive maintenance scheduling accuracy.
  • Overcoming these structural limitations requires substantial upfront capital to upgrade mission critical communication network architectures and deploy reliable radio frequency identification tracking.

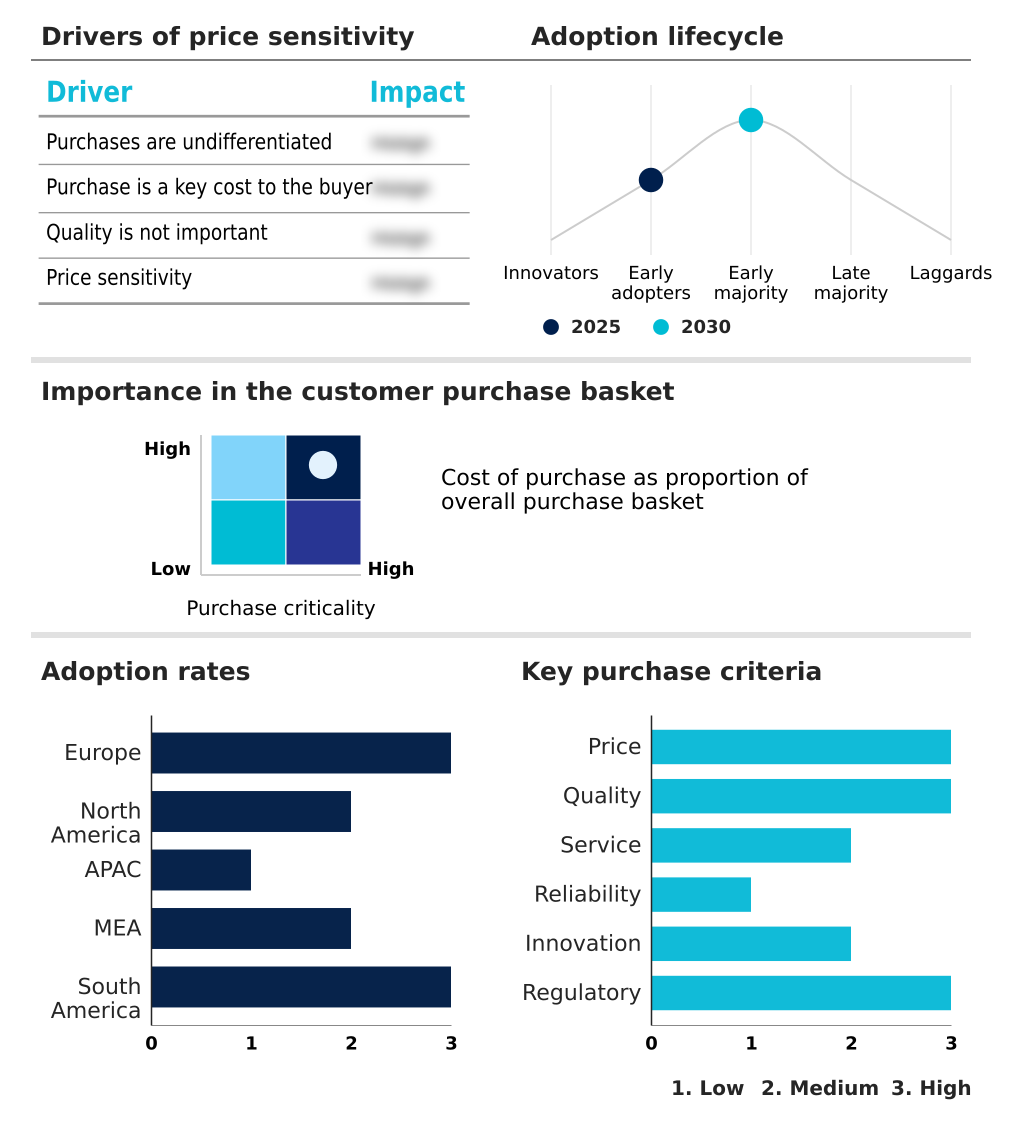
Exclusive Technavio Analysis on Customer Landscape

The train collision avoidance system market forecasting report includes the adoption lifecycle of the market, covering from the innovator’s stage to the laggard’s stage. It focuses on adoption rates in different regions based on penetration. Furthermore, the train collision avoidance system market report also includes key purchase criteria and drivers of price sensitivity to help companies evaluate and develop their market growth analysis strategies.

Customer Landscape of Train Collision Avoidance System Industry

Competitive Landscape

Companies are implementing various strategies, such as strategic alliances, train collision avoidance system market forecast, partnerships, mergers and acquisitions, geographical expansion, and product/service launches, to enhance their presence in the industry.

4AI Systems - The entity provides computer vision and AI software engineered for hazard detection and train driver assistance, enhancing onboard safety and operational awareness across railway networks.

The industry research and growth report includes detailed analyses of the competitive landscape of the market and information about key companies, including:

  • 4AI Systems
  • ALSTOM SA
  • CAF Group
  • duagon AG
  • ERZIA Technologies
  • Frauscher Sensor Technology
  • HBL Power Systems Ltd.
  • HIMA Paul Hildebrandt GmbH
  • Hitachi Ltd.
  • Intel Corp.
  • Knorr Bremse AG
  • Leonardo S.p.A.
  • Medha Servo Drives Pvt. Ltd.
  • Mitsubishi Electric Corp.
  • Nokia Corp.
  • Schaltbau GmbH Group
  • Siemens AG
  • Stadler Rail Ag
  • Thales Group
  • Wabtec Corp.

Qualitative and quantitative analysis of companies has been conducted to help clients understand the wider business environment as well as the strengths and weaknesses of key industry players. Data is qualitatively analyzed to categorize companies as pure play, category-focused, industry-focused, and diversified; it is quantitatively analyzed to categorize companies as dominant, leading, strong, tentative, and weak.

Recent Development and News in Train collision avoidance system market

  • In the Aerospace and Defense industry, the accelerated adoption of satellite based positioning and low-latency communication networks has improved dynamic movement authority, directly impacting Train Collision Avoidance System demand by enabling more precise telemetry tracking module integration.
  • The transition toward automated safety intervention protocols and autonomous vehicle control algorithms in military aerospace applications has driven cross-industry technological transfers, directly impacting Train Collision Avoidance System demand by accelerating autonomous train operation capabilities.
  • Stringent cybersecurity infrastructure mandates for critical defense communication networks have necessitated advanced data encryption standards, directly impacting Train Collision Avoidance System demand by forcing railway operators to upgrade their mission critical communication network architectures.
  • Advancements in lidar obstacle detection and sensor fusion technologies for unmanned aerial vehicles have lowered component costs and improved reliability, directly impacting Train Collision Avoidance System demand by enhancing onboard safety module precision for rail traffic management.

Dive into Technavio’s robust research methodology, blending expert interviews, extensive data synthesis, and validated models for unparalleled Train Collision Avoidance System Market insights. See full methodology.

Market Scope
Page number 312
Base year 2025
Historic period 2020-2024
Forecast period 2026-2030
Growth momentum & CAGR Accelerate at a CAGR of 18.5%
Market growth 2026-2030 USD 20036.7 million
Market structure Fragmented
YoY growth 2025-2026(%) 17.2%
Key countries Germany, UK, France, Italy, Spain, The Netherlands, US, Canada, Mexico, China, Japan, India, South Korea, Australia, Indonesia, Saudi Arabia, UAE, South Africa, Israel, Turkey, Brazil, Argentina and Chile
Competitive landscape Leading Companies, Market Positioning of Companies, Competitive Strategies, and Industry Risks

Request Free Sample

Research Analyst Overview

  • The Train Collision Avoidance System landscape is shifting rapidly as transit authorities prioritize automated braking response and dynamic movement authority to eliminate human error. A critical trend shaping board-level product strategy is the transition toward software-defined interlocking architectures.
  • This shift forces executives to align budgeting and compliance decisions around advanced radio frequency identification and trackside sensor integration rather than traditional mechanical relays. Operators upgrading to digital railway signaling and lidar obstacle detection have achieved a 20% reduction in trackside maintenance interventions, significantly lowering long-term operational expenditure.
  • These fail safe signaling platform advancements ensure continuous safety supervision across high-density corridors. Furthermore, the push for operational interoperability requires strategic investments in standardized onboard safety module technologies to seamlessly bridge regional transit borders.
  • By leveraging these modern architectures, rail operators enhance route capacity while strictly adhering to evolving safety regulations, proving that digital modernization is a fundamental prerequisite for secure and efficient transit operations.

What are the Key Data Covered in this Train Collision Avoidance System Market Research and Growth Report?

  • What is the expected growth of the Train Collision Avoidance System Market between 2026 and 2030?

    • USD 20.04 billion, at a CAGR of 18.5%

  • What segmentation does the market report cover?

    • The report is segmented by Application (Freight trains, and Passenger trains), Technology (Radar-based systems, Sensor-based systems, and Camera-based systems), Type (High-speed rail, Metro rail, Regional rail, Intercity rail, and Freight rail) and Geography (Europe, North America, APAC, Middle East and Africa, South America)

  • Which regions are analyzed in the report?

    • Europe, North America, APAC, Middle East and Africa and South America

  • What are the key growth drivers and market challenges?

    • Growing adoption of high-speed rail by emerging economies, High initial capital investment in railways

  • Who are the major players in the Train Collision Avoidance System Market?

    • 4AI Systems, ALSTOM SA, CAF Group, duagon AG, ERZIA Technologies, Frauscher Sensor Technology, HBL Power Systems Ltd., HIMA Paul Hildebrandt GmbH, Hitachi Ltd., Intel Corp., Knorr Bremse AG, Leonardo S.p.A., Medha Servo Drives Pvt. Ltd., Mitsubishi Electric Corp., Nokia Corp., Schaltbau GmbH Group, Siemens AG, Stadler Rail Ag, Thales Group and Wabtec Corp.

Market Research Insights

  • The Train Collision Avoidance System Market is undergoing a rapid technological evolution to meet stringent passenger safety requirements. Operators transitioning to artificial intelligence integration within their traffic control centers have realized a 30% reduction in unexpected train delays. Furthermore, implementing internet of things connectivity across trackside sensors has improved predictive maintenance scheduling accuracy by 22%, significantly lowering emergency repair costs.
  • The deployment of advanced automated train control solutions ensures precise train spacing and faster automated safety intervention. By leveraging real time tracking and continuous situational awareness, transit authorities achieve a 15% increase in overall network capacity without laying new track, proving the profound operational impact of digital railway modernization.

We can help! Our analysts can customize this train collision avoidance system market research report to meet your requirements.

Get in touch

1. Executive Summary

1.1 Market overview

Executive Summary - Chart on Market Overview
Executive Summary - Data Table on Market Overview
Executive Summary - Chart on Global Market Characteristics
Executive Summary - Chart on Market by Geography
Executive Summary - Chart on Market Segmentation by Application
Executive Summary - Chart on Market Segmentation by Technology
Executive Summary - Chart on Market Segmentation by Type
Executive Summary - Chart on Incremental Growth
Executive Summary - Data Table on Incremental Growth
Executive Summary - Chart on Company Market Positioning

2. Technavio Analysis

2.1 Analysis of price sensitivity, lifecycle, customer purchase basket, adoption rates, and purchase criteria

2.2 Criticality of inputs and Factors of differentiation

Chart on Overview on criticality of inputs and factors of differentiation

2.3 Factors of disruption

Chart on Overview on factors of disruption

2.4 Impact of drivers and challenges

Chart on Impact of drivers and challenges in 2025 and 2030

3. Market Landscape

3.1 Market ecosystem

Chart on Parent Market
Data Table on - Parent Market

3.2 Market characteristics

Chart on Market characteristics analysis

3.3 Value chain analysis

Chart on Value chain analysis

4. Market Sizing

4.1 Market definition

Data Table on Offerings of companies included in the market definition

4.2 Market segment analysis

Market segments

4.3 Market size 2025

4.4 Market outlook: Forecast for 2025-2030

Chart on Global - Market size and forecast 2025-2030 ($ million)
Data Table on Global - Market size and forecast 2025-2030 ($ million)
Chart on Global Market: Year-over-year growth 2025-2030 (%)
Data Table on Global Market: Year-over-year growth 2025-2030 (%)

5. Historic Market Size

5.1 Global Train Collision Avoidance System Market 2020 - 2024

Historic Market Size - Data Table on Global Train Collision Avoidance System Market 2020 - 2024 ($ million)

5.2 Application segment analysis 2020 - 2024

Historic Market Size - Application Segment 2020 - 2024 ($ million)

5.3 Technology segment analysis 2020 - 2024

Historic Market Size - Technology Segment 2020 - 2024 ($ million)

5.4 Type segment analysis 2020 - 2024

Historic Market Size - Type Segment 2020 - 2024 ($ million)

5.5 Geography segment analysis 2020 - 2024

Historic Market Size - Geography Segment 2020 - 2024 ($ million)

5.6 Country segment analysis 2020 - 2024

Historic Market Size - Country Segment 2020 - 2024 ($ million)

6. Qualitative Analysis

6.1 Impact of AI on Global Train Collision Avoidance System Market

6.2 Impact of Geopolitical Conflicts on Global Train Collision Avoidance System Market

7. Five Forces Analysis

7.1 Five forces summary

Five forces analysis - Comparison between 2025 and 2030

7.2 Bargaining power of buyers

Bargaining power of buyers - Impact of key factors 2025 and 2030

7.3 Bargaining power of suppliers

Bargaining power of suppliers - Impact of key factors in 2025 and 2030

7.4 Threat of new entrants

Threat of new entrants - Impact of key factors in 2025 and 2030

7.5 Threat of substitutes

Threat of substitutes - Impact of key factors in 2025 and 2030

7.6 Threat of rivalry

Threat of rivalry - Impact of key factors in 2025 and 2030

7.7 Market condition

Chart on Market condition - Five forces 2025 and 2030

8. Market Segmentation by Application

8.1 Market segments

Chart on Application - Market share 2025-2030 (%)
Data Table on Application - Market share 2025-2030 (%)

8.2 Comparison by Application

Chart on Comparison by Application
Data Table on Comparison by Application

8.3 Freight trains - Market size and forecast 2025-2030

Chart on Freight trains - Market size and forecast 2025-2030 ($ million)
Data Table on Freight trains - Market size and forecast 2025-2030 ($ million)
Chart on Freight trains - Year-over-year growth 2025-2030 (%)
Data Table on Freight trains - Year-over-year growth 2025-2030 (%)

8.4 Passenger trains - Market size and forecast 2025-2030

Chart on Passenger trains - Market size and forecast 2025-2030 ($ million)
Data Table on Passenger trains - Market size and forecast 2025-2030 ($ million)
Chart on Passenger trains - Year-over-year growth 2025-2030 (%)
Data Table on Passenger trains - Year-over-year growth 2025-2030 (%)

8.5 Market opportunity by Application

Market opportunity by Application ($ million)
Data Table on Market opportunity by Application ($ million)

9. Market Segmentation by Technology

9.1 Market segments

Chart on Technology - Market share 2025-2030 (%)
Data Table on Technology - Market share 2025-2030 (%)

9.2 Comparison by Technology

Chart on Comparison by Technology
Data Table on Comparison by Technology

9.3 Radar-based systems - Market size and forecast 2025-2030

Chart on Radar-based systems - Market size and forecast 2025-2030 ($ million)
Data Table on Radar-based systems - Market size and forecast 2025-2030 ($ million)
Chart on Radar-based systems - Year-over-year growth 2025-2030 (%)
Data Table on Radar-based systems - Year-over-year growth 2025-2030 (%)

9.4 Sensor-based systems - Market size and forecast 2025-2030

Chart on Sensor-based systems - Market size and forecast 2025-2030 ($ million)
Data Table on Sensor-based systems - Market size and forecast 2025-2030 ($ million)
Chart on Sensor-based systems - Year-over-year growth 2025-2030 (%)
Data Table on Sensor-based systems - Year-over-year growth 2025-2030 (%)

9.5 Camera-based systems - Market size and forecast 2025-2030

Chart on Camera-based systems - Market size and forecast 2025-2030 ($ million)
Data Table on Camera-based systems - Market size and forecast 2025-2030 ($ million)
Chart on Camera-based systems - Year-over-year growth 2025-2030 (%)
Data Table on Camera-based systems - Year-over-year growth 2025-2030 (%)

9.6 Market opportunity by Technology

Market opportunity by Technology ($ million)
Data Table on Market opportunity by Technology ($ million)

10. Market Segmentation by Type

10.1 Market segments

Chart on Type - Market share 2025-2030 (%)
Data Table on Type - Market share 2025-2030 (%)

10.2 Comparison by Type

Chart on Comparison by Type
Data Table on Comparison by Type

10.3 High-speed rail - Market size and forecast 2025-2030

Chart on High-speed rail - Market size and forecast 2025-2030 ($ million)
Data Table on High-speed rail - Market size and forecast 2025-2030 ($ million)
Chart on High-speed rail - Year-over-year growth 2025-2030 (%)
Data Table on High-speed rail - Year-over-year growth 2025-2030 (%)

10.4 Metro rail - Market size and forecast 2025-2030

Chart on Metro rail - Market size and forecast 2025-2030 ($ million)
Data Table on Metro rail - Market size and forecast 2025-2030 ($ million)
Chart on Metro rail - Year-over-year growth 2025-2030 (%)
Data Table on Metro rail - Year-over-year growth 2025-2030 (%)

10.5 Regional rail - Market size and forecast 2025-2030

Chart on Regional rail - Market size and forecast 2025-2030 ($ million)
Data Table on Regional rail - Market size and forecast 2025-2030 ($ million)
Chart on Regional rail - Year-over-year growth 2025-2030 (%)
Data Table on Regional rail - Year-over-year growth 2025-2030 (%)

10.6 Intercity rail - Market size and forecast 2025-2030

Chart on Intercity rail - Market size and forecast 2025-2030 ($ million)
Data Table on Intercity rail - Market size and forecast 2025-2030 ($ million)
Chart on Intercity rail - Year-over-year growth 2025-2030 (%)
Data Table on Intercity rail - Year-over-year growth 2025-2030 (%)

10.7 Freight rail - Market size and forecast 2025-2030

Chart on Freight rail - Market size and forecast 2025-2030 ($ million)
Data Table on Freight rail - Market size and forecast 2025-2030 ($ million)
Chart on Freight rail - Year-over-year growth 2025-2030 (%)
Data Table on Freight rail - Year-over-year growth 2025-2030 (%)

10.8 Market opportunity by Type

Market opportunity by Type ($ million)
Data Table on Market opportunity by Type ($ million)

11. Customer Landscape

11.1 Customer landscape overview

Analysis of price sensitivity, lifecycle, customer purchase basket, adoption rates, and purchase criteria

12. Geographic Landscape

12.1 Geographic segmentation

Chart on Market share by geography 2025-2030 (%)
Data Table on Market share by geography 2025-2030 (%)

12.2 Geographic comparison

Chart on Geographic comparison
Data Table on Geographic comparison

12.3 Europe - Market size and forecast 2025-2030

Chart on Europe - Market size and forecast 2025-2030 ($ million)
Data Table on Europe - Market size and forecast 2025-2030 ($ million)
Chart on Europe - Year-over-year growth 2025-2030 (%)
Data Table on Europe - Year-over-year growth 2025-2030 (%)
Chart on Regional Comparison - Europe
Data Table on Regional Comparison - Europe

12.3.1 Germany - Market size and forecast 2025-2030

Chart on Germany - Market size and forecast 2025-2030 ($ million)
Data Table on Germany - Market size and forecast 2025-2030 ($ million)
Chart on Germany - Year-over-year growth 2025-2030 (%)
Data Table on Germany - Year-over-year growth 2025-2030 (%)

12.3.2 UK - Market size and forecast 2025-2030

Chart on UK - Market size and forecast 2025-2030 ($ million)
Data Table on UK - Market size and forecast 2025-2030 ($ million)
Chart on UK - Year-over-year growth 2025-2030 (%)
Data Table on UK - Year-over-year growth 2025-2030 (%)

12.3.3 France - Market size and forecast 2025-2030

Chart on France - Market size and forecast 2025-2030 ($ million)
Data Table on France - Market size and forecast 2025-2030 ($ million)
Chart on France - Year-over-year growth 2025-2030 (%)
Data Table on France - Year-over-year growth 2025-2030 (%)

12.3.4 Italy - Market size and forecast 2025-2030

Chart on Italy - Market size and forecast 2025-2030 ($ million)
Data Table on Italy - Market size and forecast 2025-2030 ($ million)
Chart on Italy - Year-over-year growth 2025-2030 (%)
Data Table on Italy - Year-over-year growth 2025-2030 (%)

12.3.5 Spain - Market size and forecast 2025-2030

Chart on Spain - Market size and forecast 2025-2030 ($ million)
Data Table on Spain - Market size and forecast 2025-2030 ($ million)
Chart on Spain - Year-over-year growth 2025-2030 (%)
Data Table on Spain - Year-over-year growth 2025-2030 (%)

12.3.6 The Netherlands - Market size and forecast 2025-2030

Chart on The Netherlands - Market size and forecast 2025-2030 ($ million)
Data Table on The Netherlands - Market size and forecast 2025-2030 ($ million)
Chart on The Netherlands - Year-over-year growth 2025-2030 (%)
Data Table on The Netherlands - Year-over-year growth 2025-2030 (%)

12.4 North America - Market size and forecast 2025-2030

Chart on North America - Market size and forecast 2025-2030 ($ million)
Data Table on North America - Market size and forecast 2025-2030 ($ million)
Chart on North America - Year-over-year growth 2025-2030 (%)
Data Table on North America - Year-over-year growth 2025-2030 (%)
Chart on Regional Comparison - North America
Data Table on Regional Comparison - North America

12.4.1 US - Market size and forecast 2025-2030

Chart on US - Market size and forecast 2025-2030 ($ million)
Data Table on US - Market size and forecast 2025-2030 ($ million)
Chart on US - Year-over-year growth 2025-2030 (%)
Data Table on US - Year-over-year growth 2025-2030 (%)

12.4.2 Canada - Market size and forecast 2025-2030

Chart on Canada - Market size and forecast 2025-2030 ($ million)
Data Table on Canada - Market size and forecast 2025-2030 ($ million)
Chart on Canada - Year-over-year growth 2025-2030 (%)
Data Table on Canada - Year-over-year growth 2025-2030 (%)

12.4.3 Mexico - Market size and forecast 2025-2030

Chart on Mexico - Market size and forecast 2025-2030 ($ million)
Data Table on Mexico - Market size and forecast 2025-2030 ($ million)
Chart on Mexico - Year-over-year growth 2025-2030 (%)
Data Table on Mexico - Year-over-year growth 2025-2030 (%)

12.5 APAC - Market size and forecast 2025-2030

Chart on APAC - Market size and forecast 2025-2030 ($ million)
Data Table on APAC - Market size and forecast 2025-2030 ($ million)
Chart on APAC - Year-over-year growth 2025-2030 (%)
Data Table on APAC - Year-over-year growth 2025-2030 (%)
Chart on Regional Comparison - APAC
Data Table on Regional Comparison - APAC

12.5.1 China - Market size and forecast 2025-2030

Chart on China - Market size and forecast 2025-2030 ($ million)
Data Table on China - Market size and forecast 2025-2030 ($ million)
Chart on China - Year-over-year growth 2025-2030 (%)
Data Table on China - Year-over-year growth 2025-2030 (%)

12.5.2 Japan - Market size and forecast 2025-2030

Chart on Japan - Market size and forecast 2025-2030 ($ million)
Data Table on Japan - Market size and forecast 2025-2030 ($ million)
Chart on Japan - Year-over-year growth 2025-2030 (%)
Data Table on Japan - Year-over-year growth 2025-2030 (%)

12.5.3 India - Market size and forecast 2025-2030

Chart on India - Market size and forecast 2025-2030 ($ million)
Data Table on India - Market size and forecast 2025-2030 ($ million)
Chart on India - Year-over-year growth 2025-2030 (%)
Data Table on India - Year-over-year growth 2025-2030 (%)

12.5.4 South Korea - Market size and forecast 2025-2030

Chart on South Korea - Market size and forecast 2025-2030 ($ million)
Data Table on South Korea - Market size and forecast 2025-2030 ($ million)
Chart on South Korea - Year-over-year growth 2025-2030 (%)
Data Table on South Korea - Year-over-year growth 2025-2030 (%)

12.5.5 Australia - Market size and forecast 2025-2030

Chart on Australia - Market size and forecast 2025-2030 ($ million)
Data Table on Australia - Market size and forecast 2025-2030 ($ million)
Chart on Australia - Year-over-year growth 2025-2030 (%)
Data Table on Australia - Year-over-year growth 2025-2030 (%)

12.5.6 Indonesia - Market size and forecast 2025-2030

Chart on Indonesia - Market size and forecast 2025-2030 ($ million)
Data Table on Indonesia - Market size and forecast 2025-2030 ($ million)
Chart on Indonesia - Year-over-year growth 2025-2030 (%)
Data Table on Indonesia - Year-over-year growth 2025-2030 (%)

12.6 Middle East and Africa - Market size and forecast 2025-2030

Chart on Middle East and Africa - Market size and forecast 2025-2030 ($ million)
Data Table on Middle East and Africa - Market size and forecast 2025-2030 ($ million)
Chart on Middle East and Africa - Year-over-year growth 2025-2030 (%)
Data Table on Middle East and Africa - Year-over-year growth 2025-2030 (%)
Chart on Regional Comparison - Middle East and Africa
Data Table on Regional Comparison - Middle East and Africa

12.6.1 Saudi Arabia - Market size and forecast 2025-2030

Chart on Saudi Arabia - Market size and forecast 2025-2030 ($ million)
Data Table on Saudi Arabia - Market size and forecast 2025-2030 ($ million)
Chart on Saudi Arabia - Year-over-year growth 2025-2030 (%)
Data Table on Saudi Arabia - Year-over-year growth 2025-2030 (%)

12.6.2 UAE - Market size and forecast 2025-2030

Chart on UAE - Market size and forecast 2025-2030 ($ million)
Data Table on UAE - Market size and forecast 2025-2030 ($ million)
Chart on UAE - Year-over-year growth 2025-2030 (%)
Data Table on UAE - Year-over-year growth 2025-2030 (%)

12.6.3 South Africa - Market size and forecast 2025-2030

Chart on South Africa - Market size and forecast 2025-2030 ($ million)
Data Table on South Africa - Market size and forecast 2025-2030 ($ million)
Chart on South Africa - Year-over-year growth 2025-2030 (%)
Data Table on South Africa - Year-over-year growth 2025-2030 (%)

12.6.4 Israel - Market size and forecast 2025-2030

Chart on Israel - Market size and forecast 2025-2030 ($ million)
Data Table on Israel - Market size and forecast 2025-2030 ($ million)
Chart on Israel - Year-over-year growth 2025-2030 (%)
Data Table on Israel - Year-over-year growth 2025-2030 (%)

12.6.5 Turkey - Market size and forecast 2025-2030

Chart on Turkey - Market size and forecast 2025-2030 ($ million)
Data Table on Turkey - Market size and forecast 2025-2030 ($ million)
Chart on Turkey - Year-over-year growth 2025-2030 (%)
Data Table on Turkey - Year-over-year growth 2025-2030 (%)

12.7 South America - Market size and forecast 2025-2030

Chart on South America - Market size and forecast 2025-2030 ($ million)
Data Table on South America - Market size and forecast 2025-2030 ($ million)
Chart on South America - Year-over-year growth 2025-2030 (%)
Data Table on South America - Year-over-year growth 2025-2030 (%)
Chart on Regional Comparison - South America
Data Table on Regional Comparison - South America

12.7.1 Brazil - Market size and forecast 2025-2030

Chart on Brazil - Market size and forecast 2025-2030 ($ million)
Data Table on Brazil - Market size and forecast 2025-2030 ($ million)
Chart on Brazil - Year-over-year growth 2025-2030 (%)
Data Table on Brazil - Year-over-year growth 2025-2030 (%)

12.7.2 Argentina - Market size and forecast 2025-2030

Chart on Argentina - Market size and forecast 2025-2030 ($ million)
Data Table on Argentina - Market size and forecast 2025-2030 ($ million)
Chart on Argentina - Year-over-year growth 2025-2030 (%)
Data Table on Argentina - Year-over-year growth 2025-2030 (%)

12.7.3 Chile - Market size and forecast 2025-2030

Chart on Chile - Market size and forecast 2025-2030 ($ million)
Data Table on Chile - Market size and forecast 2025-2030 ($ million)
Chart on Chile - Year-over-year growth 2025-2030 (%)
Data Table on Chile - Year-over-year growth 2025-2030 (%)

12.8 Market opportunity by geography

Market opportunity by geography ($ million)
Data Tables on Market opportunity by geography ($ million)

13. Drivers, Challenges, and Opportunity

13.1 Market drivers

Growing adoption of high-speed rail by emerging economies
Rising need for safety in railways
Increase in government initiatives and long-term projects

13.2 Market challenges

High initial capital investment in railways
Increasing competition between railways and low-cost airlines
Issues related to data management

13.3 Impact of drivers and challenges

Impact of drivers and challenges in 2025 and 2030

13.4 Market opportunities

Development of battery-operated electric trains
Increasing adoption of IoT in railways
Rise in key consolidation activities

14. Competitive Landscape

14.1 Overview

14.2

Overview on criticality of inputs and factors of differentiation

14.3 Landscape disruption

Overview on factors of disruption

14.4 Industry risks

Impact of key risks on business

15. Competitive Analysis

15.1 Companies profiled

Companies covered

15.2 Company ranking index

15.3 Market positioning of companies

Matrix on companies position and classification

15.4 ALSTOM SA

ALSTOM SA - Overview
ALSTOM SA - Business segments
ALSTOM SA - Key offerings
ALSTOM SA - Segment focus
SWOT

15.5 CAF Group

CAF Group - Overview
CAF Group - Product / Service
CAF Group - Key offerings
SWOT

15.6 duagon AG

duagon AG - Overview
duagon AG - Product / Service
duagon AG - Key offerings
SWOT

15.7 HIMA Paul Hildebrandt GmbH

HIMA Paul Hildebrandt GmbH - Overview
HIMA Paul Hildebrandt GmbH - Product / Service
HIMA Paul Hildebrandt GmbH - Key offerings
SWOT

15.8 Hitachi Ltd.

Hitachi Ltd. - Overview
Hitachi Ltd. - Business segments
Hitachi Ltd. - Key offerings
Hitachi Ltd. - Segment focus
SWOT

15.9 Intel Corp.

Intel Corp. - Overview
Intel Corp. - Business segments
Intel Corp. - Key news
Intel Corp. - Key offerings
Intel Corp. - Segment focus
SWOT

15.10 Knorr Bremse AG

Knorr Bremse AG - Overview
Knorr Bremse AG - Business segments
Knorr Bremse AG - Key offerings
Knorr Bremse AG - Segment focus
SWOT

15.11 Leonardo S.p.A.

Leonardo S.p.A. - Overview
Leonardo S.p.A. - Business segments
Leonardo S.p.A. - Key offerings
Leonardo S.p.A. - Segment focus
SWOT

15.12 Mitsubishi Electric Corp.

Mitsubishi Electric Corp. - Overview
Mitsubishi Electric Corp. - Business segments
Mitsubishi Electric Corp. - Key offerings
Mitsubishi Electric Corp. - Segment focus
SWOT

15.13 Nokia Corp.

Nokia Corp. - Overview
Nokia Corp. - Business segments
Nokia Corp. - Key offerings
Nokia Corp. - Segment focus
SWOT

15.14 Schaltbau GmbH Group

Schaltbau GmbH Group - Overview
Schaltbau GmbH Group - Product / Service
Schaltbau GmbH Group - Key offerings
SWOT

15.15 Siemens AG

Siemens AG - Overview
Siemens AG - Business segments
Siemens AG - Key news
Siemens AG - Key offerings
Siemens AG - Segment focus
SWOT

15.16 Stadler Rail Ag

Stadler Rail Ag - Overview
Stadler Rail Ag - Business segments
Stadler Rail Ag - Key offerings
Stadler Rail Ag - Segment focus
SWOT

15.17 Thales Group

Thales Group - Overview
Thales Group - Business segments
Thales Group - Key offerings
Thales Group - Segment focus
SWOT

15.18 Wabtec Corp.

Wabtec Corp. - Overview
Wabtec Corp. - Business segments
Wabtec Corp. - Key offerings
Wabtec Corp. - Segment focus
SWOT

16. Appendix

16.1 Scope of the report

Market definition
Objectives
Notes and caveats

16.2 Inclusions and exclusions checklist

Inclusions checklist
Exclusions checklist

16.3 Currency conversion rates for US$

16.4 Research methodology

16.5 Data procurement

Information sources

16.6 Data validation

16.7 Validation techniques employed for market sizing

16.8 Data synthesis

16.9 360 degree market analysis

16.10 List of abbreviations

Research Methodology

Technavio presents a detailed picture of the market by way of study, synthesis, and summation of data from multiple sources. The analysts have presented the various facets of the market with a particular focus on identifying the key industry influencers. The data thus presented is comprehensive, reliable, and the result of extensive research, both primary and secondary.

INFORMATION SOURCES

Primary sources

  • Manufacturers and suppliers
  • Channel partners
  • Industry experts
  • Strategic decision makers

Secondary sources

  • Industry journals and periodicals
  • Government data
  • Financial reports of key industry players
  • Historical data
  • Press releases

DATA ANALYSIS

Data Synthesis

  • Collation of data
  • Estimation of key figures
  • Analysis of derived insights

Data Validation

  • Triangulation with data models
  • Reference against proprietary databases
  • Corroboration with industry experts

REPORT WRITING

Qualitative

  • Market drivers
  • Market challenges
  • Market trends
  • Five forces analysis

Quantitative

  • Market size and forecast
  • Market segmentation
  • Geographical insights
  • Competitive landscape

Interested in this report?

Get your sample now to see our research methodology and insights!

Download Now

Frequently Asked Questions

Train Collision Avoidance System market growth will increase by USD 20036.7 million during 2026-2030.

The Train Collision Avoidance System market is expected to grow at a CAGR of 18.5% during 2026-2030.

Train Collision Avoidance System market is segmented by Application (Freight trains, Passenger trains) Technology (Radar-based systems, Sensor-based systems, Camera-based systems) Type (High-speed rail, Metro rail, Regional rail, Intercity rail, Freight rail)

4AI Systems, ALSTOM SA, CAF Group, duagon AG, ERZIA Technologies, Frauscher Sensor Technology, HBL Power Systems Ltd., HIMA Paul Hildebrandt GmbH, Hitachi Ltd., Intel Corp., Knorr Bremse AG, Leonardo S.p.A., Medha Servo Drives Pvt. Ltd., Mitsubishi Electric Corp., Nokia Corp., Schaltbau GmbH Group, Siemens AG, Stadler Rail Ag, Thales Group, Wabtec Corp. are a few of the key vendors in the Train Collision Avoidance System market.

Europe will register the highest growth rate of 33.2% among the other regions. Therefore, the Train Collision Avoidance System market in Europe is expected to garner significant business opportunities for the vendors during the forecast period.

Germany, UK, France, Italy, Spain, The Netherlands, US, Canada, Mexico, China, Japan, India, South Korea, Australia, Indonesia, Saudi Arabia, UAE, South Africa, Israel, Turkey, Brazil, Argentina, Chile

  • Growing adoption of high-speed rail by emerging economies is the driving factor this market.

The Train Collision Avoidance System market vendors should focus on grabbing business opportunities from the Application segment as it accounted for the largest market share in the base year.
RIA - Research AI Assistant
Ask RIA