US Shapewear Market Size 2024-2028
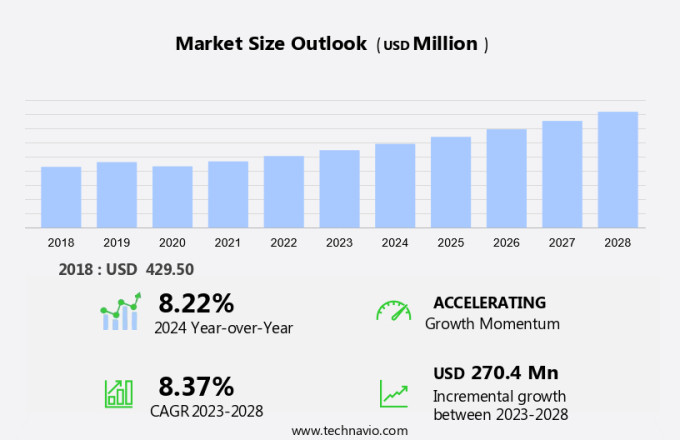
The US shapewear market size is forecast to increase by USD 270.4 million, at a CAGR of 8.37% between 2023 and 2028. The shapewear market is experiencing significant growth, driven by several key trends and factors. One notable trend is the increasing emphasis on sustainable clothing, leading to the launch of eco-friendly shapewear made from recycled materials. Another growth factor is the continuous introduction of new products by market vendors, catering to diverse body types and preferences. However, the rise of counterfeit shapewear products poses a challenge to market players, requiring stringent measures to protect intellectual property and maintain consumer trust. Overall, the shapewear market is expected to continue its growth trajectory, fueled by these trends and the evolving consumer demand for comfort, style, and sustainability.
What will be the Size of the Market During the Forecast Period?
For More Highlights About this Report, Request Free Sample
Market Dynamic and Customer Landscape
The market is a significant segment of the global apparel industry, focusing on health and fitness. Shapewear includes various types of garments designed to shape, contour, and support different body parts such as humpback, bosom prolapse, pail waist, fat buttock, and flat hip. These garments come in various forms, including Shaping Bodysuits, Shaping Camisoles, Shaping Briefs, Panties, Waist Cinchers, Thigh Shapers, Shaping Bras, Shaping Leggings, Shaping Skirts, Back Support Shapers, and more. Specialty stores, lingerie brands, and online retailers cater to this market. The semi-urban market is witnessing growth due to increasing health consciousness and the desire for a slim and toned figure. Gen-Z cohorts are particularly interested in body-sculpting swimwear, Bodysuits, Girdles, Corsets, Control Panties, Control Tights, and Control Slips. Shapewear is not just about aesthetics but also addresses medical conditions like bosom flat and provides back support. The market is expected to continue its growth trajectory due to these factors.
Key Market Driver
Increasing emphasis on sustainable clothing is notably driving market growth. The market is witnessing significant growth due to the increasing focus on health and fitness. Consumers are seeking solutions to address various body concerns such as humpback, bosom prolapse, and bulky legs. Shapewear, including compression wear, body shapers, and gym wear, offers effective solutions for these issues. Semi-urban areas are emerging as key markets for shapewear, with millennials and Generation Z leading the demand. Materials like spandex, lycra, neoprene, nylon, and other sustainable fabrics are commonly used in the production of shapewear. These materials offer benefits such as lessened appetite, pail waist, and flat hips.
Moreover, shapewear comes in various forms, including shaping bodysuits, shaping camisoles, shaping briefs, panties, waist cinchers, thigh shapers, shaping bras, shaping leggings, and shaping skirts. Back support shapers are also popular, especially for those with bladder prolapse. Consumers are increasingly conscious of the environmental impact of their clothing choices and are seeking out eco-friendly options. Sustainable materials and production processes are becoming essential considerations in the purchase of shapewear. Ethical manufacturing practices and transparent supply chains are also important factors influencing consumer decisions. Overall, the market is expected to continue growing, driven by these trends and the ongoing demand for effective and sustainable solutions for body shaping and support. Thus, such factors are driving the growth of the market during the forecast period.
Significant Market Trends
Growing launches of new products by market vendors is the key trend in the market. The market is witnessing significant growth due to the increasing focus on fitness and health among consumers. Brands are expanding their product offerings to cater to various consumer needs, from everyday wear to specialized items such as post-surgical garments and maternity shapewear. The semi-urban market is experiencing a surge in demand, with consumers seeking solutions for issues like humpback, bosom prolapse, and bulky legs. Shapewear brands are launching cost-effective items like Shaping Bodysuits, Shaping Camisoles, Shaping Briefs, Panties, Waist Cinchers, Thigh Shapers, Shaping Bras, Shaping Leggings, and shaping skirts made from materials like spandex, lycra, neoprene, and nylon. These garments provide support for the bust, waist, hips, and thighs, helping consumers achieve a desirable body shape.
Moreover, the market is catering to a diverse customer base by offering a wide range of sizes and skin tones. For instance, in April 2024, Shapellx introduced its new INNER ARMOR shapewear collection, which includes garments for tummy control, helping consumers flatten and smooth their stomach areas. Millennials and Generation Z are also driving the demand for shapewear as they prioritize fitness and health, and value convenience and affordability. Back support shapers are gaining popularity as consumers seek to alleviate issues like bladder prolapse and lessened appetite. Store-based and non-store-based retailers are stocking these items, making them easily accessible to consumers. Overall, the market is expected to continue its growth trajectory, driven by consumer demand and innovative product offerings. Thus, such trends will shape the growth of the market during the forecast period.
Major Market Challenge
The rise of counterfeit shapewear products is the major challenge that affects the growth of the market. The market in the US is witnessing a surge in demand due to the growing focus on fitness and health. The semi-urban population is particularly driving this trend, with an increasing number of individuals seeking to address various body concerns such as humpback, bosom prolapse, and bulky legs. Shapewear, also known as compression wear, comes in various forms, including shaping bodysuits, camisoles, shaping briefs, panties, waist cinchers, thigh shapers, shaping bras, shaping leggings, and shaping skirts. These garments are made from materials like spandex, lycra, neoprene, and nylon, and are available both in store-based and non-store-based retail outlets. However, the market faces a significant challenge from counterfeit shapewear products. These counterfeit items not only harm legitimate businesses but also pose health risks to consumers. They are often made from substandard materials that can cause skin irritation, allergic reactions, and other health issues.
Additionally, they bypass the rigorous safety and quality testing conducted by legitimate brands, potentially damaging their reputation. The existence of counterfeit products also creates confusion among consumers, making it difficult for them to distinguish between genuine and fake items. Millennials and Generation Z, in particular, are vulnerable to counterfeit shapewear due to their preference for cost-effective items and online shopping. It is essential for consumers to be vigilant and ensure they purchase shapewear from reputable brands to avoid any potential health risks and ensure the effectiveness of the product in achieving their desired body shaping goals. Hence, the above factors will impede the growth of the market during the forecast period
Exclusive Customer Landscape
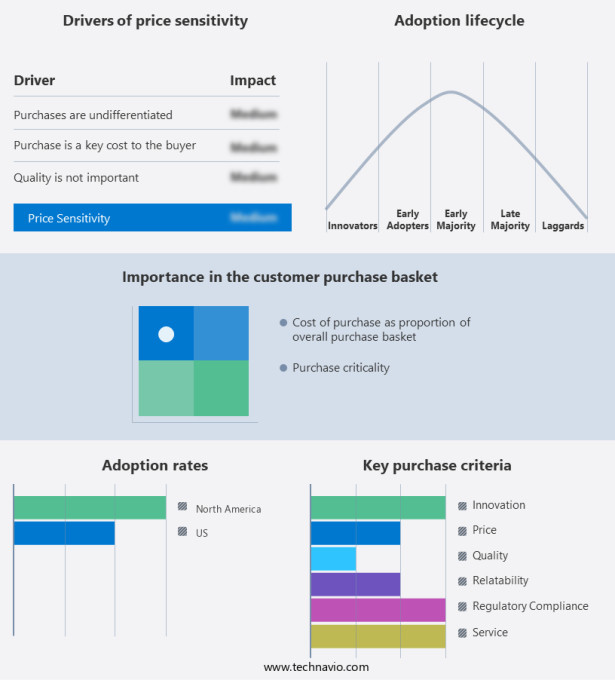
The market forecasting report includes the adoption lifecycle of the market, covering from the innovator’s stage to the laggard’s stage. It focuses on adoption rates in different regions based on penetration. Furthermore, the report also includes key purchase criteria and drivers of price sensitivity to help companies evaluate and develop their market growth analysis strategies.
Customer Landscape
Key Companies & Market Insights
Companies are implementing various strategies, such as strategic alliances, partnerships, mergers and acquisitions, geographical expansion, and product/service launches, to enhance their presence in the market.
- CALIDA HOLDING AG - The company is offering shapewear such as high waist thong shapewear under the brand Cosabella.
The market research and growth report also includes detailed analyses of the competitive landscape of the market and information about key companies, including:
- Boston Proper LLC
- Commando LLC
- Essity AB
- Fashion Nova LLC
- Fosun International Ltd.
- Hanesbrands Inc.
- Honeylove Sculptwear Inc.
- Miraclesuit
- Natori
- Page Industries Ltd.
- Shapellx
- Shapermint
- Skims Body Inc.
- Spanx LLC
- TechStyle Fashion Group
- Vedette Store
- Victorias Secret and Co.
- Wacoal Holdings Corp.
- Yummie
Qualitative and quantitative analysis of companies has been conducted to help clients understand the wider business environment as well as the strengths and weaknesses of key market players. Data is qualitatively analyzed to categorize companies as pure play, category-focused, industry-focused, and diversified; it is quantitatively analyzed to categorize companies as dominant, leading, strong, tentative, and weak.
Market Segmentation
By Product
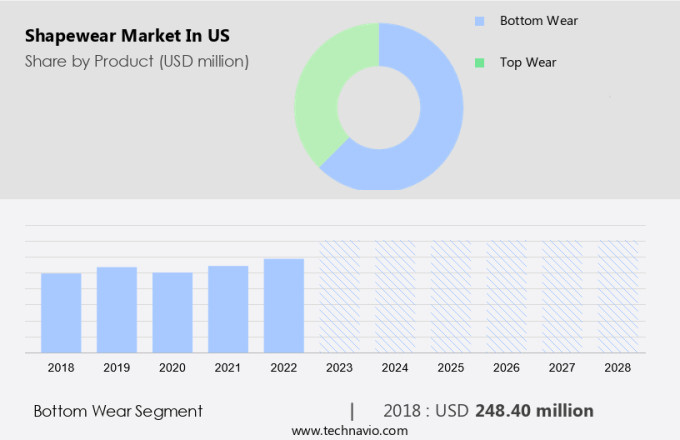
The bottom wear segment is estimated to witness significant growth during the forecast period. Changes in fashion trends heavily influence the demand for different shapewear styles and designs in bottom wear, such as jeans, leggings, skirts, and shorts. Seasonal trends affect demand, with items like shorts and skirts being more popular in warmer months and jeans and leggings in cooler months. The demand for comfortable fabrics, such as stretchable and breathable materials, is on the rise as consumers prioritize comfort. The availability of diverse sizes and fits to cater to different body types increases demand. Customizable and inclusive sizing options are particularly appealing.
Get a glance at the market share of various segments Download the PDF Sample
The bottom wear segment was the largest and was valued at USD 248.40 million in 2018. Moreover, the rise in remote work has increased the demand for comfortable and casual bottom wear in shapewear like leggings and joggers. Growth in the fitness and wellness culture boosts demand for shapewear bottoms, including yoga pants, compression leggings, and running shorts. The popularity of tight-fitting jeans and trousers increases the demand for shapewear that provides a smooth, seamless look. Trends such as high-waisted jeans and skirts drive demand for shapewear that targets the waist, hips, and thighs. For instance, Honeylove Sculptwear Inc. offers a range of shapewear styles in bottom wear, including shorts, briefs, thongs, and queen briefs. Thus, these factors will promote the growth of the bottom wear segment of the market during the forecast period.
Segment Overview
The market research report provides comprehensive data (region-wise segment analysis), with forecasts and estimates in "USD Million " for the period 2024-2028, as well as historical data from 2018 - 2022 for the following segments.
- Product Outlook
- Bottom Wear
- Top Wear
- End-user Outlook
- Female
- Male
- Distribution Channel Outlook
- Offline
- Online
You may also interested in below market reports:
- Compression Wear and Shapewear Market - Compression Wear and Shapewear Market Analysis North America, Europe, APAC, South America, Middle East and Africa - US, UK, Germany, China, Japan - Size and Forecast
- Maternity Support Products Market - Maternity Support Products Market Analysis North America, Europe, APAC, Middle East and Africa, South America - US, China, Australia, Germany, UK - Size and Forecast
- Lingerie Market - Lingerie Market - North America, Europe, EMEA, APAC: US, Canada, China, Germany, UK - Forecast
Market Analyst Overview
The market is witnessing significant growth due to the increasing focus on fitness and health. Semi-urban areas are witnessing a surge in demand for shapewear as people seek to address various health concerns such as humpback, bosom prolapse, and Bladder prolapse. Shapewear, including body shapers, shaping bodysuits, shaping camisoles, shaping briefs, panties, waist cinchers, thigh shapers, shaping bras, shaping leggings, shaping skirts, back support shapers, and more, are popular choices for those looking to lessen appetite, achieve a pail waist, flatten a fat buttock, or reduce the appearance of bulky leg and turnip leg. Compression wear, made from materials like spandex, lycra, neoprene, nylon, and others, is a key segment of the market. The market is segmented into store-based and non-store-based sales channels. Millennials and Generation Z are major consumers of shapewear, particularly gym wear and exercise facilities, as they prioritize health and fitness. Cost-effective items, such as shaping camisoles and panties, are also gaining popularity. Overall, the market is expected to continue its growth trajectory in the coming years.
|
Market Scope |
|
|
Report Coverage |
Details |
|
Page number |
162 |
|
Base year |
2023 |
|
Historic period |
2018 - 2022 |
|
Forecast period |
2024-2028 |
|
Growth momentum & CAGR |
Accelerate at a CAGR of 8.37% |
|
Market growth 2024-2028 |
USD 270.4 million |
|
Market structure |
Fragmented |
|
YoY growth 2023-2024(%) |
8.22 |
|
Competitive landscape |
Leading Companies, Market Positioning of Companies, Competitive Strategies, and Industry Risks |
|
Key companies profiled |
Boston Proper LLC, CALIDA HOLDING AG, Commando LLC, Essity AB, Fashion Nova LLC, Fosun International Ltd., Hanesbrands Inc., Honeylove Sculptwear Inc., Miraclesuit, Natori, Page Industries Ltd., Shapellx, Shapermint, Skims Body Inc., Spanx LLC, TechStyle Fashion Group, Vedette Store, Victorias Secret and Co., Wacoal Holdings Corp., and Yummie |
|
Market dynamics |
Parent market analysis, Market growth inducers and obstacles, Fast-growing and slow-growing segment analysis, COVID-19 impact and recovery analysis and future consumer dynamics, Market condition analysis for the market forecast period |
|
Customization purview |
If our market report has not included the data that you are looking for, you can reach out to our analysts and get segments customized. |
What are the Key Data Covered in this Market Research Report?
- CAGR of the market during the forecast period
- Detailed information on factors that will drive the market growth and forecasting between 2024 and 2028
- Precise estimation of the size of the market and its contribution of the market in focus to the parent market
- Accurate predictions about upcoming market growth and trends and changes in consumer behavior
- Growth of the market across US
- Thorough analysis of the market’s competitive landscape and detailed information about companies
- Comprehensive analysis of factors that will challenge the growth of market companies


