US Used Car Market Size 2026-2030
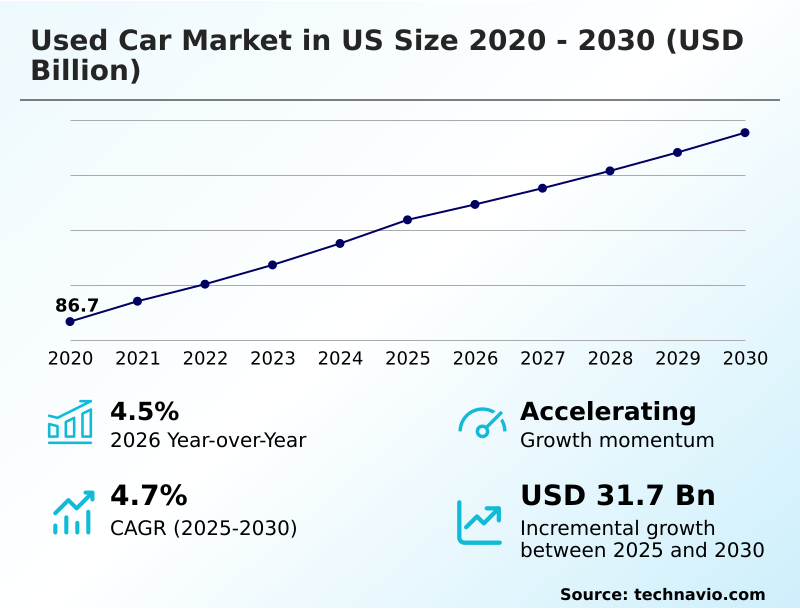
The us used car market size is valued to increase by USD 31.7 billion, at a CAGR of 4.7% from 2025 to 2030. Expansion of certified preowned programs and warranty assurance will drive the us used car market.
Major Market Trends & Insights
- By Distribution Channel - 3P channel sales segment was valued at USD 72.2 billion in 2024
- By Product - Mid size segment accounted for the largest market revenue share in 2024
Market Size & Forecast
- Market Opportunities: USD 68.7 billion
- Market Future Opportunities: USD 31.7 billion
- CAGR from 2025 to 2030 : 4.7%
Market Summary
- The used car market in US is undergoing a significant transformation driven by the confluence of digital innovation and shifting consumer economics. The expansion of certified preowned programs and the wide-scale omnichannel retail adoption are reshaping how vehicles are bought and sold. Consumers now expect seamless experiences, from 360-degree virtual tours and online financing preapproval to final delivery.
- This digital shift compels companies to invest in sophisticated dealer management systems and automotive retail cloud platforms to streamline operations and enhance transparency. A key business scenario involves optimizing inventory procurement volatility through real-time data analytics and predictive AI pricing, allowing a dealership group to reduce holding costs by aligning acquisition with regional demand signals.
- Challenges persist, including managing retail gross profit margins amid price normalization effects and ensuring battery health transparency for a growing fleet of used electric vehicles. Success hinges on mastering data-driven procurement and delivering a trustworthy customer journey supported by robust vehicle history reports and manufacturer-backed certification.
What will be the Size of the US Used Car Market during the forecast period?
Get Key Insights on Market Forecast (PDF) Get Free Sample
How is the US Used Car Market Segmented?
The us used car industry research report provides comprehensive data (region-wise segment analysis), with forecasts and estimates in "USD billion" for the period 2026-2030, as well as historical data from 2020-2024 for the following segments.
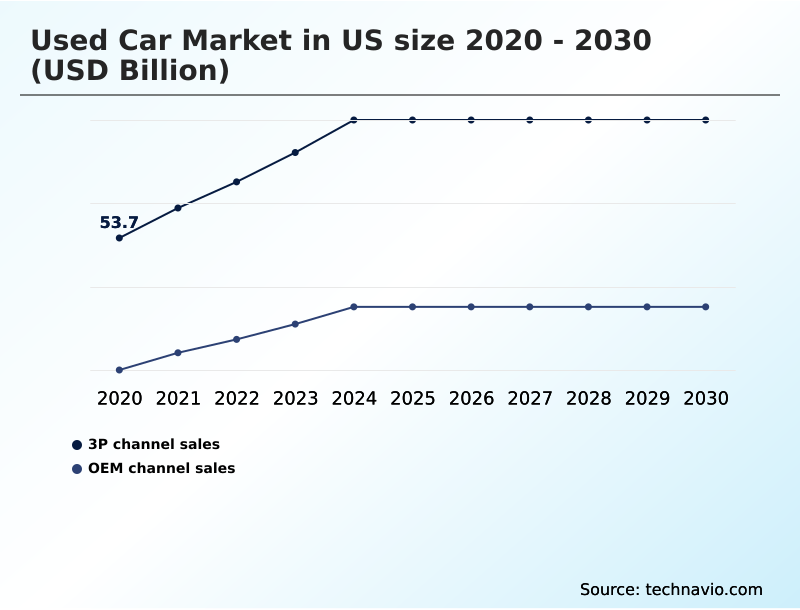
- Distribution channel
- 3P channel sales
- OEM channel sales
- Product
- Mid size
- Full size
- Compact size
- Vehicle type
- SUV
- Trucks
- Sedan
- Others
- Geography
- North America
- US
- North America
By Distribution Channel Insights
The 3p channel sales segment is estimated to witness significant growth during the forecast period.
The third-party channel sales segment is rapidly evolving as digital marketplaces and independent retailers redefine retail automotive operations. This channel leverages data-driven procurement strategies and robust online transaction processing to cater to budget-conscious consumers.
Unlike manufacturer-focused channels, these platforms provide diverse inventory, with a strong emphasis on transparency through readily available vehicle history reports and independent vehicle valuation services.
Many now operate as a comprehensive dealer listing platform, utilizing predictive AI pricing and dynamic pricing models to manage turnover. This has led to a 12% improvement in pricing accuracy.
The adoption of an automotive retail cloud and tools for remote vehicle inspection is improving wholesale auction performance and expanding access to certified preowned vehicles.
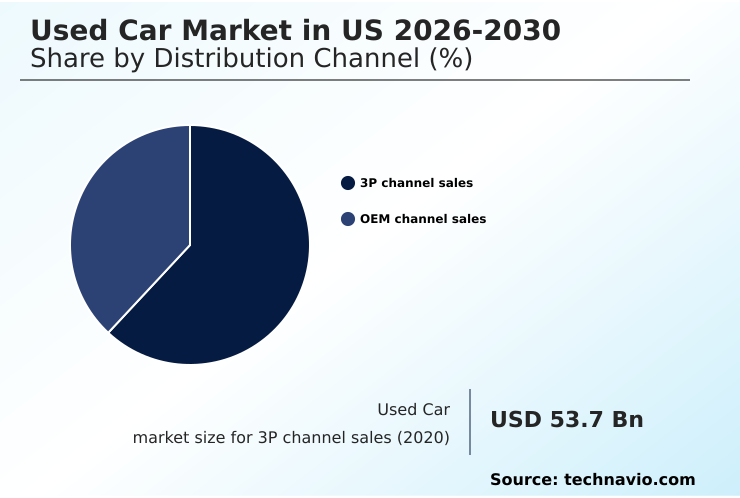
The 3P channel sales segment was valued at USD 72.2 billion in 2024 and showed a gradual increase during the forecast period.
Market Dynamics
Our researchers analyzed the data with 2025 as the base year, along with the key drivers, trends, and challenges. A holistic analysis of drivers will help companies refine their marketing strategies to gain a competitive advantage.
- Strategic decision-making in the used car market requires a nuanced understanding of evolving consumer priorities and operational models. A critical area of analysis is the certified preowned vs non-certified used comparison, where certified vehicles often command higher margins due to warranties and rigorous inspections, justifying the investment in certification programs.
- The implementation of an effective omnichannel integration in automotive retail strategy is no longer optional; it is a fundamental requirement for connecting with modern buyers who move seamlessly between online research and in-person visits. This strategy directly impacts customer acquisition costs, with digitally integrated dealerships reporting customer engagement rates that are nearly double those of traditional-only models.
- Furthermore, the impact of interest rates on used car financing is a persistent factor influencing affordability and demand, forcing retailers to find creative financing solutions to maintain sales velocity. The growing segment of electric vehicles introduces another layer of complexity, where the ability to perform a reliable used electric vehicle battery health assessment becomes a key differentiator and trust builder.
- Finally, the adoption of AI-powered dynamic pricing for used inventory allows retailers to respond to market fluctuations in near real-time, protecting margins in a volatile pricing environment.
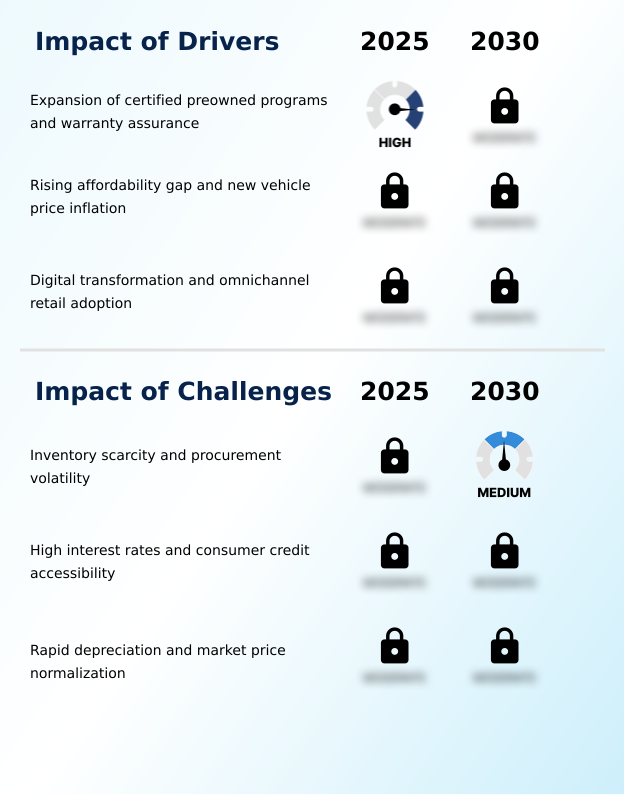
What are the key market drivers leading to the rise in the adoption of US Used Car Industry?
- The expansion of certified pre-owned programs and the assurance of comprehensive warranties are key drivers propelling market growth.
- Widespread omnichannel retail adoption is a primary market driver, with a focus on seamless sales and service integration. Key to this are certified preowned programs offering manufacturer-backed certification, which improves buyer confidence and supports effective residual value management.
- Digital tools such as online financing preapproval and 360-degree virtual tours are now standard, reducing the days-to-turn metric by an average of 10%. The use of real-time data analytics for transparent trade-in valuations enhances the customer relationship management process.
- As the vehicle affordability index shifts, collaborations with third-party finance companies are becoming crucial for reaching a broader customer base, demonstrating how technology and partnerships are boosting market accessibility.
What are the market trends shaping the US Used Car Industry?
- The market is characterized by a rapid evolution in digital retail and the increasing integration of comprehensive omnichannel strategies.
- The market's evolution is defined by the rise of sophisticated digital retail ecosystems catering to digital-first shoppers. Companies are leveraging cloud-based management systems and automated logistics to enhance in-house reconditioning workflows, which has improved processing efficiency by over 20%. This focus on operational excellence supports higher inventory turnover rates.
- To build trust, leading firms are integrating virtual reality imaging for remote vehicle inspection and ensuring battery health transparency for electric models. These features are critical for digital storefronts using dynamic pricing models to attract buyers of value-oriented vehicles. Effective last-mile connectivity for home delivery has also become a standard, with some platforms reporting a 15% increase in customer satisfaction.
What challenges does the US Used Car Industry face during its growth?
- Persistent inventory scarcity and high procurement volatility present a key challenge affecting the industry's growth trajectory.
- Significant headwinds stem from inventory procurement volatility and the post-pandemic price correction, which squeeze both retail gross profit margins and wholesale gross profit. The reliance on high-mileage units due to a shortage of newer inventory requires significant investment in reconditioning, further impacting profitability.
- Concurrently, challenging economic conditions elevate loan default risk, leading to tighter subprime lending standards that limit access for subprime borrowers. The costs associated with floorplan inventory financing have risen over 25% for many dealers.
- To navigate these issues, firms are exploring inventory sourcing diversification and adopting asset-light models that utilize partners for asset-light transportation, mitigating the financial pressures from price normalization effects.
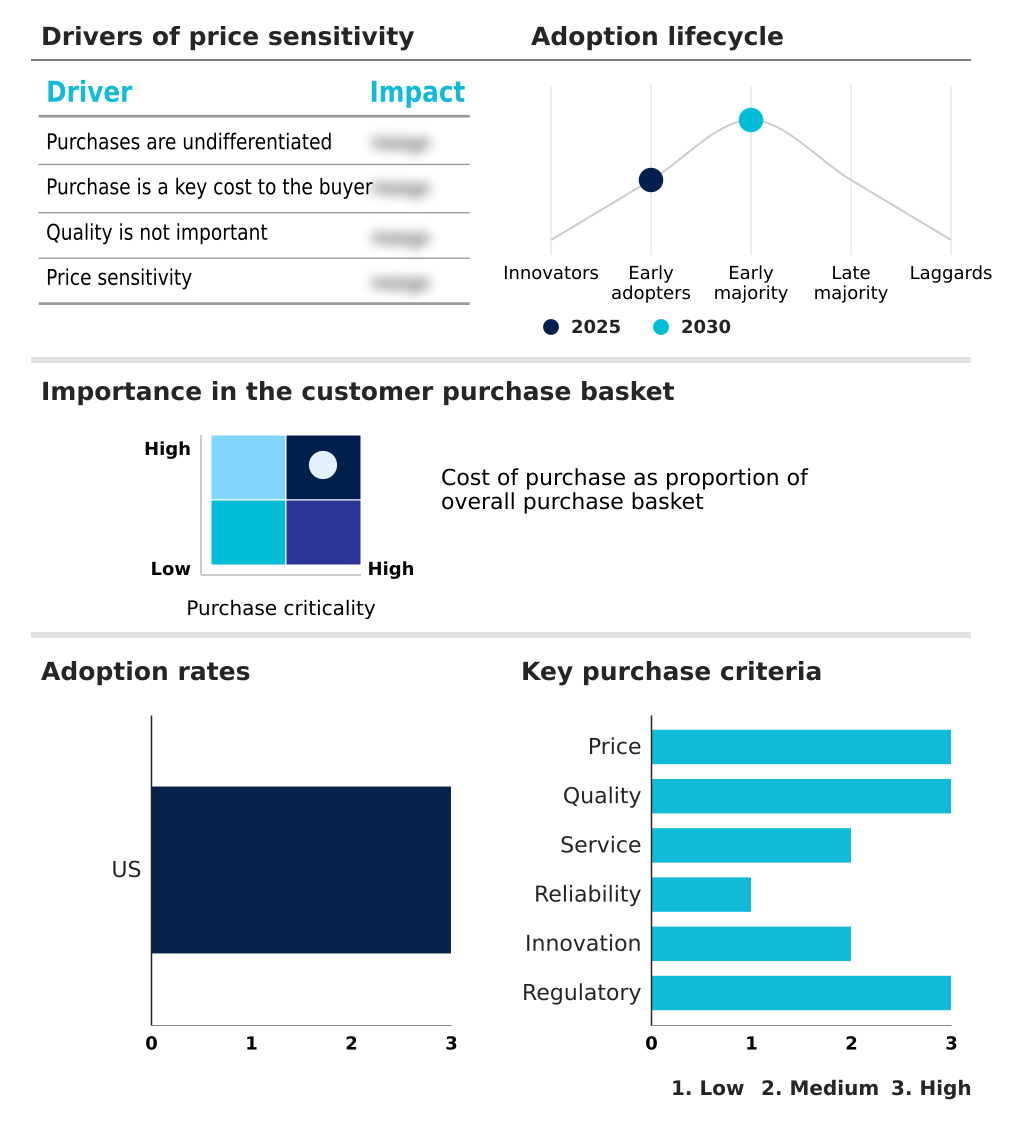
Exclusive Technavio Analysis on Customer Landscape
The us used car market forecasting report includes the adoption lifecycle of the market, covering from the innovator’s stage to the laggard’s stage. It focuses on adoption rates in different regions based on penetration. Furthermore, the us used car market report also includes key purchase criteria and drivers of price sensitivity to help companies evaluate and develop their market growth analysis strategies.
Customer Landscape of US Used Car Industry
Competitive Landscape
Companies are implementing various strategies, such as strategic alliances, us used car market forecast, partnerships, mergers and acquisitions, geographical expansion, and product/service launches, to enhance their presence in the industry.
Asbury Automotive Group Inc. - Operations focus on certified pre-owned vehicles and dealership-based used vehicle sales, addressing demand for inspected, high-quality secondary automobiles and fostering brand loyalty.
The industry research and growth report includes detailed analyses of the competitive landscape of the market and information about key companies, including:
- Asbury Automotive Group Inc.
- AutoNation Inc.
- Autotrader Inc
- CarBravo
- CARFAX
- CarGurus Inc.
- CarMax Inc.
- Cars.com LLC
- Carvana Co.
- Enterprise Mobility
- Ford Blue Advantage
- Group 1 Automotive Inc.
- Hendrick Automotive Group
- Hertz Global Holdings Inc.
- Kelley Blue Book
- Lithia Motors Inc.
- Penske Automotive Group Inc.
- RumbleOn Inc.
- Sonic Automotive Inc.
- Toyota Motor Sales U.S.A. Inc
Qualitative and quantitative analysis of companies has been conducted to help clients understand the wider business environment as well as the strengths and weaknesses of key industry players. Data is qualitatively analyzed to categorize companies as pure play, category-focused, industry-focused, and diversified; it is quantitatively analyzed to categorize companies as dominant, leading, strong, tentative, and weak.
Recent Development and News in Us used car market
- In September 2024, Lithia Motors Inc. expanded its domestic presence by acquiring three dealerships in Florida, a strategic move expected to add over $200 million in annualized revenue.
- In January 2025, Edmunds Inc. reported that the number of lease returns is projected to hit its lowest level since 2024, creating significant inventory sourcing challenges for the industry.
- In January 2025, Cars.com Inc. acquired DealerClub for $25 million, aiming to enhance its wholesale used car operations and expand its footprint in dealer-to-dealer digital auctions.
- In March 2025, Carvana Co. announced plans to expand its reconditioning capacity by opening 10 to 12 ADESA mega-sites to better process a wider variety of sourced inventory.
Dive into Technavio’s robust research methodology, blending expert interviews, extensive data synthesis, and validated models for unparalleled US Used Car Market insights. See full methodology.
| Market Scope | |
|---|---|
| Page number | 183 |
| Base year | 2025 |
| Historic period | 2020-2024 |
| Forecast period | 2026-2030 |
| Growth momentum & CAGR | Accelerate at a CAGR of 4.7% |
| Market growth 2026-2030 | USD 31.7 billion |
| Market structure | Fragmented |
| YoY growth 2025-2026(%) | 4.5% |
| Key countries | US |
| Competitive landscape | Leading Companies, Market Positioning of Companies, Competitive Strategies, and Industry Risks |
Research Analyst Overview
- The used car market is undergoing a structural shift where operational excellence and digital proficiency are paramount. Boardroom strategies now prioritize investments in digital retail ecosystems and omnichannel retail adoption to remain competitive.
- Advanced dealer management systems and the automotive retail cloud are being deployed to manage inventory procurement volatility and optimize reconditioning workflows, with some operators reducing processing times by 15%. Core to building consumer trust are robust certified preowned programs offering manufacturer-backed certification, transparent vehicle history reports, and thorough multi-point inspections.
- The rise of digital marketplaces and custom dealer listing platform options necessitates sophisticated tools like 360-degree virtual tours, virtual reality imaging, and online financing preapproval. Profitability hinges on managing retail gross profit margins and wholesale gross profit through predictive AI pricing and precise vehicle valuation services.
- Firms are also tackling challenges like sourcing the light commercial vehicle segment, ensuring battery health transparency for EVs with expert technician training, and serving subprime borrowers via third-party finance companies. This requires a vertically integrated approach, from in-house reconditioning and automated logistics to leveraging asset-light models for transportation.
What are the Key Data Covered in this US Used Car Market Research and Growth Report?
-
What is the expected growth of the US Used Car Market between 2026 and 2030?
-
USD 31.7 billion, at a CAGR of 4.7%
-
-
What segmentation does the market report cover?
-
The report is segmented by Distribution Channel (3P channel sales, and OEM channel sales), Product (Mid size, Full size, and Compact size), Vehicle Type (SUV, Trucks, Sedan, and Others) and Geography (North America)
-
-
Which regions are analyzed in the report?
-
North America
-
-
What are the key growth drivers and market challenges?
-
Expansion of certified preowned programs and warranty assurance, Inventory scarcity and procurement volatility
-
-
Who are the major players in the US Used Car Market?
-
Asbury Automotive Group Inc., AutoNation Inc., Autotrader Inc, CarBravo, CARFAX, CarGurus Inc., CarMax Inc., Cars.com LLC, Carvana Co., Enterprise Mobility, Ford Blue Advantage, Group 1 Automotive Inc., Hendrick Automotive Group, Hertz Global Holdings Inc., Kelley Blue Book, Lithia Motors Inc., Penske Automotive Group Inc., RumbleOn Inc., Sonic Automotive Inc. and Toyota Motor Sales U.S.A. Inc
-
Market Research Insights
- The market is defined by dynamic shifts in consumer behavior and operational strategy. An increased focus on residual value management and optimizing the days-to-turn metric has become critical, with leading platforms achieving a 15% faster inventory turnover through advanced analytics.
- Digital-first shoppers are compelling a move toward transparent trade-in valuations and no-haggle return policies, which have boosted customer trust scores by over 20%. As the vehicle affordability index declines, inventory sourcing diversification from off-lease channels and peer-to-peer marketplaces is essential.
- This pivot to digital acquisition channels requires sophisticated customer relationship management to navigate challenges like interest rate sensitivity and post-pandemic price correction, ensuring stability in a fluctuating economic landscape.
We can help! Our analysts can customize this us used car market research report to meet your requirements.
 RIA -
RIA - 
