Vertical Garden Construction Market Size 2025-2029
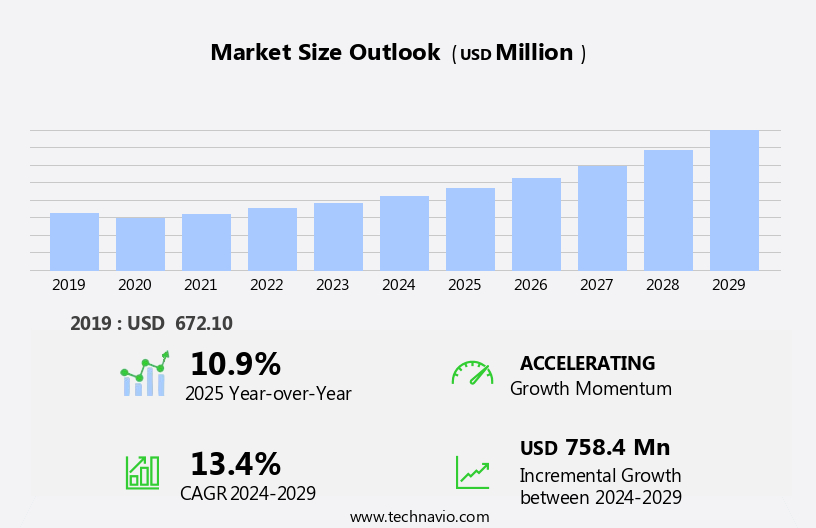
The vertical garden construction market size is forecast to increase by USD 758.4 million, at a CAGR of 13.4% between 2024 and 2029.
- The market is experiencing significant growth due to the increasing adoption of green building construction and the promotion of indoor agriculture. This trend is driven by the growing awareness of sustainable living and the need for efficient use of urban space. However, the high initial investment required for vertical garden construction remains a notable challenge. This includes the cost of materials, installation, and maintenance. Despite this obstacle, companies can capitalize on the market's potential by offering cost-effective solutions and partnering with real estate developers and architects to integrate vertical gardens into their projects.
- Additionally, the market's future growth is expected to be fueled by advancements in technology, leading to the development of more cost-effective and efficient vertical garden systems. Overall, the market presents a lucrative opportunity for companies seeking to innovate and provide sustainable solutions for urban living and agriculture.
What will be the Size of the Vertical Garden Construction Market during the forecast period?
Explore in-depth regional segment analysis with market size data - historical 2019-2023 and forecasts 2025-2029 - in the full report.
Request Free Sample
The market continues to evolve, driven by the increasing demand for sustainable and space-efficient farming solutions. Wall-mounted systems and indoor farming are gaining popularity, offering energy efficiency and waste reduction. Seed starting and plant propagation are integral parts of this process, requiring precise climate control and nutrient monitoring. Growth media, such as coco coir, play a crucial role in substrate management and yield optimization. Precision agriculture and machine vision technology enable real-time data analytics, optimizing crop growth and product quality. Retail channels and distribution networks are adapting to meet consumer demand, integrating vertical farm design and urban farming into their offerings.
Capital investment in vertical farming systems is on the rise, with automated irrigation and environmental control systems becoming standard. Building materials and structural engineering are also evolving to accommodate these innovative farming solutions. Disease management and pest control are essential considerations, with temperature and humidity sensors providing vital data. Food safety and security are paramount, with IoT and AI in agriculture offering solutions for efficient water management and crop rotation. LED grow lights and post-harvest handling systems ensure optimal product quality. Operational costs and harvesting techniques are continually being optimized, with modular farming units offering scalable solutions. Vertical farming systems are revolutionizing food production, offering a sustainable alternative to traditional farming methods.
The market's continuous dynamism is reflected in the ongoing development of smart farming technologies and the integration of technology into all aspects of vertical garden construction.
How is this Vertical Garden Construction Industry segmented?
The vertical garden construction industry research report provides comprehensive data (region-wise segment analysis), with forecasts and estimates in "USD million" for the period 2025-2029, as well as historical data from 2019-2023 for the following segments.
- Type
- Outdoor
- Indoor
- Application
- Residential
- Commercial
- Product
- Green wall vertical garden
- Green facades vertical garden
- Freestanding vertical garden
- Others
- Material
- Soil-based systems
- Hydroponic systems
- Mineral wool systems
- Recycled and biodegradable materials
- Geography
- North America
- US
- Canada
- Europe
- France
- Germany
- UK
- APAC
- China
- India
- Japan
- Malaysia
- South Korea
- Rest of World (ROW)
- North America
By Type Insightsdata analytics
The outdoor segment is estimated to witness significant growth during the forecast period.
The market is experiencing significant growth, particularly in the wall-mounted systems segment. Energy efficiency and sustainability are key drivers, as these systems reduce waste and optimize supply chains. Seed starting and indoor farming are gaining popularity, enabling year-round production and improved food security. Capital investment in advanced technologies, such as data analytics, machine vision, and climate control systems, is essential for optimizing growth rates and product quality. Plant species selection and disease management are critical factors in vertical farming, with urban farming and rooftop gardens contributing to the trend. Building materials must be durable and lightweight, while water management and nutrient requirements are crucial for maintaining optimal growing conditions.
Automated irrigation systems and substrate management ensure efficient use of resources. Food safety, pest control, and temperature sensors are essential components of vertical farming systems, ensuring a consistent yield and product quality. The integration of IoT in agriculture, precision agriculture, and smart farming practices further enhances operational efficiency and productivity. Vertical farming economics, distribution networks, and crop rotation strategies are crucial for ensuring long-term success. Urban farming, modular farming units, and retail channels are transforming the food production landscape, with living walls and green roofs adding to the aesthetic appeal and environmental benefits. The market is expected to continue growing, driven by consumer demand and the need for sustainable, efficient, and innovative food production solutions.
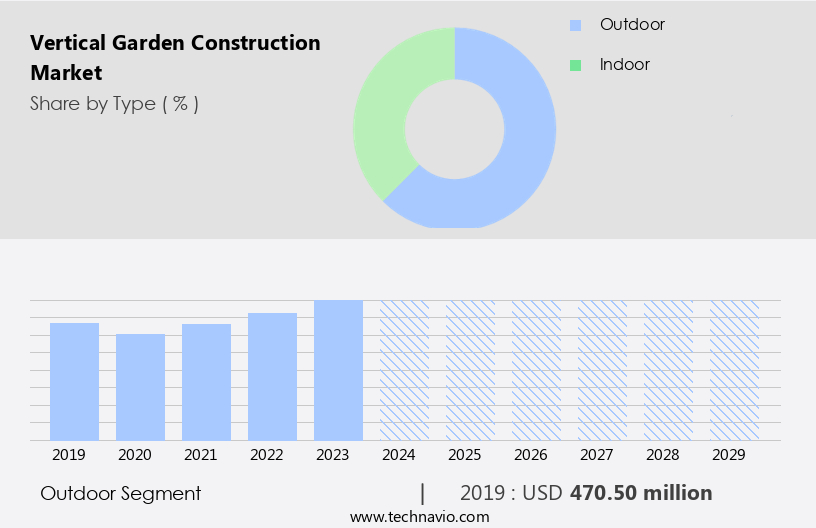
The Outdoor segment was valued at USD 470.50 million in 2019 and showed a gradual increase during the forecast period.
Regional Analysis
APAC is estimated to contribute 47% to the growth of the global market during the forecast period.Technavio's analysts have elaborately explained the regional trends and drivers that shape the market during the forecast period.
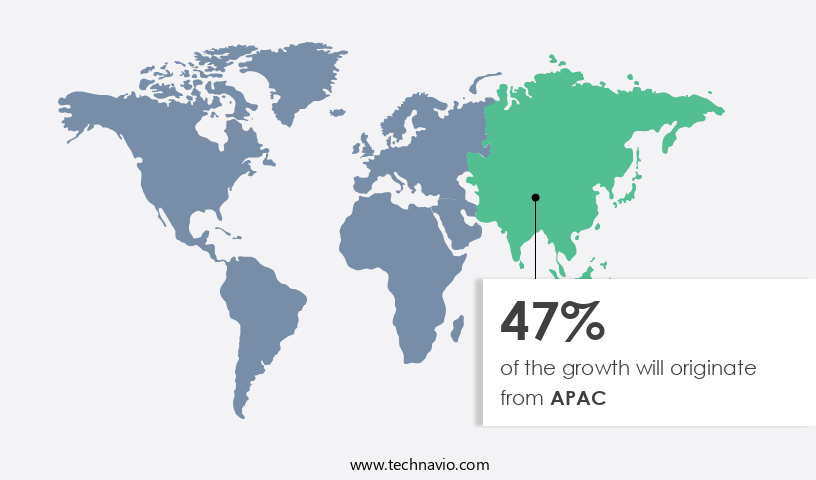
The market is experiencing significant growth, particularly in the Asia Pacific (APAC) region. With increasing consumer demand for energy-efficient and sustainable solutions, wall-mounted systems are gaining popularity for decorating small urban spaces. In APAC, countries such as China, India, Singapore, and Australia are driving market growth through their adoption of green practices. These nations are undergoing a real estate boom due to urbanization and rising disposable income, creating a fertile ground for vertical garden installations. The market is still in its developmental stage, requiring government initiatives to promote its use and foster a sustainable future.
Indoor farming, seed starting, and waste reduction are key areas of focus, with machine vision, climate control, and water management playing crucial roles in optimizing operations. Plant species selection, nutrient monitoring, and pest control are essential for maintaining product quality and ensuring food safety. Capital investment in vertical farming systems, including automated irrigation and environmental control, is essential for large-scale operations. IoT technology and AI in agriculture are revolutionizing the industry by providing real-time data analytics and precision agriculture techniques. Urban farming, rooftop gardens, and modular farming units are also gaining traction as innovative solutions for space-constrained environments.
The use of growth media like coco coir and substrate management is essential for optimal growth rates. Yield optimization and crop rotation are critical for maintaining a sustainable vertical farming ecosystem. LED grow lights, temperature sensors, and humidity sensors are essential for controlling the ideal growing conditions. Vertical gardens are not only aesthetically pleasing but also contribute to food security and food production. The market's future looks promising, with distribution networks and retail channels adapting to the trend. Smart farming and green roofs are expected to become increasingly prevalent as the industry continues to evolve.
Market Dynamics
Our researchers analyzed the data with 2024 as the base year, along with the key drivers, trends, and challenges. A holistic analysis of drivers will help companies refine their marketing strategies to gain a competitive advantage.
In the thriving market, businesses and homeowners seek innovative solutions to enhance urban landscapes and promote eco-friendly practices. Vertical gardens, also known as green walls, offer numerous benefits, including air purification, temperature regulation, and noise reduction. Constructing a vertical garden involves various components, such as irrigation systems, growing media, and vegetation selection. Modern technologies, including hydroponics and aeroponics, facilitate water conservation and optimize plant growth. Vertical garden construction materials include lightweight, durable options like aluminum, fiber cement, and stainless steel. Design considerations include structural integrity, waterproofing, and ease of maintenance. Vertical gardens can be installed indoors or outdoors, in both residential and commercial settings, and cater to various plant species, from succulents to vines. With increasing environmental awareness and the desire for sustainable living spaces, the market continues to expand.
What are the key market drivers leading to the rise in the adoption of Vertical Garden Construction Industry?
- The increasing prevalence of green building construction is the primary market catalyst, driven by growing awareness and adoption of sustainable and energy-efficient structures.
- Vertical gardens, an integral part of green buildings, offer numerous benefits such as energy savings and indoor air purification. These gardens contribute to LEED certification, a global green building recognition system, by earning credit points for energy reduction and other essential parameters. LEED certification has four tiers - certified, silver, gold, and platinum. Vertical garden construction involves operational costs related to substrate management and harvesting techniques. Smart farming technologies, including IoT in agriculture, AI, and CO2 sensors, optimize these processes. Structural engineering is crucial to ensure the vertical farming system's stability. Pest control is another essential aspect, requiring careful planning and implementation.
- Urban farming through vertical gardens is gaining popularity due to the limited space in urban areas. Vertical farming systems enable food production in densely populated cities, contributing to local food distribution networks and reducing the carbon footprint of transportation. Smart farming technologies enhance the efficiency of these systems, making them an attractive investment for businesses.
What are the market trends shaping the Vertical Garden Construction Industry?
- Indoor agriculture through vertical gardens is gaining popularity as a market trend. This innovative approach to farming combines the benefits of greenery with sustainable food production.
- Vertical gardens, also known as living walls, have gained popularity for their aesthetic appeal and environmental benefits. These gardens, built on structures such as rooftops and walls, absorb pollutants and provide a cooling effect. With increasing environmental concerns, governments worldwide are encouraging vertical garden construction through mandates and norms. Indoor agriculture, a significant application of vertical gardens, requires precise farming techniques and technologies to manage variables such as nutrient monitoring, light requirements, and water needs. Recent research and development in this field have brought production costs close to those of outdoor farming. Coco coir, a sustainable growing medium, is commonly used in vertical farming due to its excellent water retention properties.
- Modular farming units and precision agriculture techniques enable crop rotation and optimal yield, ensuring high-quality produce. Post-harvest handling, including temperature and humidity control, is crucial for maintaining product quality. Advanced technologies like LED grow lights and water requirements management systems further enhance yield optimization and efficiency. In summary, the market is witnessing significant growth due to its environmental benefits and potential for indoor agriculture applications. Technological advancements in indoor farming are driving production costs down, making it a viable alternative to traditional farming methods. Coco coir, precision agriculture, and advanced technologies are key components of this evolving market.
What challenges does the Vertical Garden Construction Industry face during its growth?
- The vertical garden construction industry faces significant growth impediments due to the high initial investment required.
- The market faces a notable challenge due to the substantial initial investment required. Establishing a vertical garden involves significant expenses, encompassing structural materials, irrigation systems, growth media, and labor. For example, the iFarm vertical farm rack technology costs around USD 1,000 per square meter, while the Florafelt system, featuring fully felted walls with plantable pockets, ranges from USD 30 to USD 80 per square foot. The irrigation system can add an additional USD 400 to USD 800 to the installation cost. These expenses accumulate rapidly, particularly for extensive projects, making the upfront investment a considerable hurdle. Energy efficiency, seed starting, waste reduction, and supply chain optimization are driving factors in the market.
- Indoor farming, data analytics, and water management are essential aspects of vertical garden design, contributing to the growth rate. Machine vision technology plays a crucial role in optimizing plant species selection and growth conditions. Consumer demand for sustainable and eco-friendly solutions continues to increase, further fueling market growth. Despite the initial investment, the long-term benefits, including energy savings, reduced water usage, and improved air quality, make vertical gardens a valuable investment for businesses and homeowners alike.
Exclusive Customer Landscape
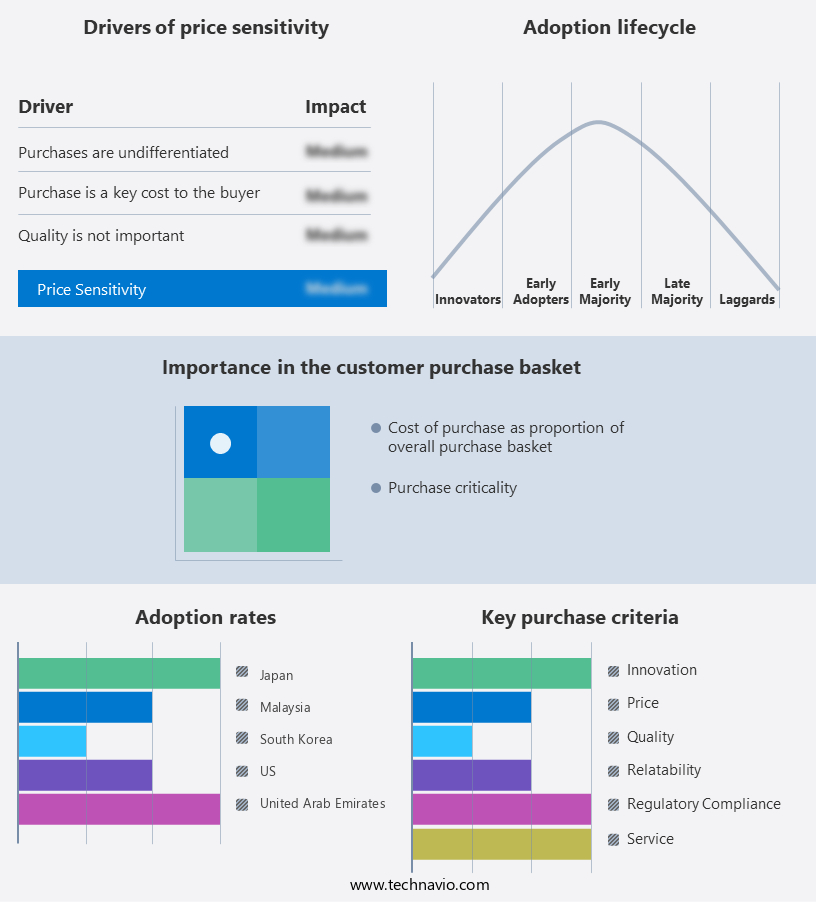
The vertical garden construction market forecasting report includes the adoption lifecycle of the market, covering from the innovator's stage to the laggard's stage. It focuses on adoption rates in different regions based on penetration. Furthermore, the vertical garden construction market report also includes key purchase criteria and drivers of price sensitivity to help companies evaluate and develop their market growth analysis strategies.
Customer Landscape
Key Companies & Market Insights
Companies are implementing various strategies, such as strategic alliances, vertical garden construction market forecast, partnerships, mergers and acquisitions, geographical expansion, and product/service launches, to enhance their presence in the industry.
A Lawn and Landscape - Specializing in vertical garden design and installation, we transform indoor and outdoor spaces with visually striking, eco-friendly vertical gardens.
The industry research and growth report includes detailed analyses of the competitive landscape of the market and information about key companies, including:
- A Lawn and Landscape
- ANS Global
- Atlantis Corp. Australia Pty Ltd.
- Biotecture Ltd.
- Elmich Australia Pty Ltd.
- Ferntastica Gardens Ltd.
- Four Leaf Landscape Pvt. Ltd.
- Fytogreen Pty Ltd.
- GreenWalls Group
- GSky
- JKD HortiTech
- Rentokil Initial Plc
- Sempergreen Vertical Systems BV
- Smart Biotiles Inc.
- Vertical Garden Solutions
- VERTICAL GARDENS SLU
- Vertical Green
- ZTC International Landscape Solutions P Ltd.
Qualitative and quantitative analysis of companies has been conducted to help clients understand the wider business environment as well as the strengths and weaknesses of key industry players. Data is qualitatively analyzed to categorize companies as pure play, category-focused, industry-focused, and diversified; it is quantitatively analyzed to categorize companies as dominant, leading, strong, tentative, and weak.
Recent Development and News in Vertical Garden Construction Market
- In January 2024, GreenSpace Technologies, a leading player in the market, announced the launch of its new modular vertical garden system, VertiGrow, at the World of Concrete trade show in Las Vegas (GreenSpace Technologies Press Release, 2024). This innovative product offers customizable design options and improved water efficiency, positioning GreenSpace as a pioneer in sustainable vertical gardening solutions.
- In March 2024, VertiCultivate, a US-based vertical farming company, entered into a strategic partnership with Botanic Gardens Conservation International (BGCI), a global organization dedicated to plant conservation. The collaboration aimed to integrate vertical gardens into BGCI's green infrastructure projects, promoting biodiversity and urban sustainability (VertiCultivate Press Release, 2024).
- In May 2024, VertiFarm, a leading European vertical farming company, acquired BioGrow, a Dutch vertical garden construction firm, for â¬20 million. This acquisition expanded VertiFarm's product portfolio and strengthened its presence in the European market (VertiFarm Press Release, 2024).
- In February 2025, the city of Paris announced a new policy to require the installation of vertical gardens on all new buildings over 3,000 square meters in size. This initiative, aimed at improving air quality and reducing the urban heat island effect, is expected to create significant demand for vertical garden construction services (City of Paris Press Release, 2025).
Research Analyst Overview
- The market is experiencing significant advancements, driven by the integration of technology and modular designs. Yield prediction and plant health diagnostics are key areas of focus, with smart sensors and data logging enabling precise nutrient optimization and disease detection. Building codes and safety regulations are shaping the market, ensuring infrastructure compliance and consumer safety. Investment returns are a major consideration for businesses, with marketing strategies and financing options playing crucial roles in project success. Business planning and project management tools, such as growth simulation models and remote monitoring, are essential for efficient operations. Maintenance services, water usage monitoring, and energy consumption monitoring are also critical components of vertical garden construction, with certification standards and training programs ensuring quality and expertise.
- Supply chain partnerships and technology integration are driving innovation, with automated harvesting robots and prefabricated systems streamlining construction processes. Risk assessment and business planning software are valuable market analysis tools, providing valuable insights into market trends and consumer preferences.
Dive into Technavio's robust research methodology, blending expert interviews, extensive data synthesis, and validated models for unparalleled Vertical Garden Construction Market insights. See full methodology.
|
Market Scope |
|
|
Report Coverage |
Details |
|
Page number |
242 |
|
Base year |
2024 |
|
Historic period |
2019-2023 |
|
Forecast period |
2025-2029 |
|
Growth momentum & CAGR |
Accelerate at a CAGR of 13.4% |
|
Market growth 2025-2029 |
USD 758.4 million |
|
Market structure |
Fragmented |
|
YoY growth 2024-2025(%) |
10.9 |
|
Key countries |
US, Japan, Malaysia, South Korea, Germany, China, UK, France, India, and Canada |
|
Competitive landscape |
Leading Companies, Market Positioning of Companies, Competitive Strategies, and Industry Risks |
What are the Key Data Covered in this Vertical Garden Construction Market Research and Growth Report?
- CAGR of the Vertical Garden Construction industry during the forecast period
- Detailed information on factors that will drive the growth and forecasting between 2025 and 2029
- Precise estimation of the size of the market and its contribution of the industry in focus to the parent market
- Accurate predictions about upcoming growth and trends and changes in consumer behaviour
- Growth of the market across APAC, Europe, North America, South America, and Middle East and Africa
- Thorough analysis of the market's competitive landscape and detailed information about companies
- Comprehensive analysis of factors that will challenge the vertical garden construction market growth of industry companies
We can help! Our analysts can customize this vertical garden construction market research report to meet your requirements.
 RIA -
RIA - 
