Water And Wastewater Management Market Analysis, Size, and Forecast 2026-2030: North America (US, Canada, and Mexico), APAC (China, Japan, and India), Europe (Germany, UK, and France), South America (Brazil and Argentina), Middle East and Africa (Saudi Arabia, UAE, and South Africa), and Rest of World (ROW)

Water And Wastewater Management Market Analysis, Size, and Forecast 2026-2030:
North America (US, Canada, and Mexico), APAC (China, Japan, and India), Europe (Germany, UK, and France), South America (Brazil and Argentina), Middle East and Africa (Saudi Arabia, UAE, and South Africa), and Rest of World (ROW)

Published: Apr 2026 328 Pages SKU: IRTNTR45412

Market Overview at a Glance

$3.37 B
Market Opportunity
7.6%
CAGR 2025 - 2030
34.4%
North America Growth
$3.73 B
Water treatment segment 2024

Water And Wastewater Management Market Size 2026-2030

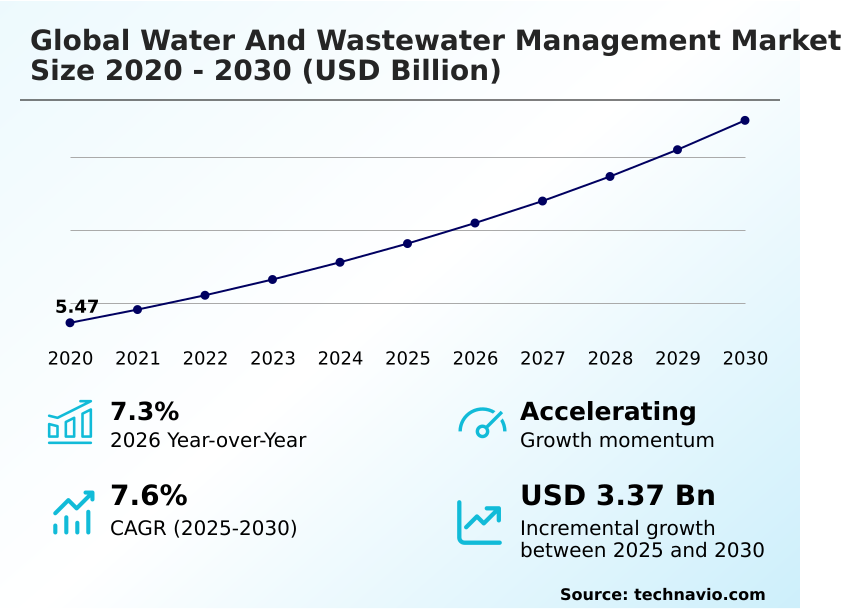
The water and wastewater management market size is valued to increase by USD 3.37 billion, at a CAGR of 7.6% from 2025 to 2030. Increasing water scarcity and global population growth will drive the water and wastewater management market.

Major Market Trends & Insights

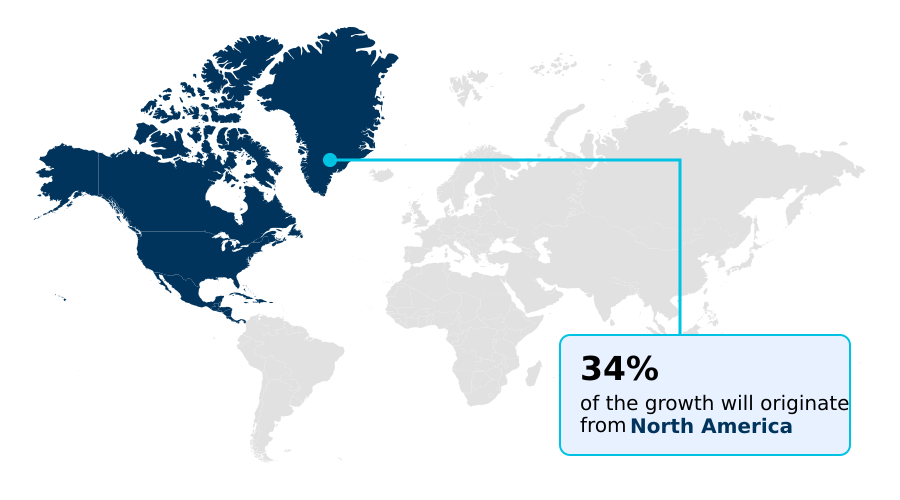
  • North America dominated the market and accounted for a 34.4% growth during the forecast period.
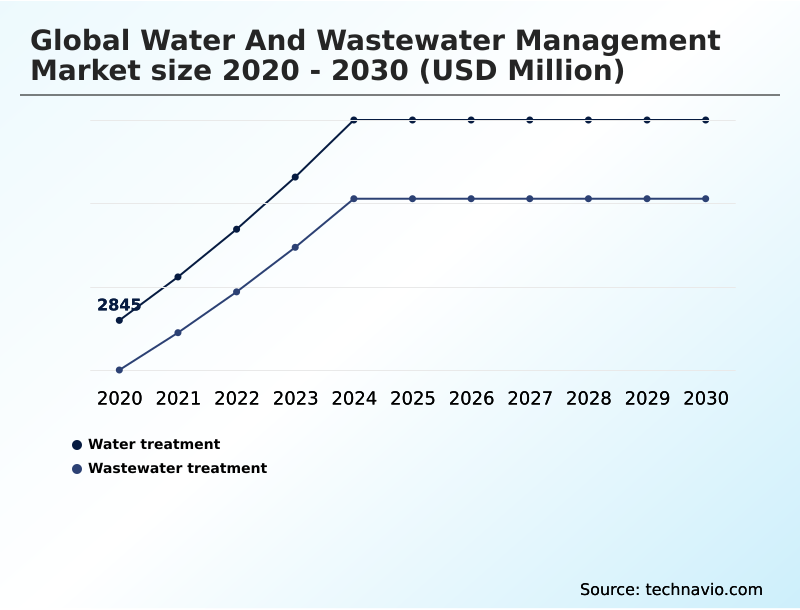
  • By Product - Water treatment segment was valued at USD 3.73 billion in 2024
  • By Type - Primary treatment segment accounted for the largest market revenue share in 2024

Market Size & Forecast

  • Market Opportunities: USD 5.52 billion
  • Market Future Opportunities: USD 3.37 billion
  • CAGR from 2025 to 2030 : 7.6%

Market Summary

  • The Water And Wastewater Management Market is experiencing a significant transformation, driven by the dual pressures of increasing water scarcity and stringent environmental regulations. Rapid urbanization, particularly in developing economies, is amplifying the need for new infrastructure and advanced wastewater treatment technology.
  • A key trend shaping the industry is the adoption of circular economy principles, where wastewater is increasingly viewed as a resource for water, energy, and nutrient recovery. This shift is supported by the integration of digital solutions, leading to the development of the smart water grid.
  • For instance, a municipal utility facing high operational costs and water loss can implement a network of advanced sensors and predictive maintenance analytics. This allows for real-time monitoring of the distribution network, enabling the utility to proactively identify leaks, optimize pumping schedules to reduce energy consumption, and extend the life of aging assets.
  • While the high capital expenditure for infrastructure modernization and the challenge of removing emerging contaminants remain, the move towards data-driven, resilient, and sustainable water management systems defines the current market landscape.

What will be the Size of the Water And Wastewater Management Market during the forecast period?

Get Key Insights on Market Forecast (PDF) Get Free Sample

How is the Water And Wastewater Management Market Segmented?

The water and wastewater management industry research report provides comprehensive data (region-wise segment analysis), with forecasts and estimates in "USD million" for the period 2026-2030, as well as historical data from 2020-2024 for the following segments.

  • Product
    • Water treatment
    • Wastewater treatment
  • Type
    • Primary treatment
    • Secondary treatment
    • Tertiary treatment
  • Application
    • Membrane separation
    • Biological
    • Disinfection
    • Sludge treatment
    • Others
  • End-user
    • Municipal
    • Industrial
  • Geography
    • North America
      • US
      • Canada
      • Mexico
    • APAC
      • China
      • Japan
      • India
    • Europe
      • Germany
      • UK
      • France
    • South America
      • Brazil
      • Argentina
    • Middle East and Africa
      • Saudi Arabia
      • UAE
      • South Africa
    • Rest of World (ROW)

By Product Insights

The water treatment segment is estimated to witness significant growth during the forecast period.

Market segmentation reveals distinct growth patterns, with the water treatment segment accounting for over 53% of the market. Within wastewater, the focus on resource recovery from wastewater is intensifying, driven by water scarcity.

Key processes like the sludge dewatering process and anaerobic digestion process are central to creating a water reclamation facility that can achieve zero liquid discharge.

Technologies enabling a nutrient recovery system and the production of biogas from sludge are transforming cost centers into revenue streams.

Furthermore, processes like dissolved air flotation and the ultraviolet disinfection system are critical for meeting drinking water standards, while advanced chemical dosing system designs improve efficiency in industrial water reuse and pollution control for agricultural irrigation and wastewater recycling.

Get Free Sample

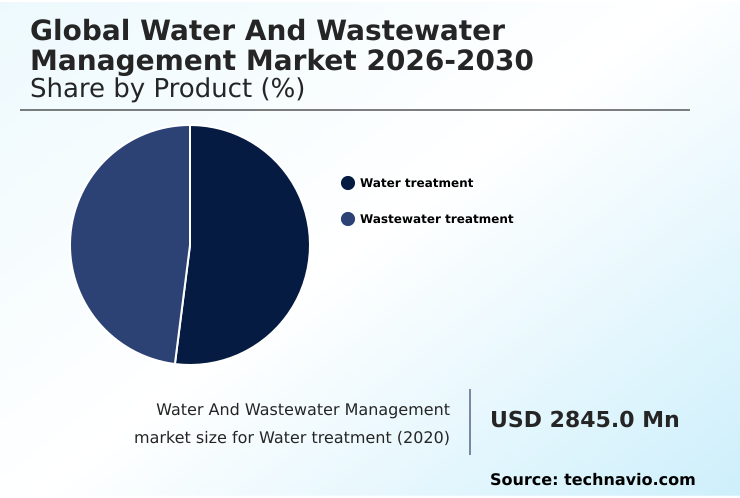
The Water treatment segment was valued at USD 3.73 billion in 2024 and showed a gradual increase during the forecast period.

Get Free Sample

Regional Analysis

North America is estimated to contribute 34.4% to the growth of the global market during the forecast period.Technavio’s analysts have elaborately explained the regional trends and drivers that shape the market during the forecast period.

See How Water And Wastewater Management Market Demand is Rising in North America Get Free Sample

The geographic landscape is diverse, with arid regions heavily investing in desalination technology and saline water conversion. In contrast, rapidly urbanizing areas are deploying decentralized water systems and modular wastewater plant solutions for flexible expansion.

Effective stormwater management solution and green infrastructure solutions are priorities in regions prone to extreme weather, contributing to surface water protection.

Investment in tertiary filtration process and biological nutrient removal is common in mature markets like APAC, which shows an 8% growth rate, to meet high effluent quality monitoring standards.

Technologies like the activated sludge process are being optimized for energy efficiency, while a focus on groundwater remediation and produced water treatment grows in industrial zones, requiring new approaches to financing urban water infrastructure projects.

Market Dynamics

Our researchers analyzed the data with 2025 as the base year, along with the key drivers, trends, and challenges. A holistic analysis of drivers will help companies refine their marketing strategies to gain a competitive advantage.

  • The strategic shift in the global water and wastewater management market is evident in the targeted approaches being adopted to address specific challenges. A growing focus is on deploying decentralized systems for rural sanitation, which offer a more scalable solution compared to extending centralized infrastructure.
  • For industries, the adoption of membrane technology for industrial reuse is becoming standard practice to ensure water security and compliance. In municipal sectors, the financial and environmental benefits of energy recovery from municipal sludge are driving investment in anaerobic digestion for biogas production.
  • The use of smart monitoring for leak detection is a key tactic in reducing the high cost of non-revenue water. Concurrently, significant R&D is directed at removing pharmaceuticals from wastewater and developing effective pfas remediation in drinking water.
  • The challenges in aging water infrastructure are being met with new financing urban water infrastructure projects and a focus on climate adaptation for water utilities. The benefits of digital twin technology are realized through automating water treatment plant processes and enabling biological treatment process optimization. Modular plants for community water are providing flexible solutions for new developments.
  • The efficacy of reverse osmosis in seawater desalination continues to improve, making it a viable solution for coastal regions. Ultimately, regulatory drivers for advanced treatment are pushing the entire sector toward a model of circular economy in wastewater management, where managing industrial wastewater discharge is seen as an opportunity for resource creation.
  • This integrated approach has been shown to improve operational resilience by a factor of two compared to traditional, linear models.

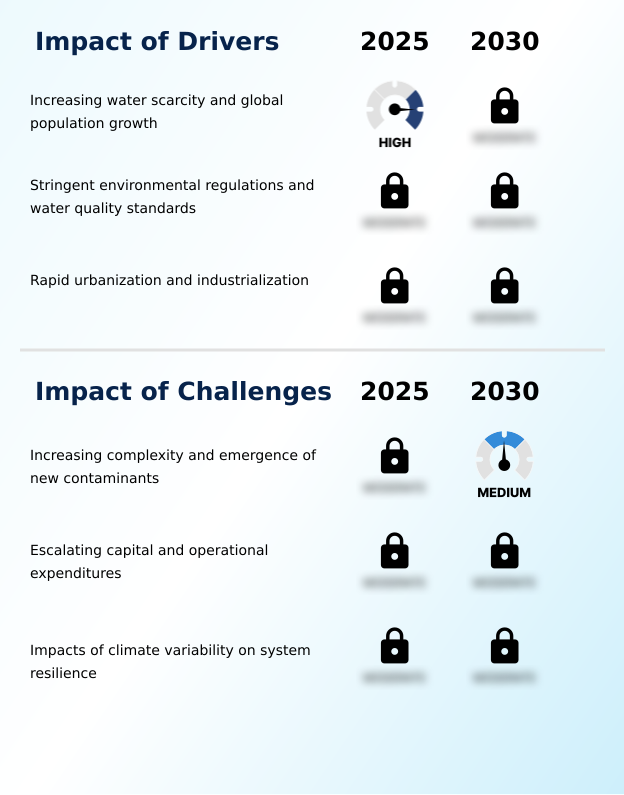
What are the key market drivers leading to the rise in the adoption of Water And Wastewater Management Industry?

  • Increasing water scarcity, compounded by global population growth, serves as a primary driver for the water and wastewater management market.

  • Stringent effluent discharge standards and the growing need for public health protection are primary market drivers. This necessitates significant water infrastructure investment in advanced wastewater treatment technology for both municipal sewage treatment and industrial effluent treatment.
  • Regulatory compliance management is pushing water-intensive industries toward adopting innovative solutions for pfas removal technology and ensuring effective potable water purification. To fund these extensive upgrades, public-private partnership models are becoming increasingly crucial.
  • The implementation of advanced metering infrastructure supports a cohesive water security strategy, providing the data needed for better resource allocation and contributing to the market's 7.3% year-over-year expansion while promoting environmental stewardship.

What are the market trends shaping the Water And Wastewater Management Industry?

  • The rise of digitalization and the development of smart water networks are emerging as a transformative market trend. This movement represents a fundamental shift toward intelligent, data-driven management of the entire water cycle.

  • The adoption of digital water solution platforms is a defining market trend, fostering the development of the smart water grid for enhanced urban water management. This shift, underpinned by circular economy principles, leverages membrane bioreactor technology and real-time water monitoring to achieve significant operational efficiency improvement.
  • Utilities are now able to achieve non-revenue water reduction by up to 25% through better leak detection. Furthermore, the integration of advanced oxidation process and reverse osmosis system technologies into sustainable water solutions enables greater water reuse, supporting integrated water resource management.
  • The use of hydraulic modeling software aids in data-driven decision making, optimizing system performance and improving forecast accuracy by over 18%.

What challenges does the Water And Wastewater Management Industry face during its growth?

  • The increasing complexity of waste streams and the emergence of new contaminants present a significant challenge to the industry's growth and operational capabilities.

  • The market faces significant challenges from the need for emerging contaminant removal, including microplastics filtration, and managing combined sewer overflow events. Building climate resilient infrastructure requires substantial capital expenditure planning, with life cycle cost analysis showing upgrade costs can be double that of new builds.
  • Water tariff structures often do not fully cover the costs of deploying advanced sensor technology and predictive maintenance analytics for asset performance management. While energy-efficient water treatment and biosolids management aim to reduce operational expenses, the initial investment remains a barrier.
  • This financial pressure complicates efforts toward a comprehensive water footprint reduction and the widespread adoption of effective point-of-use treatment solutions.

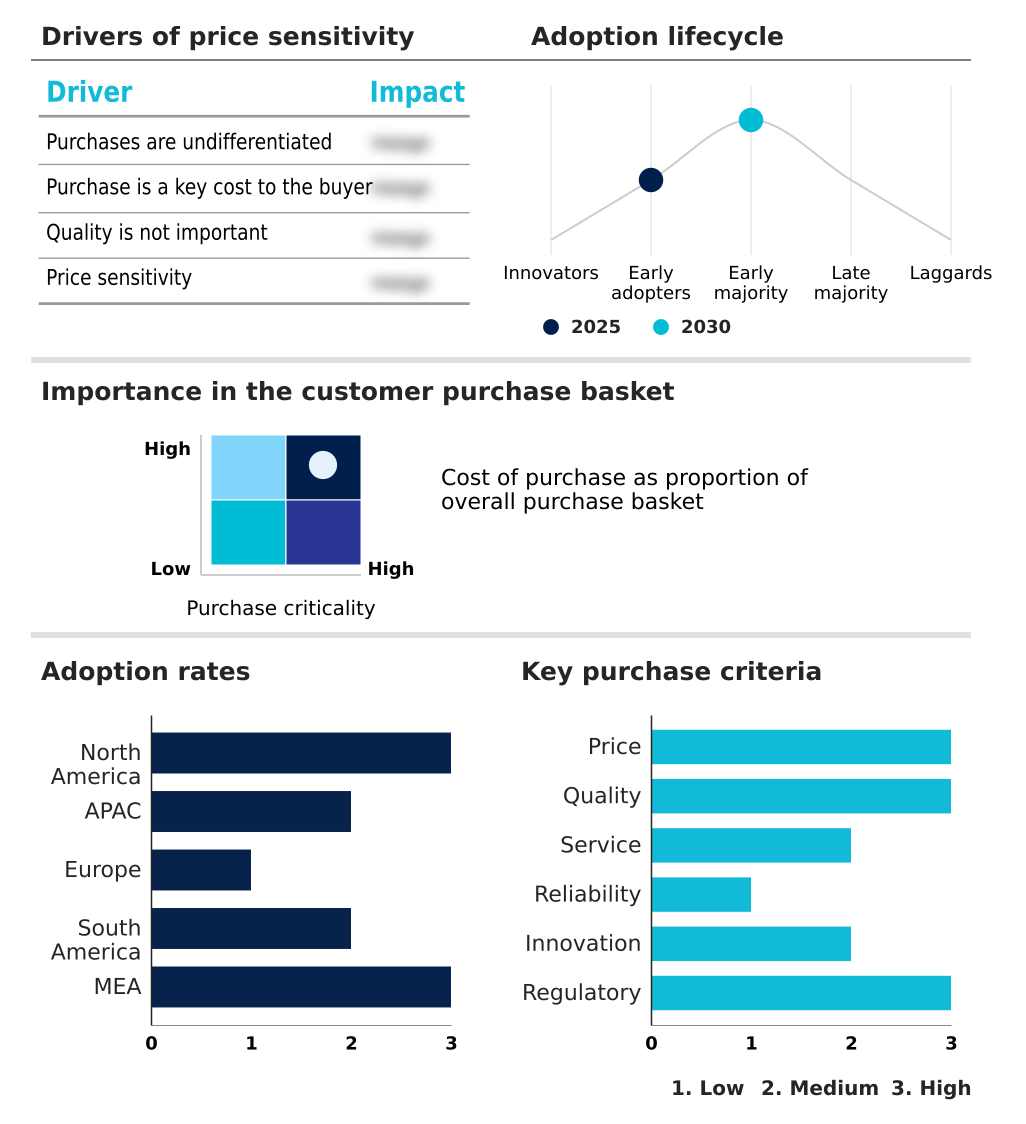
Exclusive Technavio Analysis on Customer Landscape

The water and wastewater management market forecasting report includes the adoption lifecycle of the market, covering from the innovator’s stage to the laggard’s stage. It focuses on adoption rates in different regions based on penetration. Furthermore, the water and wastewater management market report also includes key purchase criteria and drivers of price sensitivity to help companies evaluate and develop their market growth analysis strategies.

Customer Landscape of Water And Wastewater Management Industry

Competitive Landscape

Companies are implementing various strategies, such as strategic alliances, water and wastewater management market forecast, partnerships, mergers and acquisitions, geographical expansion, and product/service launches, to enhance their presence in the industry.

ABB Ltd. - Specializes in providing integrated automation and digital control technologies designed to optimize operational efficiency and reliability across the water and wastewater management lifecycle.

The industry research and growth report includes detailed analyses of the competitive landscape of the market and information about key companies, including:

  • ABB Ltd.
  • Acciona SA
  • Alfa Laval AB
  • Culligan International Co.
  • Danfoss AS
  • DuPont de Nemours Inc.
  • Ecolab Inc.
  • GEA Group AG
  • Grundfos Holding AS
  • Hitachi Ltd.
  • Jacobs Solutions Inc.
  • Kemira Oyj
  • KURARAY Co. Ltd.
  • Pentair Plc
  • Schneider Electric SE
  • Siemens AG
  • SUEZ SA
  • Sulzer Ltd.
  • Veolia Environment SA
  • Xylem Inc.

Qualitative and quantitative analysis of companies has been conducted to help clients understand the wider business environment as well as the strengths and weaknesses of key industry players. Data is qualitatively analyzed to categorize companies as pure play, category-focused, industry-focused, and diversified; it is quantitatively analyzed to categorize companies as dominant, leading, strong, tentative, and weak.

Recent Development and News in Water and wastewater management market

  • In February 2025, Xylem Inc. acquired Aqua-Analytics, a Canadian firm specializing in AI-powered leak detection, and subsequently partnered with Chicago to deploy this technology for reducing non-revenue water losses.
  • In March 2025, Veolia launched the Copenhagen Bio-Refinery, a facility designed to process the city's wastewater sludge for water reclamation and resource extraction, including phosphorus and biogas.
  • In April 2025, SUEZ secured a 30-year public-private partnership in Vietnam to design, build, and operate the Thu Duc Water Resilience Plant, a major wastewater treatment and recycling facility.
  • In May 2025, Siemens AG proposed its Building X Lifecycle Twin software as a service platform to the UK water sector to enhance asset lifecycle management and enable predictive maintenance.

Dive into Technavio’s robust research methodology, blending expert interviews, extensive data synthesis, and validated models for unparalleled Water And Wastewater Management Market insights. See full methodology.

Market Scope
Page number 328
Base year 2025
Historic period 2020-2024
Forecast period 2026-2030
Growth momentum & CAGR Accelerate at a CAGR of 7.6%
Market growth 2026-2030 USD 3366.8 million
Market structure Fragmented
YoY growth 2025-2026(%) 7.3%
Key countries US, Canada, Mexico, China, Japan, India, South Korea, Australia, Indonesia, Germany, UK, France, Italy, Spain, The Netherlands, Brazil, Argentina, Chile, Saudi Arabia, UAE, South Africa, Israel and Turkey
Competitive landscape Leading Companies, Market Positioning of Companies, Competitive Strategies, and Industry Risks

Request Free Sample

Research Analyst Overview

  • The market's evolution is defined by a push towards integrated wastewater treatment technology to achieve zero liquid discharge. A modern water reclamation facility now handles both industrial effluent treatment and municipal sewage treatment, utilizing processes from the activated sludge process to advanced membrane bioreactor technology and biological nutrient removal.
  • To meet effluent discharge standards, a tertiary filtration process and advanced oxidation process are key. Resource generation via the anaerobic digestion process yields biogas from sludge, complemented by a nutrient recovery system. The sludge dewatering process and dissolved air flotation reduce waste.
  • Boardroom decisions increasingly favor a comprehensive digital water solution, as a smart water grid can improve asset performance management by over 30%. This relies on real-time water monitoring and predictive maintenance analytics from advanced metering infrastructure. The reverse osmosis system is vital for potable water purification, while chemical dosing systems support process water treatment.
  • Managing combined sewer overflow requires a robust stormwater management solution, often using decentralized water systems and modular wastewater plant designs. The ultraviolet disinfection system and solutions for emerging contaminant removal, including pfas removal technology and microplastics filtration, are crucial for public health and non-revenue water reduction.

What are the Key Data Covered in this Water And Wastewater Management Market Research and Growth Report?

  • What is the expected growth of the Water And Wastewater Management Market between 2026 and 2030?

    • USD 3.37 billion, at a CAGR of 7.6%

  • What segmentation does the market report cover?

    • The report is segmented by Product (Water treatment, and Wastewater treatment), Type (Primary treatment, Secondary treatment, and Tertiary treatment), Application (Membrane separation, Biological, Disinfection, Sludge treatment, and Others), End-user (Municipal, and Industrial) and Geography (North America, APAC, Europe, South America, Middle East and Africa)

  • Which regions are analyzed in the report?

    • North America, APAC, Europe, South America and Middle East and Africa

  • What are the key growth drivers and market challenges?

    • Increasing water scarcity and global population growth, Increasing complexity and emergence of new contaminants

  • Who are the major players in the Water And Wastewater Management Market?

    • ABB Ltd., Acciona SA, Alfa Laval AB, Culligan International Co., Danfoss AS, DuPont de Nemours Inc., Ecolab Inc., GEA Group AG, Grundfos Holding AS, Hitachi Ltd., Jacobs Solutions Inc., Kemira Oyj, KURARAY Co. Ltd., Pentair Plc, Schneider Electric SE, Siemens AG, SUEZ SA, Sulzer Ltd., Veolia Environment SA and Xylem Inc.

Market Research Insights

  • Market dynamics are shaped by a strategic pivot toward sustainable water solutions, with public-private partnership models becoming instrumental in funding large-scale projects. This shift supports integrated water resource management, where operational efficiency improvements of over 15% are being realized through digitalization.
  • Concurrently, a focus on climate-resilient infrastructure is paramount, as evidenced by North America alone accounting for over 34% of incremental growth opportunities. The emphasis on environmental stewardship drives investment, yet financial viability is often balanced against consumer price sensitivity, which remains high.
  • Effective capital expenditure planning is critical for companies navigating this landscape, where lifecycle cost analysis now frequently outweighs initial procurement price in decision-making.

We can help! Our analysts can customize this water and wastewater management market research report to meet your requirements.

Get in touch

1. Executive Summary

1.1 Market overview

Executive Summary - Chart on Market Overview
Executive Summary - Data Table on Market Overview
Executive Summary - Chart on Global Market Characteristics
Executive Summary - Chart on Market by Geography
Executive Summary - Chart on Market Segmentation by Product
Executive Summary - Chart on Market Segmentation by Type
Executive Summary - Chart on Market Segmentation by Application
Executive Summary - Chart on Market Segmentation by End-user
Executive Summary - Chart on Incremental Growth
Executive Summary - Data Table on Incremental Growth
Executive Summary - Chart on Company Market Positioning

2. Technavio Analysis

2.1 Analysis of price sensitivity, lifecycle, customer purchase basket, adoption rates, and purchase criteria

2.2 Criticality of inputs and Factors of differentiation

Chart on Overview on criticality of inputs and factors of differentiation

2.3 Factors of disruption

Chart on Overview on factors of disruption

2.4 Impact of drivers and challenges

Chart on Impact of drivers and challenges in 2025 and 2030

3. Market Landscape

3.1 Market ecosystem

Chart on Parent Market
Data Table on - Parent Market

3.2 Market characteristics

Chart on Market characteristics analysis

3.3 Value chain analysis

Chart on Value chain analysis

4. Market Sizing

4.1 Market definition

Data Table on Offerings of companies included in the market definition

4.2 Market segment analysis

Market segments

4.3 Market size 2025

4.4 Market outlook: Forecast for 2025-2030

Chart on Global - Market size and forecast 2025-2030 ($ million)
Data Table on Global - Market size and forecast 2025-2030 ($ million)
Chart on Global Market: Year-over-year growth 2025-2030 (%)
Data Table on Global Market: Year-over-year growth 2025-2030 (%)

5. Historic Market Size

5.1 Global Water And Wastewater Management Market 2020 - 2024

Historic Market Size - Data Table on Global Water And Wastewater Management Market 2020 - 2024 ($ million)

5.2 Product segment analysis 2020 - 2024

Historic Market Size - Product Segment 2020 - 2024 ($ million)

5.3 Type segment analysis 2020 - 2024

Historic Market Size - Type Segment 2020 - 2024 ($ million)

5.4 Application segment analysis 2020 - 2024

Historic Market Size - Application Segment 2020 - 2024 ($ million)

5.5 End-user segment analysis 2020 - 2024

Historic Market Size - End-user Segment 2020 - 2024 ($ million)

5.6 Geography segment analysis 2020 - 2024

Historic Market Size - Geography Segment 2020 - 2024 ($ million)

5.7 Country segment analysis 2020 - 2024

Historic Market Size - Country Segment 2020 - 2024 ($ million)

6. Qualitative Analysis

6.1 Impact of AI on global water and wastewater management market

6.2 Impact of geopolitical conflicts on global water and wastewater management market

7. Five Forces Analysis

7.1 Five forces summary

Five forces analysis - Comparison between 2025 and 2030

7.2 Bargaining power of buyers

Bargaining power of buyers - Impact of key factors 2025 and 2030

7.3 Bargaining power of suppliers

Bargaining power of suppliers - Impact of key factors in 2025 and 2030

7.4 Threat of new entrants

Threat of new entrants - Impact of key factors in 2025 and 2030

7.5 Threat of substitutes

Threat of substitutes - Impact of key factors in 2025 and 2030

7.6 Threat of rivalry

Threat of rivalry - Impact of key factors in 2025 and 2030

7.7 Market condition

Chart on Market condition - Five forces 2025 and 2030

8. Market Segmentation by Product

8.1 Market segments

Chart on Product - Market share 2025-2030 (%)
Data Table on Product - Market share 2025-2030 (%)

8.2 Comparison by Product

Chart on Comparison by Product
Data Table on Comparison by Product

8.3 Water treatment - Market size and forecast 2025-2030

Chart on Water treatment - Market size and forecast 2025-2030 ($ million)
Data Table on Water treatment - Market size and forecast 2025-2030 ($ million)
Chart on Water treatment - Year-over-year growth 2025-2030 (%)
Data Table on Water treatment - Year-over-year growth 2025-2030 (%)

8.4 Wastewater treatment - Market size and forecast 2025-2030

Chart on Wastewater treatment - Market size and forecast 2025-2030 ($ million)
Data Table on Wastewater treatment - Market size and forecast 2025-2030 ($ million)
Chart on Wastewater treatment - Year-over-year growth 2025-2030 (%)
Data Table on Wastewater treatment - Year-over-year growth 2025-2030 (%)

8.5 Market opportunity by Product

Market opportunity by Product ($ million)
Data Table on Market opportunity by Product ($ million)

9. Market Segmentation by Type

9.1 Market segments

Chart on Type - Market share 2025-2030 (%)
Data Table on Type - Market share 2025-2030 (%)

9.2 Comparison by Type

Chart on Comparison by Type
Data Table on Comparison by Type

9.3 Primary treatment - Market size and forecast 2025-2030

Chart on Primary treatment - Market size and forecast 2025-2030 ($ million)
Data Table on Primary treatment - Market size and forecast 2025-2030 ($ million)
Chart on Primary treatment - Year-over-year growth 2025-2030 (%)
Data Table on Primary treatment - Year-over-year growth 2025-2030 (%)

9.4 Secondary treatment - Market size and forecast 2025-2030

Chart on Secondary treatment - Market size and forecast 2025-2030 ($ million)
Data Table on Secondary treatment - Market size and forecast 2025-2030 ($ million)
Chart on Secondary treatment - Year-over-year growth 2025-2030 (%)
Data Table on Secondary treatment - Year-over-year growth 2025-2030 (%)

9.5 Tertiary treatment - Market size and forecast 2025-2030

Chart on Tertiary treatment - Market size and forecast 2025-2030 ($ million)
Data Table on Tertiary treatment - Market size and forecast 2025-2030 ($ million)
Chart on Tertiary treatment - Year-over-year growth 2025-2030 (%)
Data Table on Tertiary treatment - Year-over-year growth 2025-2030 (%)

9.6 Market opportunity by Type

Market opportunity by Type ($ million)
Data Table on Market opportunity by Type ($ million)

10. Market Segmentation by Application

10.1 Market segments

Chart on Application - Market share 2025-2030 (%)
Data Table on Application - Market share 2025-2030 (%)

10.2 Comparison by Application

Chart on Comparison by Application
Data Table on Comparison by Application

10.3 Membrane separation - Market size and forecast 2025-2030

Chart on Membrane separation - Market size and forecast 2025-2030 ($ million)
Data Table on Membrane separation - Market size and forecast 2025-2030 ($ million)
Chart on Membrane separation - Year-over-year growth 2025-2030 (%)
Data Table on Membrane separation - Year-over-year growth 2025-2030 (%)

10.4 Biological - Market size and forecast 2025-2030

Chart on Biological - Market size and forecast 2025-2030 ($ million)
Data Table on Biological - Market size and forecast 2025-2030 ($ million)
Chart on Biological - Year-over-year growth 2025-2030 (%)
Data Table on Biological - Year-over-year growth 2025-2030 (%)

10.5 Disinfection - Market size and forecast 2025-2030

Chart on Disinfection - Market size and forecast 2025-2030 ($ million)
Data Table on Disinfection - Market size and forecast 2025-2030 ($ million)
Chart on Disinfection - Year-over-year growth 2025-2030 (%)
Data Table on Disinfection - Year-over-year growth 2025-2030 (%)

10.6 Sludge treatment - Market size and forecast 2025-2030

Chart on Sludge treatment - Market size and forecast 2025-2030 ($ million)
Data Table on Sludge treatment - Market size and forecast 2025-2030 ($ million)
Chart on Sludge treatment - Year-over-year growth 2025-2030 (%)
Data Table on Sludge treatment - Year-over-year growth 2025-2030 (%)

10.7 Others - Market size and forecast 2025-2030

Chart on Others - Market size and forecast 2025-2030 ($ million)
Data Table on Others - Market size and forecast 2025-2030 ($ million)
Chart on Others - Year-over-year growth 2025-2030 (%)
Data Table on Others - Year-over-year growth 2025-2030 (%)

10.8 Market opportunity by Application

Market opportunity by Application ($ million)
Data Table on Market opportunity by Application ($ million)

11. Market Segmentation by End-user

11.1 Market segments

Chart on End-user - Market share 2025-2030 (%)
Data Table on End-user - Market share 2025-2030 (%)

11.2 Comparison by End-user

Chart on Comparison by End-user
Data Table on Comparison by End-user

11.3 Municipal - Market size and forecast 2025-2030

Chart on Municipal - Market size and forecast 2025-2030 ($ million)
Data Table on Municipal - Market size and forecast 2025-2030 ($ million)
Chart on Municipal - Year-over-year growth 2025-2030 (%)
Data Table on Municipal - Year-over-year growth 2025-2030 (%)

11.4 Industrial - Market size and forecast 2025-2030

Chart on Industrial - Market size and forecast 2025-2030 ($ million)
Data Table on Industrial - Market size and forecast 2025-2030 ($ million)
Chart on Industrial - Year-over-year growth 2025-2030 (%)
Data Table on Industrial - Year-over-year growth 2025-2030 (%)

11.5 Market opportunity by End-user

Market opportunity by End-user ($ million)
Data Table on Market opportunity by End-user ($ million)

12. Customer Landscape

12.1 Customer landscape overview

Analysis of price sensitivity, lifecycle, customer purchase basket, adoption rates, and purchase criteria

13. Geographic Landscape

13.1 Geographic segmentation

Chart on Market share by geography 2025-2030 (%)
Data Table on Market share by geography 2025-2030 (%)

13.2 Geographic comparison

Chart on Geographic comparison
Data Table on Geographic comparison

13.3 North America - Market size and forecast 2025-2030

Chart on North America - Market size and forecast 2025-2030 ($ million)
Data Table on North America - Market size and forecast 2025-2030 ($ million)
Chart on North America - Year-over-year growth 2025-2030 (%)
Data Table on North America - Year-over-year growth 2025-2030 (%)
Chart on Regional Comparison - North America
Data Table on Regional Comparison - North America

13.3.1 US - Market size and forecast 2025-2030

Chart on US - Market size and forecast 2025-2030 ($ million)
Data Table on US - Market size and forecast 2025-2030 ($ million)
Chart on US - Year-over-year growth 2025-2030 (%)
Data Table on US - Year-over-year growth 2025-2030 (%)

13.3.2 Canada - Market size and forecast 2025-2030

Chart on Canada - Market size and forecast 2025-2030 ($ million)
Data Table on Canada - Market size and forecast 2025-2030 ($ million)
Chart on Canada - Year-over-year growth 2025-2030 (%)
Data Table on Canada - Year-over-year growth 2025-2030 (%)

13.3.3 Mexico - Market size and forecast 2025-2030

Chart on Mexico - Market size and forecast 2025-2030 ($ million)
Data Table on Mexico - Market size and forecast 2025-2030 ($ million)
Chart on Mexico - Year-over-year growth 2025-2030 (%)
Data Table on Mexico - Year-over-year growth 2025-2030 (%)

13.4 APAC - Market size and forecast 2025-2030

Chart on APAC - Market size and forecast 2025-2030 ($ million)
Data Table on APAC - Market size and forecast 2025-2030 ($ million)
Chart on APAC - Year-over-year growth 2025-2030 (%)
Data Table on APAC - Year-over-year growth 2025-2030 (%)
Chart on Regional Comparison - APAC
Data Table on Regional Comparison - APAC

13.4.1 China - Market size and forecast 2025-2030

Chart on China - Market size and forecast 2025-2030 ($ million)
Data Table on China - Market size and forecast 2025-2030 ($ million)
Chart on China - Year-over-year growth 2025-2030 (%)
Data Table on China - Year-over-year growth 2025-2030 (%)

13.4.2 Japan - Market size and forecast 2025-2030

Chart on Japan - Market size and forecast 2025-2030 ($ million)
Data Table on Japan - Market size and forecast 2025-2030 ($ million)
Chart on Japan - Year-over-year growth 2025-2030 (%)
Data Table on Japan - Year-over-year growth 2025-2030 (%)

13.4.3 India - Market size and forecast 2025-2030

Chart on India - Market size and forecast 2025-2030 ($ million)
Data Table on India - Market size and forecast 2025-2030 ($ million)
Chart on India - Year-over-year growth 2025-2030 (%)
Data Table on India - Year-over-year growth 2025-2030 (%)

13.4.4 South Korea - Market size and forecast 2025-2030

Chart on South Korea - Market size and forecast 2025-2030 ($ million)
Data Table on South Korea - Market size and forecast 2025-2030 ($ million)
Chart on South Korea - Year-over-year growth 2025-2030 (%)
Data Table on South Korea - Year-over-year growth 2025-2030 (%)

13.4.5 Australia - Market size and forecast 2025-2030

Chart on Australia - Market size and forecast 2025-2030 ($ million)
Data Table on Australia - Market size and forecast 2025-2030 ($ million)
Chart on Australia - Year-over-year growth 2025-2030 (%)
Data Table on Australia - Year-over-year growth 2025-2030 (%)

13.4.6 Indonesia - Market size and forecast 2025-2030

Chart on Indonesia - Market size and forecast 2025-2030 ($ million)
Data Table on Indonesia - Market size and forecast 2025-2030 ($ million)
Chart on Indonesia - Year-over-year growth 2025-2030 (%)
Data Table on Indonesia - Year-over-year growth 2025-2030 (%)

13.5 Europe - Market size and forecast 2025-2030

Chart on Europe - Market size and forecast 2025-2030 ($ million)
Data Table on Europe - Market size and forecast 2025-2030 ($ million)
Chart on Europe - Year-over-year growth 2025-2030 (%)
Data Table on Europe - Year-over-year growth 2025-2030 (%)
Chart on Regional Comparison - Europe
Data Table on Regional Comparison - Europe

13.5.1 Germany - Market size and forecast 2025-2030

Chart on Germany - Market size and forecast 2025-2030 ($ million)
Data Table on Germany - Market size and forecast 2025-2030 ($ million)
Chart on Germany - Year-over-year growth 2025-2030 (%)
Data Table on Germany - Year-over-year growth 2025-2030 (%)

13.5.2 UK - Market size and forecast 2025-2030

Chart on UK - Market size and forecast 2025-2030 ($ million)
Data Table on UK - Market size and forecast 2025-2030 ($ million)
Chart on UK - Year-over-year growth 2025-2030 (%)
Data Table on UK - Year-over-year growth 2025-2030 (%)

13.5.3 France - Market size and forecast 2025-2030

Chart on France - Market size and forecast 2025-2030 ($ million)
Data Table on France - Market size and forecast 2025-2030 ($ million)
Chart on France - Year-over-year growth 2025-2030 (%)
Data Table on France - Year-over-year growth 2025-2030 (%)

13.5.4 Italy - Market size and forecast 2025-2030

Chart on Italy - Market size and forecast 2025-2030 ($ million)
Data Table on Italy - Market size and forecast 2025-2030 ($ million)
Chart on Italy - Year-over-year growth 2025-2030 (%)
Data Table on Italy - Year-over-year growth 2025-2030 (%)

13.5.5 Spain - Market size and forecast 2025-2030

Chart on Spain - Market size and forecast 2025-2030 ($ million)
Data Table on Spain - Market size and forecast 2025-2030 ($ million)
Chart on Spain - Year-over-year growth 2025-2030 (%)
Data Table on Spain - Year-over-year growth 2025-2030 (%)

13.5.6 The Netherlands - Market size and forecast 2025-2030

Chart on The Netherlands - Market size and forecast 2025-2030 ($ million)
Data Table on The Netherlands - Market size and forecast 2025-2030 ($ million)
Chart on The Netherlands - Year-over-year growth 2025-2030 (%)
Data Table on The Netherlands - Year-over-year growth 2025-2030 (%)

13.6 South America - Market size and forecast 2025-2030

Chart on South America - Market size and forecast 2025-2030 ($ million)
Data Table on South America - Market size and forecast 2025-2030 ($ million)
Chart on South America - Year-over-year growth 2025-2030 (%)
Data Table on South America - Year-over-year growth 2025-2030 (%)
Chart on Regional Comparison - South America
Data Table on Regional Comparison - South America

13.6.1 Brazil - Market size and forecast 2025-2030

Chart on Brazil - Market size and forecast 2025-2030 ($ million)
Data Table on Brazil - Market size and forecast 2025-2030 ($ million)
Chart on Brazil - Year-over-year growth 2025-2030 (%)
Data Table on Brazil - Year-over-year growth 2025-2030 (%)

13.6.2 Argentina - Market size and forecast 2025-2030

Chart on Argentina - Market size and forecast 2025-2030 ($ million)
Data Table on Argentina - Market size and forecast 2025-2030 ($ million)
Chart on Argentina - Year-over-year growth 2025-2030 (%)
Data Table on Argentina - Year-over-year growth 2025-2030 (%)

13.6.3 Chile - Market size and forecast 2025-2030

Chart on Chile - Market size and forecast 2025-2030 ($ million)
Data Table on Chile - Market size and forecast 2025-2030 ($ million)
Chart on Chile - Year-over-year growth 2025-2030 (%)
Data Table on Chile - Year-over-year growth 2025-2030 (%)

13.7 Middle East and Africa - Market size and forecast 2025-2030

Chart on Middle East and Africa - Market size and forecast 2025-2030 ($ million)
Data Table on Middle East and Africa - Market size and forecast 2025-2030 ($ million)
Chart on Middle East and Africa - Year-over-year growth 2025-2030 (%)
Data Table on Middle East and Africa - Year-over-year growth 2025-2030 (%)
Chart on Regional Comparison - Middle East and Africa
Data Table on Regional Comparison - Middle East and Africa

13.7.1 Saudi Arabia - Market size and forecast 2025-2030

Chart on Saudi Arabia - Market size and forecast 2025-2030 ($ million)
Data Table on Saudi Arabia - Market size and forecast 2025-2030 ($ million)
Chart on Saudi Arabia - Year-over-year growth 2025-2030 (%)
Data Table on Saudi Arabia - Year-over-year growth 2025-2030 (%)

13.7.2 UAE - Market size and forecast 2025-2030

Chart on UAE - Market size and forecast 2025-2030 ($ million)
Data Table on UAE - Market size and forecast 2025-2030 ($ million)
Chart on UAE - Year-over-year growth 2025-2030 (%)
Data Table on UAE - Year-over-year growth 2025-2030 (%)

13.7.3 South Africa - Market size and forecast 2025-2030

Chart on South Africa - Market size and forecast 2025-2030 ($ million)
Data Table on South Africa - Market size and forecast 2025-2030 ($ million)
Chart on South Africa - Year-over-year growth 2025-2030 (%)
Data Table on South Africa - Year-over-year growth 2025-2030 (%)

13.7.4 Israel - Market size and forecast 2025-2030

Chart on Israel - Market size and forecast 2025-2030 ($ million)
Data Table on Israel - Market size and forecast 2025-2030 ($ million)
Chart on Israel - Year-over-year growth 2025-2030 (%)
Data Table on Israel - Year-over-year growth 2025-2030 (%)

13.7.5 Turkey - Market size and forecast 2025-2030

Chart on Turkey - Market size and forecast 2025-2030 ($ million)
Data Table on Turkey - Market size and forecast 2025-2030 ($ million)
Chart on Turkey - Year-over-year growth 2025-2030 (%)
Data Table on Turkey - Year-over-year growth 2025-2030 (%)

13.8 Market opportunity by geography

Market opportunity by geography ($ million)
Data Tables on Market opportunity by geography ($ million)

14. Drivers, Challenges, and Opportunity

14.1 Market drivers

Increasing water scarcity and global population growth
Stringent environmental regulations and water quality standards
Rapid urbanization and industrialization

14.2 Market challenges

Increasing complexity and emergence of new contaminants
Escalating capital and operational expenditures
Impacts of climate variability on system resilience

14.3 Impact of drivers and challenges

Impact of drivers and challenges in 2025 and 2030

14.4 Market opportunities

Rise of digitalization and smart water networks
Embracing circular economy and resource recovery from wastewater
Increasing adoption of decentralized and modular treatment systems

15. Competitive Landscape

15.1 Overview

15.2

Overview on criticality of inputs and factors of differentiation

15.3 Landscape disruption

Overview on factors of disruption

15.4 Industry risks

Impact of key risks on business

16. Competitive Analysis

16.1 Companies profiled

Companies covered

16.2 Company ranking index

16.3 Market positioning of companies

Matrix on companies position and classification

16.4 ABB Ltd.

ABB Ltd. - Overview
ABB Ltd. - Business segments
ABB Ltd. - Key news
ABB Ltd. - Key offerings
ABB Ltd. - Segment focus
SWOT

16.5 Acciona SA

Acciona SA - Overview
Acciona SA - Business segments
Acciona SA - Key news
Acciona SA - Key offerings
Acciona SA - Segment focus
SWOT

16.6 DuPont de Nemours Inc.

DuPont de Nemours Inc. - Overview
DuPont de Nemours Inc. - Business segments
DuPont de Nemours Inc. - Key news
DuPont de Nemours Inc. - Key offerings
DuPont de Nemours Inc. - Segment focus
SWOT

16.7 Ecolab Inc.

Ecolab Inc. - Overview
Ecolab Inc. - Business segments
Ecolab Inc. - Key offerings
Ecolab Inc. - Segment focus
SWOT

16.8 GEA Group AG

GEA Group AG - Overview
GEA Group AG - Business segments
GEA Group AG - Key offerings
GEA Group AG - Segment focus
SWOT

16.9 Hitachi Ltd.

Hitachi Ltd. - Overview
Hitachi Ltd. - Business segments
Hitachi Ltd. - Key offerings
Hitachi Ltd. - Segment focus
SWOT

16.10 Jacobs Solutions Inc.

Jacobs Solutions Inc. - Overview
Jacobs Solutions Inc. - Business segments
Jacobs Solutions Inc. - Key offerings
Jacobs Solutions Inc. - Segment focus
SWOT

16.11 Kemira Oyj

Kemira Oyj - Overview
Kemira Oyj - Business segments
Kemira Oyj - Key offerings
Kemira Oyj - Segment focus
SWOT

16.12 KURARAY Co. Ltd.

KURARAY Co. Ltd. - Overview
KURARAY Co. Ltd. - Business segments
KURARAY Co. Ltd. - Key offerings
KURARAY Co. Ltd. - Segment focus
SWOT

16.13 Pentair Plc

Pentair Plc - Overview
Pentair Plc - Business segments
Pentair Plc - Key offerings
Pentair Plc - Segment focus
SWOT

16.14 Schneider Electric SE

Schneider Electric SE - Overview
Schneider Electric SE - Business segments
Schneider Electric SE - Key news
Schneider Electric SE - Key offerings
Schneider Electric SE - Segment focus
SWOT

16.15 Siemens AG

Siemens AG - Overview
Siemens AG - Business segments
Siemens AG - Key news
Siemens AG - Key offerings
Siemens AG - Segment focus
SWOT

16.16 Sulzer Ltd.

Sulzer Ltd. - Overview
Sulzer Ltd. - Business segments
Sulzer Ltd. - Key offerings
Sulzer Ltd. - Segment focus
SWOT

16.17 Veolia Environment SA

Veolia Environment SA - Overview
Veolia Environment SA - Business segments
Veolia Environment SA - Key news
Veolia Environment SA - Key offerings
Veolia Environment SA - Segment focus
SWOT

16.18 Xylem Inc.

Xylem Inc. - Overview
Xylem Inc. - Business segments
Xylem Inc. - Key news
Xylem Inc. - Key offerings
Xylem Inc. - Segment focus
SWOT

17. Appendix

17.1 Scope of the report

Market definition
Objectives
Notes and caveats

17.2 Inclusions and exclusions checklist

Inclusions checklist
Exclusions checklist

17.3 Currency conversion rates for US$

17.4 Research methodology

17.5 Data procurement

Information sources

17.6 Data validation

17.7 Validation techniques employed for market sizing

17.8 Data synthesis

17.9 360 degree market analysis

17.10 List of abbreviations

Research Methodology

Technavio presents a detailed picture of the market by way of study, synthesis, and summation of data from multiple sources. The analysts have presented the various facets of the market with a particular focus on identifying the key industry influencers. The data thus presented is comprehensive, reliable, and the result of extensive research, both primary and secondary.

INFORMATION SOURCES

Primary sources

  • Manufacturers and suppliers
  • Channel partners
  • Industry experts
  • Strategic decision makers

Secondary sources

  • Industry journals and periodicals
  • Government data
  • Financial reports of key industry players
  • Historical data
  • Press releases

DATA ANALYSIS

Data Synthesis

  • Collation of data
  • Estimation of key figures
  • Analysis of derived insights

Data Validation

  • Triangulation with data models
  • Reference against proprietary databases
  • Corroboration with industry experts

REPORT WRITING

Qualitative

  • Market drivers
  • Market challenges
  • Market trends
  • Five forces analysis

Quantitative

  • Market size and forecast
  • Market segmentation
  • Geographical insights
  • Competitive landscape

Interested in this report?

Get your sample now to see our research methodology and insights!

Download Now

Frequently Asked Questions

Water And Wastewater Management market growth will increase by USD 3366.8 million during 2026-2030.

The Water And Wastewater Management market is expected to grow at a CAGR of 7.6% during 2026-2030.

Water And Wastewater Management market is segmented by Product (Water treatment, Wastewater treatment) Type (Primary treatment, Secondary treatment, Tertiary treatment) Application (Membrane separation, Biological, Disinfection, Sludge treatment, Others) End-user (Municipal, Industrial)

ABB Ltd., Acciona SA, Alfa Laval AB, Culligan International Co., Danfoss AS, DuPont de Nemours Inc., Ecolab Inc., GEA Group AG, Grundfos Holding AS, Hitachi Ltd., Jacobs Solutions Inc., Kemira Oyj, KURARAY Co. Ltd., Pentair Plc, Schneider Electric SE, Siemens AG, SUEZ SA, Sulzer Ltd., Veolia Environment SA, Xylem Inc. are a few of the key vendors in the Water And Wastewater Management market.

North America will register the highest growth rate of 34.4% among the other regions. Therefore, the Water And Wastewater Management market in North America is expected to garner significant business opportunities for the vendors during the forecast period.

US, Canada, Mexico, China, Japan, India, South Korea, Australia, Indonesia, Germany, UK, France, Italy, Spain, The Netherlands, Brazil, Argentina, Chile, Saudi Arabia, UAE, South Africa, Israel, Turkey

  • Increasing water scarcity and global population growth is the driving factor this market.

The Water And Wastewater Management market vendors should focus on grabbing business opportunities from the Product segment as it accounted for the largest market share in the base year.
RIA - Research AI Assistant
Ask RIA