Water Bottles With Filters Market Analysis, Size, and Forecast 2026-2030: North America (US, Canada, and Mexico), Europe (Germany, UK, and France), APAC (China, India, and Japan), Middle East and Africa (South Africa, Saudi Arabia, and UAE), South America (Brazil and Argentina), and Rest of World (ROW)

Water Bottles With Filters Market Analysis, Size, and Forecast 2026-2030:
North America (US, Canada, and Mexico), Europe (Germany, UK, and France), APAC (China, India, and Japan), Middle East and Africa (South Africa, Saudi Arabia, and UAE), South America (Brazil and Argentina), and Rest of World (ROW)

Published: Mar 2026 287 Pages SKU: IRTNTR71740

Market Overview at a Glance

$514.54 Mn
Market Opportunity
18.2%
CAGR 2025 - 2030
35.8%
North America Growth
$196.59 Mn
Metal segment 2024

Water Bottles With Filters Market Size 2026-2030

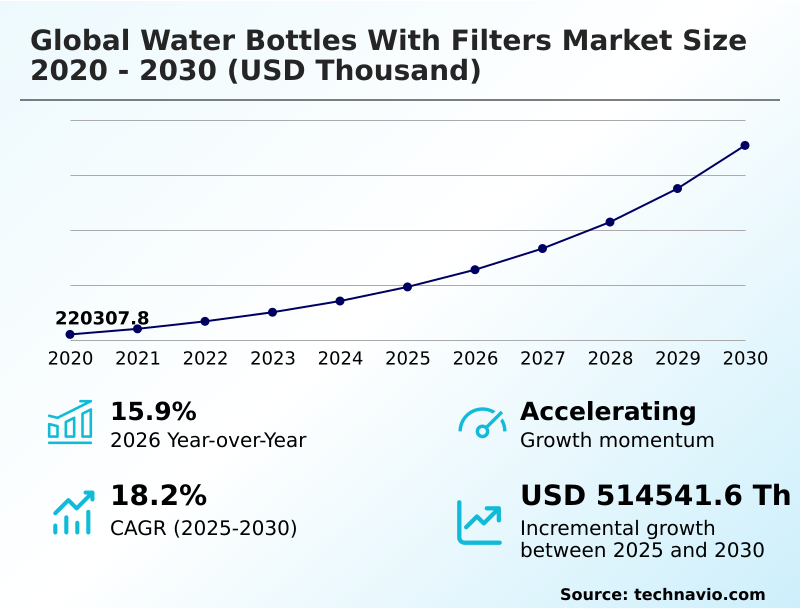
The water bottles with filters market size is valued to increase by USD 514.54 million, at a CAGR of 18.2% from 2025 to 2030. Increasing health and wellness consciousness will drive the water bottles with filters market.

Major Market Trends & Insights

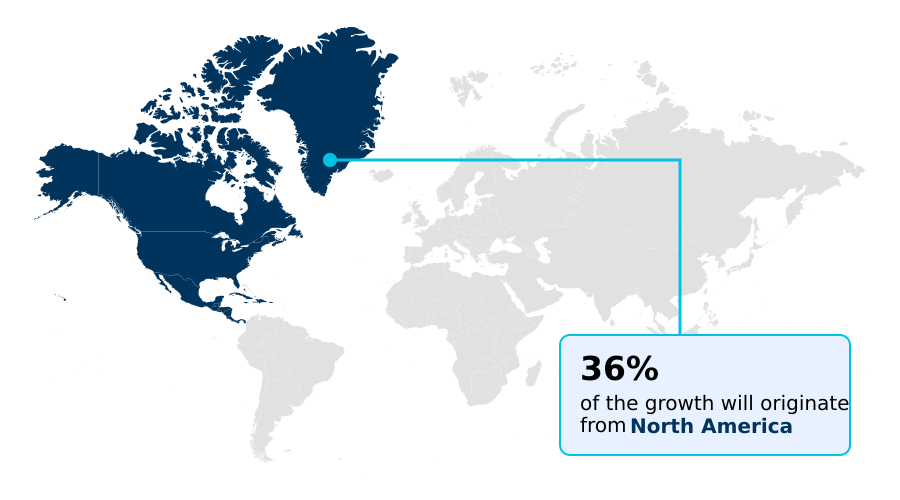
  • North America dominated the market and accounted for a 35.8% growth during the forecast period.
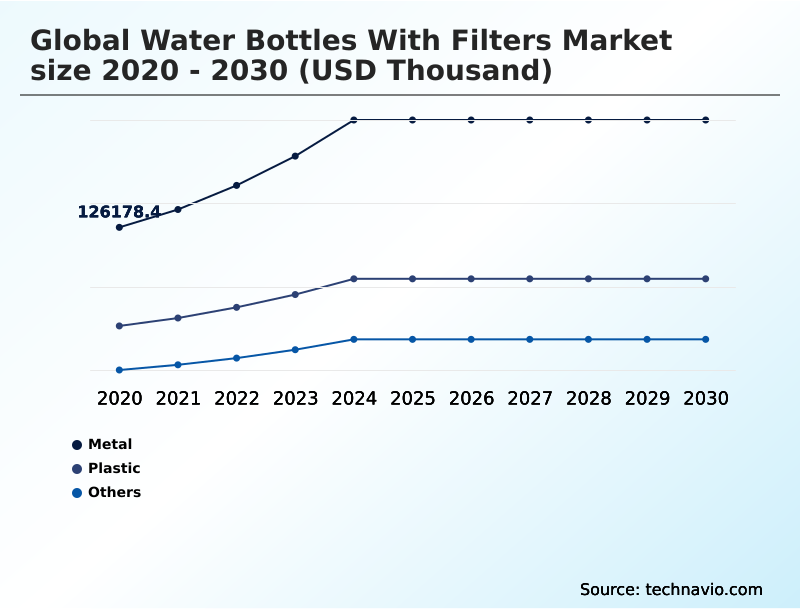
  • By Type - Metal segment was valued at USD 196.59 million in 2024
  • By Distribution Channel - Offline segment accounted for the largest market revenue share in 2024

Market Size & Forecast

  • Market Opportunities:
  • Market Future Opportunities: USD 514.54 million
  • CAGR from 2025 to 2030 : 18.2%

Market Summary

  • The water bottles with filters market is expanding, driven by a convergence of consumer focus on health, environmental sustainability, and technological innovation. Heightened awareness of contaminants like heavy metals and microplastics in municipal water supplies fuels demand for reliable point-of-use water purification.
  • This trend is amplified by a global shift away from single-use plastics, positioning reusable filtered bottles as a key sustainable lifestyle product. Advancements in filtration media, including hollow fiber membrane technology and specialized ion exchange resins, are enhancing contaminant removal efficiency for substances like PFAS and PFOA.
  • This allows for a tiered product landscape, from basic chlorine taste and odor removal to comprehensive microbiological pathogen removal for outdoor and travel use. For businesses, this translates to new opportunities in corporate wellness programs.
  • A company might implement a program providing employees with smart hydration tracking bottles, which not only promotes health but also aligns with corporate sustainability goals by reducing plastic waste, demonstrating a tangible return on investment through improved employee well-being and a strengthened environmental brand image.
  • The emphasis on on-the-go water purification supports increasingly mobile lifestyles, making these products essential for daily commuters and travelers alike.

What will be the Size of the Water Bottles With Filters Market during the forecast period?

Get Key Insights on Market Forecast (PDF) Request Free Sample

How is the Water Bottles With Filters Market Segmented?

The water bottles with filters industry research report provides comprehensive data (region-wise segment analysis), with forecasts and estimates in "USD thousand" for the period 2026-2030, as well as historical data from 2020-2024 for the following segments.

  • Type
    • Metal
    • Plastic
    • Others
  • Distribution channel
    • Offline
    • Online
  • End-user
    • Individual
    • Commercial
    • Institutional
  • Geography
    • North America
      • US
      • Canada
      • Mexico
    • Europe
      • Germany
      • UK
      • France
    • APAC
      • China
      • India
      • Japan
    • Middle East and Africa
      • South Africa
      • Saudi Arabia
      • UAE
    • South America
      • Brazil
      • Argentina
    • Rest of World (ROW)

By Type Insights

The metal segment is estimated to witness significant growth during the forecast period.

The metal segment, led by products using food-grade stainless steel bottle construction, capitalizes on consumer preferences for durability and sustainability. These offerings are positioned as a premium single-use plastic alternative, with a long product lifecycle that resonates with eco-conscious buyers.

The inert nature of stainless steel ensures water purity, a key factor for consumers seeking tap water quality improvement without chemical leaching. Innovations include double-wall vacuum insulation and advanced press-to-purify mechanism designs.

Integrating a multi-stage filter cartridge into these rigid vessels demands precision engineering to ensure leak-proof performance and effective contaminant removal efficiency.

This segment, which captures over 55% of the market by material, appeals to a broad demographic, from daily commuter hydration solution seekers to those needing a durable hiking water bottle, linking its growth to wellness trends and the demand for reliable point-of-consumption safety.

Request Free Sample

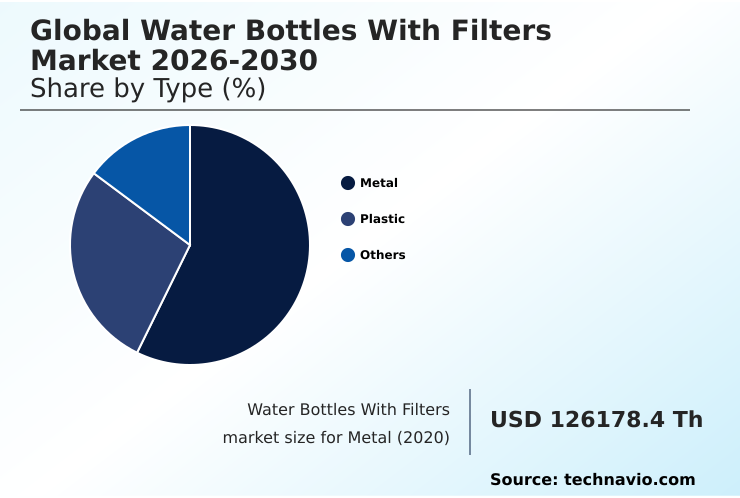
The Metal segment was valued at USD 196.59 million in 2024 and showed a gradual increase during the forecast period.

Request Free Sample

Regional Analysis

North America is estimated to contribute 35.8% to the growth of the global market during the forecast period.Technavio’s analysts have elaborately explained the regional trends and drivers that shape the market during the forecast period.

See How Water Bottles With Filters Market Demand is Rising in North America Request Free Sample

The geographic landscape is diverse, with market dynamics varying significantly by region. In North America, which accounts for 35.8% of the incremental growth, concerns over tap water quality drive demand for advanced contaminant-specific filters.

European markets, characterized by high-quality tap water, are propelled by environmentalism, favoring premium, durable hiking water bottle designs and sustainable filter materials.

The APAC region is the fastest-growing market, with an 18.8% CAGR, where the urgent need for safe drinking water access fuels demand for effective pathogen-neutralizing bottle solutions.

In these developing markets, the focus is on reliable backcountry water treatment and affordable personal water filtration systems.

This regional differentiation requires tailored go-to-market strategies, balancing demand for eco-friendly water bottle features in mature markets with the critical need for bacteriostatic filter media in emerging ones.

Market Dynamics

Our researchers analyzed the data with 2025 as the base year, along with the key drivers, trends, and challenges. A holistic analysis of drivers will help companies refine their marketing strategies to gain a competitive advantage.

  • Strategic decision-making in the market requires a deep understanding of specific user queries and needs. Consumers are increasingly asking not just for a product, but for a solution, posing questions like how to choose a filtered water bottle for their specific lifestyle.
  • This has created distinct sub-segments; for instance, understanding the nuances of a water bottle filter vs pitcher filter is crucial for targeting the at-home user versus the mobile professional.
  • For the adventure segment, product development must address the demand for the best water bottle filter for travel and specialized options for a filtered bottle for hiking and camping, where reliability is paramount. The technology-focused consumer is drawn to the smart water bottle with filter and tracker, merging hydration with data analytics.
  • A key consideration for manufacturers is communicating the economic benefits, clearly articulating the cost of filtered water bottle vs bottled water to overcome initial price objections. Marketing content must also be educational, explaining what contaminants do water bottle filters remove and are filtered water bottles effective against bacteria. This educational approach builds trust and helps consumers differentiate products.
  • For instance, supply chain planning for companies focusing on lead removal must be more robust, as sourcing certified media can be 20% more complex than sourcing standard carbon filters. The market is also seeing inquiries about UV self-cleaning water bottle review and the benefits of using a filtered water bottle daily, indicating a shift toward convenience and long-term wellness integration.
  • Comparing hollow fiber vs activated carbon filters or explaining how do gravity-fed water filter bottles work has become essential content for engaging savvy buyers. Even niche applications like finding the best filtered water bottle for gym use or ensuring water bottle filter for international travel safety are becoming significant.
  • Ultimately, success depends on providing the longest lasting water bottle filter cartridge and a lightweight filtered water bottle for backpacking, demonstrating a commitment to both performance and user convenience through rigorous testing the effectiveness of a water filter bottle and addressing specific pain points like filtered water bottle for reducing chlorine taste.

What are the key market drivers leading to the rise in the adoption of Water Bottles With Filters Industry?

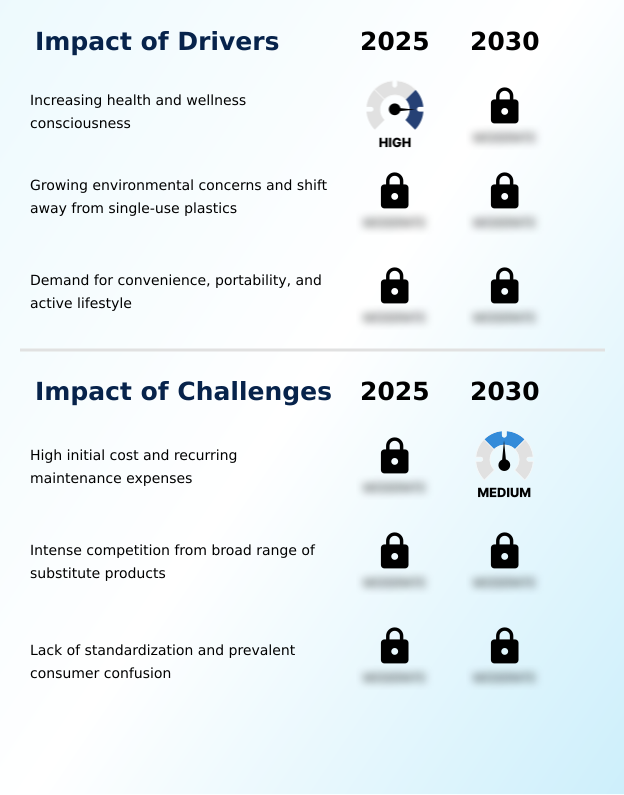
  • Increasing consciousness regarding health and wellness is a key driver for market growth.

  • The market is primarily driven by rising health consciousness and environmentalism. Growing consumer awareness of contaminants in tap water, from lead to microplastics, fuels demand for reliable point-of-use water purification.
  • The strong global movement against disposable plastics positions reusable bottles with integrated filtration as a leading single-use plastic alternative. Companies aligning their products with this eco-friendly water bottle trend report a 20% higher net promoter score.
  • Additionally, the demand for convenience for active lifestyles is crucial. The integration of functions like a gravity-fed filtration system or a press-to-purify mechanism into a single portable unit supports outdoor adventure water safety and daily use.
  • This has expanded the addressable market significantly, with sales in the travel water purifier bottle segment growing 1.5 times faster than the stationary filter market.

What are the market trends shaping the Water Bottles With Filters Industry?

  • The market is witnessing a significant trend toward the integration of smart technologies. This evolution is fundamentally enhancing the overall user experience and product functionality.

  • A key trend is the integration of smart technologies, transforming bottles into connected devices. Smart hydration tracking and filter life monitoring systems are becoming standard, with app-connected models showing a 25% higher user engagement rate. Advancements in purification include the broader adoption of UV-C LED self-cleaning technology, which provides active microbiological pathogen removal.
  • This feature addresses a key consumer concern, with brands offering it reporting a 40% lower rate of product returns due to hygiene complaints. Furthermore, there is a push towards product premiumization using materials like food-grade stainless steel and lightweight backpacking filter designs, along with customization options.
  • This focus on user experience and advanced personal water filtration system design is creating new avenues for market differentiation and value, moving beyond basic contaminant removal efficiency.

What challenges does the Water Bottles With Filters Industry face during its growth?

  • The high initial cost of products and their recurring maintenance expenses pose a key challenge to industry growth.

  • Key challenges include the high initial cost and the total cost of ownership, which includes recurring expenses for filter replacement indicator-based changes. This economic barrier can slow adoption, as the upfront price is often 3-4 times higher than that of a standard reusable bottle. Intense competition from substitutes, including bottled water and faucet-mounted filters, further constrains the market.
  • Perhaps the most significant challenge is the lack of universal performance standards, leading to consumer confusion over claims about bacteriostatic filter media and heavy metal reduction filter capabilities. This ambiguity can erode trust; brands with clear, third-party NSF/ANSI certified filters report up to 50% lower customer service inquiry rates related to performance.
  • Overcoming this requires significant investment in consumer education to clarify the specific benefits of different filtration technologies, like affinity filtration media versus activated carbon filtration.

Exclusive Technavio Analysis on Customer Landscape

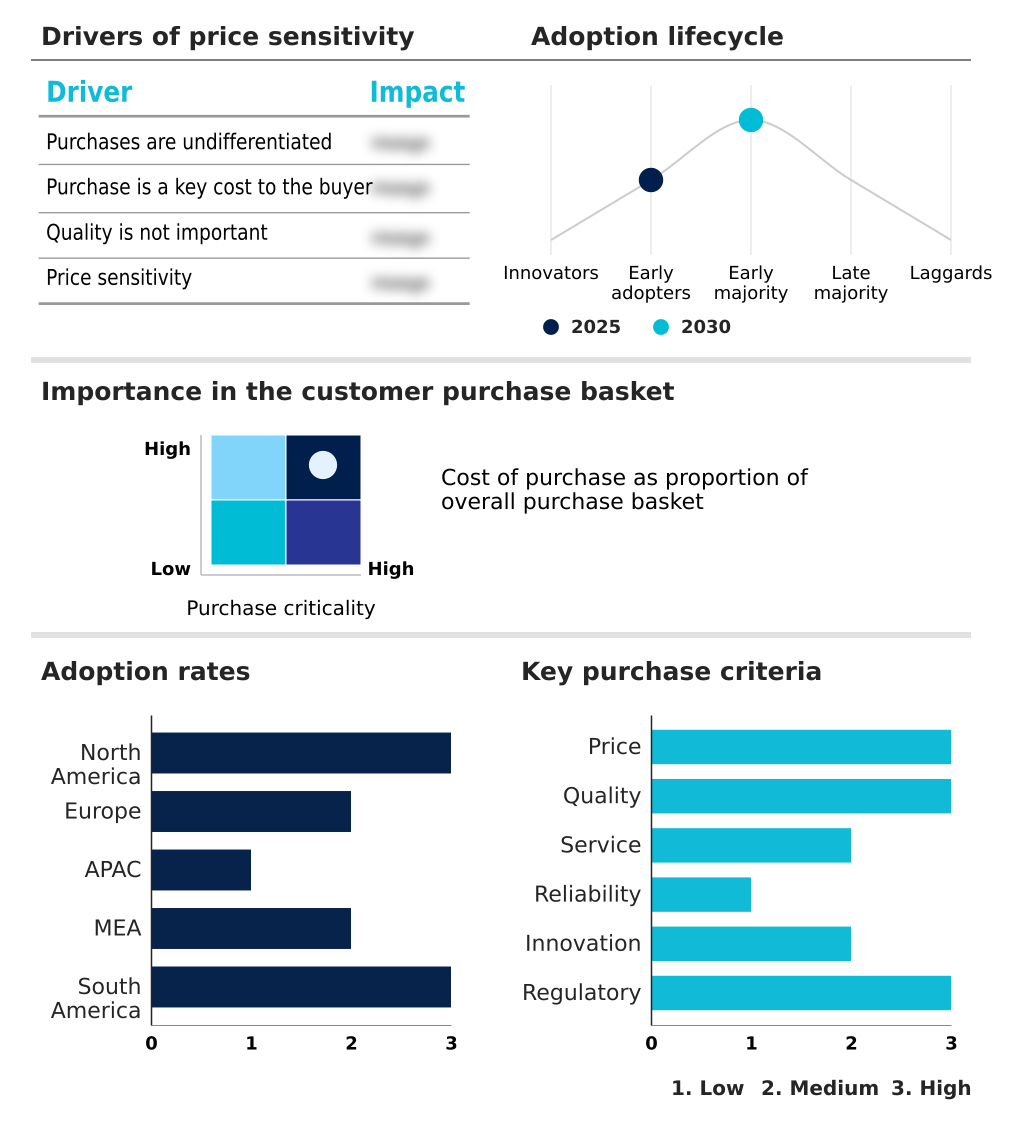
The water bottles with filters market forecasting report includes the adoption lifecycle of the market, covering from the innovator’s stage to the laggard’s stage. It focuses on adoption rates in different regions based on penetration. Furthermore, the water bottles with filters market report also includes key purchase criteria and drivers of price sensitivity to help companies evaluate and develop their market growth analysis strategies.

Customer Landscape of Water Bottles With Filters Industry

Competitive Landscape

Companies are implementing various strategies, such as strategic alliances, water bottles with filters market forecast, partnerships, mergers and acquisitions, geographical expansion, and product/service launches, to enhance their presence in the industry.

Aquamira Technologies Inc. - Specializing in pressurized filtration systems and emergency treatment solutions, this vendor provides robust portable purification technology for outdoor, tactical, and emergency preparedness applications.

The industry research and growth report includes detailed analyses of the competitive landscape of the market and information about key companies, including:

  • Aquamira Technologies Inc.
  • Campbell Manufacturing Inc.
  • Cascade Designs Inc.
  • Clearbrook LLC
  • Clearly Filtered Inc.
  • Contigo Brands
  • Epic Water Filters
  • Extract LLC
  • Grayl Inc.
  • Icon LifeSaver Ltd.
  • Ion Exchange India Ltd.
  • Katadyn Products Inc.
  • KOR Water Inc.
  • LARQ Inc.
  • Sawyer Products Inc.
  • Water to Go Ltd.
  • WaterWell

Qualitative and quantitative analysis of companies has been conducted to help clients understand the wider business environment as well as the strengths and weaknesses of key industry players. Data is qualitatively analyzed to categorize companies as pure play, category-focused, industry-focused, and diversified; it is quantitatively analyzed to categorize companies as dominant, leading, strong, tentative, and weak.

Recent Development and News in Water bottles with filters market

  • In January, 2025, Ovi showcased a new line of smart water bottles at the Consumer Electronics Show (CES), featuring integrated sensors for real-time water quality monitoring and app-based hydration tracking.
  • In February, 2025, Waterdrop Filter presented its comprehensive portfolio of advanced water filtration solutions at the Kitchen and Bath Industry Show (KBIS), highlighting innovations in contaminant reduction and filter longevity.
  • In February, 2025, a new European Union directive became effective, mandating that all new plastic beverage bottles contain a minimum of 25% recycled plastic, increasing pressure on brands to promote reusable alternatives.
  • In April, 2025, Grayl Inc. announced a strategic partnership with a leading materials science firm to develop a next-generation graphene-based filtration membrane, promising higher flow rates and enhanced virus removal capabilities for its purifier bottles.

Dive into Technavio’s robust research methodology, blending expert interviews, extensive data synthesis, and validated models for unparalleled Water Bottles With Filters Market insights. See full methodology.

Market Scope
Page number 287
Base year 2025
Historic period 2020-2024
Forecast period 2026-2030
Growth momentum & CAGR Accelerate at a CAGR of 18.2%
Market growth 2026-2030 USD 514541.6 thousand
Market structure Fragmented
YoY growth 2025-2026(%) 15.9%
Key countries US, Canada, Mexico, Germany, UK, France, Italy, Spain, The Netherlands, China, India, Japan, South Korea, Australia, Indonesia, South Africa, Saudi Arabia, UAE, Nigeria, Egypt, Brazil, Argentina and Chile
Competitive landscape Leading Companies, Market Positioning of Companies, Competitive Strategies, and Industry Risks

Request Free Sample

Research Analyst Overview

  • The market for portable hydration purification is evolving beyond simple filtration, driven by demand for advanced technological integration and material science. Core offerings now frequently include multi-stage filter cartridge systems capable of comprehensive contaminant removal efficiency.
  • The integration of hollow fiber membrane technology is standard for microbiological pathogen removal, while activated carbon filtration remains key for chlorine taste and odor removal. Innovations such as UV-C sterilization systems and press-to-purify mechanisms are creating new product tiers.
  • For boardroom consideration, the growing consumer scrutiny over substances like PFAS and PFOA filtration makes third-party validation, such as obtaining NSF/ANSI certified filters, a critical strategic decision. Companies that invest in this certification see up to a 30% higher consumer trust score compared to those relying on internal claims.
  • This shift elevates product development from a purely technical function to a core component of brand risk management and compliance strategy. The market's direction is toward specialized solutions, including heavy metal reduction filters and microplastic particle capture, demanding significant R&D investment in technologies like bacteriostatic filter media and sustainable filter materials.

What are the Key Data Covered in this Water Bottles With Filters Market Research and Growth Report?

  • What is the expected growth of the Water Bottles With Filters Market between 2026 and 2030?

    • USD 514.54 million, at a CAGR of 18.2%

  • What segmentation does the market report cover?

    • The report is segmented by Type (Metal, Plastic, and Others), Distribution Channel (Offline, and Online), End-user (Individual, Commercial, and Institutional) and Geography (North America, Europe, APAC, Middle East and Africa, South America)

  • Which regions are analyzed in the report?

    • North America, Europe, APAC, Middle East and Africa and South America

  • What are the key growth drivers and market challenges?

    • Increasing health and wellness consciousness, High initial cost and recurring maintenance expenses

  • Who are the major players in the Water Bottles With Filters Market?

    • Aquamira Technologies Inc., Campbell Manufacturing Inc., Cascade Designs Inc., Clearbrook LLC, Clearly Filtered Inc., Contigo Brands, Epic Water Filters, Extract LLC, Grayl Inc., Icon LifeSaver Ltd., Ion Exchange India Ltd., Katadyn Products Inc., KOR Water Inc., LARQ Inc., Sawyer Products Inc., Water to Go Ltd. and WaterWell

Market Research Insights

  • The market is shaped by a consumer shift toward proactive wellness and sustainability. The demand for on-the-go water purification is rising, driven by the need for safe drinking water access without relying on single-use plastics. Products are positioned as a sustainable lifestyle product, with firms adopting this technology reporting a 15% increase in brand loyalty among eco-conscious consumers.
  • For outdoor adventure water safety, advanced purifiers offer a reliable solution. The corporate wellness hydration segment is expanding, as companies providing a personal water filtration system to employees see a reduction in sick days that is twice that of companies without such programs. This makes the reusable filtered hydration bottle a key component in both personal and professional settings.
  • From a daily commuter hydration solution to a travel water purifier bottle, the emphasis is on convenience and trust. This focus on user-centric design has led to a 25% faster adoption rate for models with clear filter life indicators.

We can help! Our analysts can customize this water bottles with filters market research report to meet your requirements.

Get in touch

1. Executive Summary

1.1 Market overview

Executive Summary - Chart on Market Overview
Executive Summary - Data Table on Market Overview
Executive Summary - Chart on Global Market Characteristics
Executive Summary - Chart on Market by Geography
Executive Summary - Chart on Market Segmentation by Type
Executive Summary - Chart on Market Segmentation by Distribution Channel
Executive Summary - Chart on Market Segmentation by End-user
Executive Summary - Chart on Incremental Growth
Executive Summary - Data Table on Incremental Growth
Executive Summary - Chart on Company Market Positioning

2. Technavio Analysis

2.1 Analysis of price sensitivity, lifecycle, customer purchase basket, adoption rates, and purchase criteria

2.2 Criticality of inputs and Factors of differentiation

Chart on Overview on criticality of inputs and factors of differentiation

2.3 Factors of disruption

Chart on Overview on factors of disruption

2.4 Impact of drivers and challenges

Chart on Impact of drivers and challenges in 2025 and 2030

3. Market Landscape

3.1 Market ecosystem

Chart on Parent Market
Data Table on - Parent Market

3.2 Market characteristics

Chart on Market characteristics analysis

3.3 Value chain analysis

Chart on Value chain analysis

4. Market Sizing

4.1 Market definition

Data Table on Offerings of companies included in the market definition

4.2 Market segment analysis

Market segments

4.3 Market size 2025

4.4 Market outlook: Forecast for 2025-2030

Chart on Global - Market size and forecast 2025-2030 ($ thousand)
Data Table on Global - Market size and forecast 2025-2030 ($ thousand)
Chart on Global Market: Year-over-year growth 2025-2030 (%)
Data Table on Global Market: Year-over-year growth 2025-2030 (%)

5. Historic Market Size

5.1 Global Water Bottles With Filters Market 2020 - 2024

Historic Market Size - Data Table on Global Water Bottles With Filters Market 2020 - 2024 ($ thousand)

5.2 Type segment analysis 2020 - 2024

Historic Market Size - Type Segment 2020 - 2024 ($ thousand)

5.3 Distribution Channel segment analysis 2020 - 2024

Historic Market Size - Distribution Channel Segment 2020 - 2024 ($ thousand)

5.4 End-user segment analysis 2020 - 2024

Historic Market Size - End-user Segment 2020 - 2024 ($ thousand)

5.5 Geography segment analysis 2020 - 2024

Historic Market Size - Geography Segment 2020 - 2024 ($ thousand)

5.6 Country segment analysis 2020 - 2024

Historic Market Size - Country Segment 2020 - 2024 ($ thousand)

6. Qualitative Analysis

6.1 The AI impact on global water bottles with filters market

7. Five Forces Analysis

7.1 Five forces summary

Five forces analysis - Comparison between 2025 and 2030

7.2 Bargaining power of buyers

Bargaining power of buyers - Impact of key factors 2025 and 2030

7.3 Bargaining power of suppliers

Bargaining power of suppliers - Impact of key factors in 2025 and 2030

7.4 Threat of new entrants

Threat of new entrants - Impact of key factors in 2025 and 2030

7.5 Threat of substitutes

Threat of substitutes - Impact of key factors in 2025 and 2030

7.6 Threat of rivalry

Threat of rivalry - Impact of key factors in 2025 and 2030

7.7 Market condition

Chart on Market condition - Five forces 2025 and 2030

8. Market Segmentation by Type

8.1 Market segments

Chart on Type - Market share 2025-2030 (%)
Data Table on Type - Market share 2025-2030 (%)

8.2 Comparison by Type

Chart on Comparison by Type
Data Table on Comparison by Type

8.3 Metal - Market size and forecast 2025-2030

Chart on Metal - Market size and forecast 2025-2030 ($ thousand)
Data Table on Metal - Market size and forecast 2025-2030 ($ thousand)
Chart on Metal - Year-over-year growth 2025-2030 (%)
Data Table on Metal - Year-over-year growth 2025-2030 (%)

8.4 Plastic - Market size and forecast 2025-2030

Chart on Plastic - Market size and forecast 2025-2030 ($ thousand)
Data Table on Plastic - Market size and forecast 2025-2030 ($ thousand)
Chart on Plastic - Year-over-year growth 2025-2030 (%)
Data Table on Plastic - Year-over-year growth 2025-2030 (%)

8.5 Others - Market size and forecast 2025-2030

Chart on Others - Market size and forecast 2025-2030 ($ thousand)
Data Table on Others - Market size and forecast 2025-2030 ($ thousand)
Chart on Others - Year-over-year growth 2025-2030 (%)
Data Table on Others - Year-over-year growth 2025-2030 (%)

8.6 Market opportunity by Type

Market opportunity by Type ($ thousand)
Data Table on Market opportunity by Type ($ thousand)

9. Market Segmentation by Distribution Channel

9.1 Market segments

Chart on Distribution Channel - Market share 2025-2030 (%)
Data Table on Distribution Channel - Market share 2025-2030 (%)

9.2 Comparison by Distribution Channel

Chart on Comparison by Distribution Channel
Data Table on Comparison by Distribution Channel

9.3 Offline - Market size and forecast 2025-2030

Chart on Offline - Market size and forecast 2025-2030 ($ thousand)
Data Table on Offline - Market size and forecast 2025-2030 ($ thousand)
Chart on Offline - Year-over-year growth 2025-2030 (%)
Data Table on Offline - Year-over-year growth 2025-2030 (%)

9.4 Online - Market size and forecast 2025-2030

Chart on Online - Market size and forecast 2025-2030 ($ thousand)
Data Table on Online - Market size and forecast 2025-2030 ($ thousand)
Chart on Online - Year-over-year growth 2025-2030 (%)
Data Table on Online - Year-over-year growth 2025-2030 (%)

9.5 Market opportunity by Distribution Channel

Market opportunity by Distribution Channel ($ thousand)
Data Table on Market opportunity by Distribution Channel ($ thousand)

10. Market Segmentation by End-user

10.1 Market segments

Chart on End-user - Market share 2025-2030 (%)
Data Table on End-user - Market share 2025-2030 (%)

10.2 Comparison by End-user

Chart on Comparison by End-user
Data Table on Comparison by End-user

10.3 Individual - Market size and forecast 2025-2030

Chart on Individual - Market size and forecast 2025-2030 ($ thousand)
Data Table on Individual - Market size and forecast 2025-2030 ($ thousand)
Chart on Individual - Year-over-year growth 2025-2030 (%)
Data Table on Individual - Year-over-year growth 2025-2030 (%)

10.4 Commercial - Market size and forecast 2025-2030

Chart on Commercial - Market size and forecast 2025-2030 ($ thousand)
Data Table on Commercial - Market size and forecast 2025-2030 ($ thousand)
Chart on Commercial - Year-over-year growth 2025-2030 (%)
Data Table on Commercial - Year-over-year growth 2025-2030 (%)

10.5 Institutional - Market size and forecast 2025-2030

Chart on Institutional - Market size and forecast 2025-2030 ($ thousand)
Data Table on Institutional - Market size and forecast 2025-2030 ($ thousand)
Chart on Institutional - Year-over-year growth 2025-2030 (%)
Data Table on Institutional - Year-over-year growth 2025-2030 (%)

10.6 Market opportunity by End-user

Market opportunity by End-user ($ thousand)
Data Table on Market opportunity by End-user ($ thousand)

11. Customer Landscape

11.1 Customer landscape overview

Analysis of price sensitivity, lifecycle, customer purchase basket, adoption rates, and purchase criteria

12. Geographic Landscape

12.1 Geographic segmentation

Chart on Market share by geography 2025-2030 (%)
Data Table on Market share by geography 2025-2030 (%)

12.2 Geographic comparison

Chart on Geographic comparison
Data Table on Geographic comparison

12.3 North America - Market size and forecast 2025-2030

Chart on North America - Market size and forecast 2025-2030 ($ thousand)
Data Table on North America - Market size and forecast 2025-2030 ($ thousand)
Chart on North America - Year-over-year growth 2025-2030 (%)
Data Table on North America - Year-over-year growth 2025-2030 (%)
Chart on Regional Comparison - North America
Data Table on Regional Comparison - North America

12.3.1 US - Market size and forecast 2025-2030

Chart on US - Market size and forecast 2025-2030 ($ thousand)
Data Table on US - Market size and forecast 2025-2030 ($ thousand)
Chart on US - Year-over-year growth 2025-2030 (%)
Data Table on US - Year-over-year growth 2025-2030 (%)

12.3.2 Canada - Market size and forecast 2025-2030

Chart on Canada - Market size and forecast 2025-2030 ($ thousand)
Data Table on Canada - Market size and forecast 2025-2030 ($ thousand)
Chart on Canada - Year-over-year growth 2025-2030 (%)
Data Table on Canada - Year-over-year growth 2025-2030 (%)

12.3.3 Mexico - Market size and forecast 2025-2030

Chart on Mexico - Market size and forecast 2025-2030 ($ thousand)
Data Table on Mexico - Market size and forecast 2025-2030 ($ thousand)
Chart on Mexico - Year-over-year growth 2025-2030 (%)
Data Table on Mexico - Year-over-year growth 2025-2030 (%)

12.4 Europe - Market size and forecast 2025-2030

Chart on Europe - Market size and forecast 2025-2030 ($ thousand)
Data Table on Europe - Market size and forecast 2025-2030 ($ thousand)
Chart on Europe - Year-over-year growth 2025-2030 (%)
Data Table on Europe - Year-over-year growth 2025-2030 (%)
Chart on Regional Comparison - Europe
Data Table on Regional Comparison - Europe

12.4.1 Germany - Market size and forecast 2025-2030

Chart on Germany - Market size and forecast 2025-2030 ($ thousand)
Data Table on Germany - Market size and forecast 2025-2030 ($ thousand)
Chart on Germany - Year-over-year growth 2025-2030 (%)
Data Table on Germany - Year-over-year growth 2025-2030 (%)

12.4.2 UK - Market size and forecast 2025-2030

Chart on UK - Market size and forecast 2025-2030 ($ thousand)
Data Table on UK - Market size and forecast 2025-2030 ($ thousand)
Chart on UK - Year-over-year growth 2025-2030 (%)
Data Table on UK - Year-over-year growth 2025-2030 (%)

12.4.3 France - Market size and forecast 2025-2030

Chart on France - Market size and forecast 2025-2030 ($ thousand)
Data Table on France - Market size and forecast 2025-2030 ($ thousand)
Chart on France - Year-over-year growth 2025-2030 (%)
Data Table on France - Year-over-year growth 2025-2030 (%)

12.4.4 Italy - Market size and forecast 2025-2030

Chart on Italy - Market size and forecast 2025-2030 ($ thousand)
Data Table on Italy - Market size and forecast 2025-2030 ($ thousand)
Chart on Italy - Year-over-year growth 2025-2030 (%)
Data Table on Italy - Year-over-year growth 2025-2030 (%)

12.4.5 Spain - Market size and forecast 2025-2030

Chart on Spain - Market size and forecast 2025-2030 ($ thousand)
Data Table on Spain - Market size and forecast 2025-2030 ($ thousand)
Chart on Spain - Year-over-year growth 2025-2030 (%)
Data Table on Spain - Year-over-year growth 2025-2030 (%)

12.4.6 The Netherlands - Market size and forecast 2025-2030

Chart on The Netherlands - Market size and forecast 2025-2030 ($ thousand)
Data Table on The Netherlands - Market size and forecast 2025-2030 ($ thousand)
Chart on The Netherlands - Year-over-year growth 2025-2030 (%)
Data Table on The Netherlands - Year-over-year growth 2025-2030 (%)

12.5 APAC - Market size and forecast 2025-2030

Chart on APAC - Market size and forecast 2025-2030 ($ thousand)
Data Table on APAC - Market size and forecast 2025-2030 ($ thousand)
Chart on APAC - Year-over-year growth 2025-2030 (%)
Data Table on APAC - Year-over-year growth 2025-2030 (%)
Chart on Regional Comparison - APAC
Data Table on Regional Comparison - APAC

12.5.1 China - Market size and forecast 2025-2030

Chart on China - Market size and forecast 2025-2030 ($ thousand)
Data Table on China - Market size and forecast 2025-2030 ($ thousand)
Chart on China - Year-over-year growth 2025-2030 (%)
Data Table on China - Year-over-year growth 2025-2030 (%)

12.5.2 India - Market size and forecast 2025-2030

Chart on India - Market size and forecast 2025-2030 ($ thousand)
Data Table on India - Market size and forecast 2025-2030 ($ thousand)
Chart on India - Year-over-year growth 2025-2030 (%)
Data Table on India - Year-over-year growth 2025-2030 (%)

12.5.3 Japan - Market size and forecast 2025-2030

Chart on Japan - Market size and forecast 2025-2030 ($ thousand)
Data Table on Japan - Market size and forecast 2025-2030 ($ thousand)
Chart on Japan - Year-over-year growth 2025-2030 (%)
Data Table on Japan - Year-over-year growth 2025-2030 (%)

12.5.4 South Korea - Market size and forecast 2025-2030

Chart on South Korea - Market size and forecast 2025-2030 ($ thousand)
Data Table on South Korea - Market size and forecast 2025-2030 ($ thousand)
Chart on South Korea - Year-over-year growth 2025-2030 (%)
Data Table on South Korea - Year-over-year growth 2025-2030 (%)

12.5.5 Australia - Market size and forecast 2025-2030

Chart on Australia - Market size and forecast 2025-2030 ($ thousand)
Data Table on Australia - Market size and forecast 2025-2030 ($ thousand)
Chart on Australia - Year-over-year growth 2025-2030 (%)
Data Table on Australia - Year-over-year growth 2025-2030 (%)

12.5.6 Indonesia - Market size and forecast 2025-2030

Chart on Indonesia - Market size and forecast 2025-2030 ($ thousand)
Data Table on Indonesia - Market size and forecast 2025-2030 ($ thousand)
Chart on Indonesia - Year-over-year growth 2025-2030 (%)
Data Table on Indonesia - Year-over-year growth 2025-2030 (%)

12.6 Middle East and Africa - Market size and forecast 2025-2030

Chart on Middle East and Africa - Market size and forecast 2025-2030 ($ thousand)
Data Table on Middle East and Africa - Market size and forecast 2025-2030 ($ thousand)
Chart on Middle East and Africa - Year-over-year growth 2025-2030 (%)
Data Table on Middle East and Africa - Year-over-year growth 2025-2030 (%)
Chart on Regional Comparison - Middle East and Africa
Data Table on Regional Comparison - Middle East and Africa

12.6.1 South Africa - Market size and forecast 2025-2030

Chart on South Africa - Market size and forecast 2025-2030 ($ thousand)
Data Table on South Africa - Market size and forecast 2025-2030 ($ thousand)
Chart on South Africa - Year-over-year growth 2025-2030 (%)
Data Table on South Africa - Year-over-year growth 2025-2030 (%)

12.6.2 Saudi Arabia - Market size and forecast 2025-2030

Chart on Saudi Arabia - Market size and forecast 2025-2030 ($ thousand)
Data Table on Saudi Arabia - Market size and forecast 2025-2030 ($ thousand)
Chart on Saudi Arabia - Year-over-year growth 2025-2030 (%)
Data Table on Saudi Arabia - Year-over-year growth 2025-2030 (%)

12.6.3 UAE - Market size and forecast 2025-2030

Chart on UAE - Market size and forecast 2025-2030 ($ thousand)
Data Table on UAE - Market size and forecast 2025-2030 ($ thousand)
Chart on UAE - Year-over-year growth 2025-2030 (%)
Data Table on UAE - Year-over-year growth 2025-2030 (%)

12.6.4 Nigeria - Market size and forecast 2025-2030

Chart on Nigeria - Market size and forecast 2025-2030 ($ thousand)
Data Table on Nigeria - Market size and forecast 2025-2030 ($ thousand)
Chart on Nigeria - Year-over-year growth 2025-2030 (%)
Data Table on Nigeria - Year-over-year growth 2025-2030 (%)

12.6.5 Egypt - Market size and forecast 2025-2030

Chart on Egypt - Market size and forecast 2025-2030 ($ thousand)
Data Table on Egypt - Market size and forecast 2025-2030 ($ thousand)
Chart on Egypt - Year-over-year growth 2025-2030 (%)
Data Table on Egypt - Year-over-year growth 2025-2030 (%)

12.7 South America - Market size and forecast 2025-2030

Chart on South America - Market size and forecast 2025-2030 ($ thousand)
Data Table on South America - Market size and forecast 2025-2030 ($ thousand)
Chart on South America - Year-over-year growth 2025-2030 (%)
Data Table on South America - Year-over-year growth 2025-2030 (%)
Chart on Regional Comparison - South America
Data Table on Regional Comparison - South America

12.7.1 Brazil - Market size and forecast 2025-2030

Chart on Brazil - Market size and forecast 2025-2030 ($ thousand)
Data Table on Brazil - Market size and forecast 2025-2030 ($ thousand)
Chart on Brazil - Year-over-year growth 2025-2030 (%)
Data Table on Brazil - Year-over-year growth 2025-2030 (%)

12.7.2 Argentina - Market size and forecast 2025-2030

Chart on Argentina - Market size and forecast 2025-2030 ($ thousand)
Data Table on Argentina - Market size and forecast 2025-2030 ($ thousand)
Chart on Argentina - Year-over-year growth 2025-2030 (%)
Data Table on Argentina - Year-over-year growth 2025-2030 (%)

12.7.3 Chile - Market size and forecast 2025-2030

Chart on Chile - Market size and forecast 2025-2030 ($ thousand)
Data Table on Chile - Market size and forecast 2025-2030 ($ thousand)
Chart on Chile - Year-over-year growth 2025-2030 (%)
Data Table on Chile - Year-over-year growth 2025-2030 (%)

12.8 Market opportunity by geography

Market opportunity by geography ($ thousand)
Data Tables on Market opportunity by geography ($ thousand)

13. Drivers, Challenges, and Opportunity

13.1 Market drivers

Increasing health and wellness consciousness
Growing environmental concerns and shift away from single-use plastics
Demand for convenience, portability, and active lifestyle

13.2 Market challenges

High initial cost and recurring maintenance expenses
Intense competition from broad range of substitute products
Lack of standardization and prevalent consumer confusion

13.3 Impact of drivers and challenges

Impact of drivers and challenges in 2025 and 2030

13.4 Market opportunities

Integration of smart technologies and enhanced user experience
Advancements in filtration media and multi-stage purification
Focus on product premiumization, customization, and aesthetic design

14. Competitive Landscape

14.1 Overview

14.2

Overview on criticality of inputs and factors of differentiation

14.3 Landscape disruption

Overview on factors of disruption

14.4 Industry risks

Impact of key risks on business

15. Competitive Analysis

15.1 Companies profiled

Companies covered

15.2 Company ranking index

15.3 Market positioning of companies

Matrix on companies position and classification

15.4 Aquamira Technologies Inc.

Aquamira Technologies Inc. - Overview
Aquamira Technologies Inc. - Product / Service
Aquamira Technologies Inc. - Key offerings
SWOT

15.5 Campbell Manufacturing Inc.

Campbell Manufacturing Inc. - Overview
Campbell Manufacturing Inc. - Product / Service
Campbell Manufacturing Inc. - Key offerings
SWOT

15.6 Cascade Designs Inc.

Cascade Designs Inc. - Overview
Cascade Designs Inc. - Product / Service
Cascade Designs Inc. - Key offerings
SWOT

15.7 Clearbrook LLC

Clearbrook LLC - Overview
Clearbrook LLC - Product / Service
Clearbrook LLC - Key offerings
SWOT

15.8 Clearly Filtered Inc.

Clearly Filtered Inc. - Overview
Clearly Filtered Inc. - Product / Service
Clearly Filtered Inc. - Key offerings
SWOT

15.9 Epic Water Filters

Epic Water Filters - Overview
Epic Water Filters - Product / Service
Epic Water Filters - Key offerings
SWOT

15.10 Grayl Inc.

Grayl Inc. - Overview
Grayl Inc. - Product / Service
Grayl Inc. - Key offerings
SWOT

15.11 Icon LifeSaver Ltd.

Icon LifeSaver Ltd. - Overview
Icon LifeSaver Ltd. - Product / Service
Icon LifeSaver Ltd. - Key offerings
SWOT

15.12 Ion Exchange India Ltd.

Ion Exchange India Ltd. - Overview
Ion Exchange India Ltd. - Business segments
Ion Exchange India Ltd. - Key offerings
Ion Exchange India Ltd. - Segment focus
SWOT

15.13 Katadyn Products Inc.

Katadyn Products Inc. - Overview
Katadyn Products Inc. - Product / Service
Katadyn Products Inc. - Key offerings
SWOT

15.14 KOR Water Inc.

KOR Water Inc. - Overview
KOR Water Inc. - Product / Service
KOR Water Inc. - Key offerings
SWOT

15.15 LARQ Inc.

LARQ Inc. - Overview
LARQ Inc. - Product / Service
LARQ Inc. - Key offerings
SWOT

15.16 Sawyer Products Inc.

Sawyer Products Inc. - Overview
Sawyer Products Inc. - Product / Service
Sawyer Products Inc. - Key offerings
SWOT

15.17 Water to Go Ltd.

Water to Go Ltd. - Overview
Water to Go Ltd. - Product / Service
Water to Go Ltd. - Key offerings
SWOT

15.18 WaterWell

WaterWell - Overview
WaterWell - Product / Service
WaterWell - Key offerings
SWOT

16. Appendix

16.1 Scope of the report

Market definition
Objectives
Notes and caveats

16.2 Inclusions and exclusions checklist

Inclusions checklist
Exclusions checklist

16.3 Currency conversion rates for US$

16.4 Research methodology

16.5 Data procurement

Information sources

16.6 Data validation

16.7 Validation techniques employed for market sizing

16.8 Data synthesis

16.9 360 degree market analysis

16.10 List of abbreviations

Research Methodology

Technavio presents a detailed picture of the market by way of study, synthesis, and summation of data from multiple sources. The analysts have presented the various facets of the market with a particular focus on identifying the key industry influencers. The data thus presented is comprehensive, reliable, and the result of extensive research, both primary and secondary.

INFORMATION SOURCES

Primary sources

  • Manufacturers and suppliers
  • Channel partners
  • Industry experts
  • Strategic decision makers

Secondary sources

  • Industry journals and periodicals
  • Government data
  • Financial reports of key industry players
  • Historical data
  • Press releases

DATA ANALYSIS

Data Synthesis

  • Collation of data
  • Estimation of key figures
  • Analysis of derived insights

Data Validation

  • Triangulation with data models
  • Reference against proprietary databases
  • Corroboration with industry experts

REPORT WRITING

Qualitative

  • Market drivers
  • Market challenges
  • Market trends
  • Five forces analysis

Quantitative

  • Market size and forecast
  • Market segmentation
  • Geographical insights
  • Competitive landscape

Interested in this report?

Get your sample now to see our research methodology and insights!

Download Now

Frequently Asked Questions

Water Bottles With Filters market growth will increase by USD 514541.6 thousand thousand during 2026-2030.

The Water Bottles With Filters market is expected to grow at a CAGR of 18.2% during 2026-2030.

Water Bottles With Filters market is segmented by Type (Metal, Plastic, Others) Distribution channel (Offline, Online) End-user (Individual, Commercial, Institutional)

Aquamira Technologies Inc., Campbell Manufacturing Inc., Cascade Designs Inc., Clearbrook LLC, Clearly Filtered Inc., Contigo Brands, Epic Water Filters, Extract LLC, Grayl Inc., Icon LifeSaver Ltd., Ion Exchange India Ltd., Katadyn Products Inc., KOR Water Inc., LARQ Inc., Sawyer Products Inc., Water to Go Ltd., WaterWell are a few of the key vendors in the Water Bottles With Filters market.

North America will register the highest growth rate of 35.8% among the other regions. Therefore, the Water Bottles With Filters market in North America is expected to garner significant business opportunities for the vendors during the forecast period.

US, Canada, Mexico, Germany, UK, France, Italy, Spain, The Netherlands, China, India, Japan, South Korea, Australia, Indonesia, South Africa, Saudi Arabia, UAE, Nigeria, Egypt, Brazil, Argentina, Chile

  • Increasing health and wellness consciousness is the driving factor this market.

The Water Bottles With Filters market vendors should focus on grabbing business opportunities from the Type segment as it accounted for the largest market share in the base year.
RIA - Research AI Assistant
Ask RIA