5G Fixed Wireless Access Market Size 2025-2029
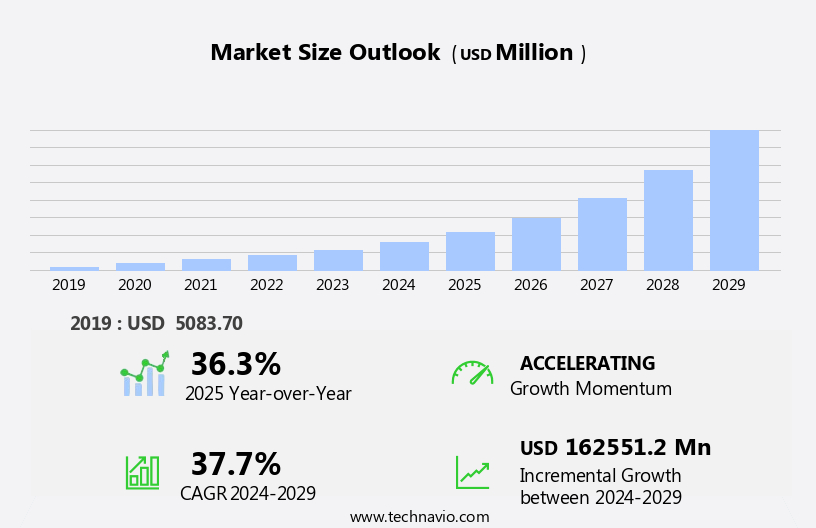
The 5G fixed wireless access (FWA) market size is forecast to increase by USD 162.55 billion, at a CAGR of 37.7% between 2024 and 2029.
- The market is poised for significant growth, driven by government initiatives to expand high-speed Internet network connectivity and the integration of edge computing. These factors create a strategic opportunity for businesses to enhance their digital capabilities and improve operational efficiency. However, challenges persist in the form of spectrum availability and allocation. As the demand for 5G FWA technology increases, securing sufficient spectrum to support the growing user base and data traffic becomes a critical concern. Companies must navigate this complex landscape by engaging in strategic partnerships, exploring alternative spectrum options, and investing in advanced technologies to optimize spectrum usage.
- By addressing these challenges and capitalizing on the market's drivers, organizations can effectively position themselves for success in the evolving 5G FWA ecosystem. The technology is expected to revolutionize various sectors, including video conferencing solutions, remote work, and professional settings, by enabling real-time communication and data transfer.
What will be the Size of the 5G Fixed Wireless Access (FWA) Market during the forecast period?

Explore in-depth regional segment analysis with market size data - historical 2019-2023 and forecasts 2025-2029 - in the full report.
Request Free Sample
The market continues to evolve, driven by the ongoing development of next-generation networks and the integration of various technologies. Network slicing and carrier aggregation are key components, enabling efficient use of spectrum and delivering customized services to users. 5G New Radio (NR) technology is at the forefront, offering increased capacity, lower latency, and higher throughput. Applications span across multiple sectors, including smart cities, industrial IoT, and autonomous vehicles. Edge computing plays a crucial role in processing data closer to the source, reducing latency and improving performance. Fiber backhaul and microwave backhaul are utilized to ensure reliable connectivity, while antenna systems and power amplifiers enhance network coverage and capacity.
Spectrum allocation remains a critical factor, with frequency bands continually being evaluated for optimal usage. Regulatory compliance and data encryption are essential for securing networks and protecting user information. 5G FWA is also making strides in rural broadband deployment, offering an alternative to traditional fiber optic cables. Operational costs and deployment costs are under constant scrutiny, with open RAN and cloud RAN gaining traction for their cost-effective and flexible solutions. Future innovations, such as massive MIMO and RF components, are poised to further enhance network capabilities. Enterprise deployment and remote monitoring are also on the rise, with private networks becoming increasingly popular for secure and efficient communication.
Spectrum licensing and 5G advanced continue to shape the technology roadmap, with ongoing research and development ensuring a dynamic and evolving market landscape. The integration of various technologies, from user equipment to network management, is essential for delivering high-performance, reliable, and secure 5G FWA services.
How is this 5G Fixed Wireless Access (FWA) Industry segmented?
The 5G fixed wireless access (FWA) industry research report provides comprehensive data (region-wise segment analysis), with forecasts and estimates in "USD million" for the period 2025-2029, as well as historical data from 2019-2023 for the following segments.
- Type
- Application
- Residential
- Commercial
- Industrial
- Government
- Frequency Range
- Sub 6GHz
- 24-39 GHz
- Above 39 GHz
- Consumer
- Geography
- North America
- Europe
- Middle East and Africa
- APAC
- South America
- Rest of World (ROW)
By Type Insights
The services segment is estimated to witness significant growth during the forecast period.
The 5G fixed wireless access market is experiencing significant growth as telecom providers prioritize this technology to deliver high-speed Internet connectivity to various sectors. FWA services, which enable wireless network connectivity for residential, enterprise, and industrial applications, have gained popularity due to their affordability and flexibility. Incorporating advanced technologies such as massive MIMO, microwave backhaul, and satellite backhaul, FWA networks offer reliable and low-latency communication. Smart cities and industrial IoT are major contributors to the market's expansion, with data encryption and regulatory compliance playing essential roles in securing the vast amounts of data generated. Base stations and user equipment are critical components in FWA networks, with network management and rf components ensuring optimal performance.
Next-generation networks and technology roadmaps pave the way for future innovations, including edge computing, autonomous vehicles, and remote monitoring. Operational costs, including deployment and spectrum licensing, are significant considerations for providers. Spectrum allocation and carrier aggregation are essential strategies to maximize network efficiency and capacity. Enterprise deployment, private networks, and network slicing are other key trends, with fiber backhaul and small cells complementing FWA networks to ensure seamless connectivity. In the technology landscape, 5G advanced features such as 5G NR and network slicing are transforming the market. Connected cars and rural broadband are emerging applications, with open RAN and cloud RAN architectures offering flexibility and scalability.
Frequency bands and wireless routers are essential elements in FWA networks, ensuring optimal performance and coverage. Overall, the 5G fixed wireless access market is poised for continued growth, driven by the increasing demand for high-speed, reliable, and affordable wireless connectivity.

Request Free Sample
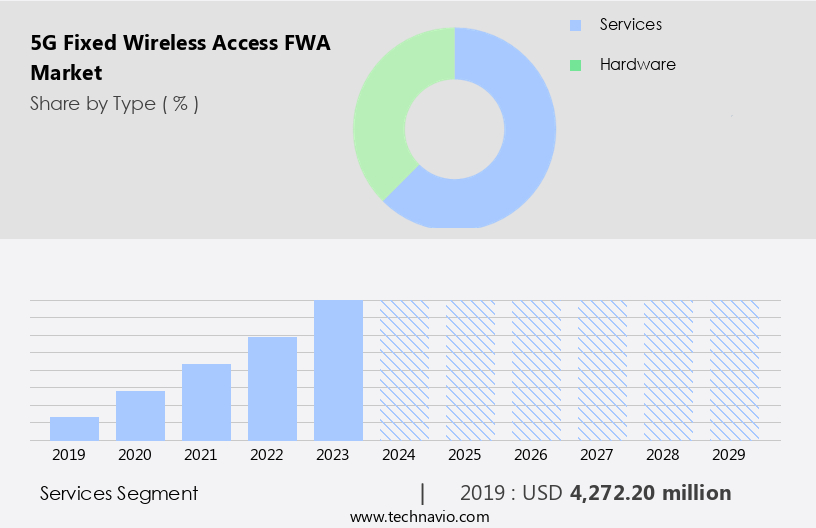
The Services segment was valued at USD 4.27 billion in 2019 and showed a gradual increase during the forecast period.
Regional Analysis
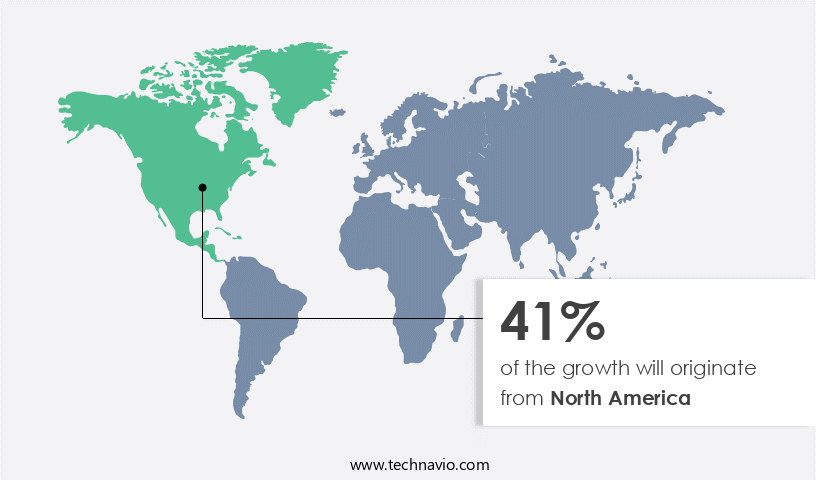
North America is estimated to contribute 41% to the growth of the global market during the forecast period.Technavio's analysts have elaborately explained the regional trends and drivers that shape the market during the forecast period.

Request Free Sample
The Sub-6 GHz segment in the market plays a crucial role in the telecommunications industry, offering extended range and reliable signal propagation for addressing connectivity challenges in urban and non-urban areas. This frequency band is essential for broadband connectivity, enabling applications that demand consistent and robust data transmission. As a significant component of 5G FWA, the Sub-6 GHz band strikes a balance between coverage and capacity, ensuring the smooth operation of modern communication systems. Smart cities and industrial IoT (IIoT) applications rely on the Sub-6 GHz band for reliable and secure data encryption and regulatory compliance. Satellite backhaul and microwave backhaul complement the Sub-6 GHz band in delivering high-speed connectivity, particularly in rural and remote areas.
Base stations and antenna systems, equipped with power amplifiers, are integral to the deployment of 5G FWA networks. Next-generation networks and technology roadmaps prioritize the Sub-6 GHz band for its ability to support massive MIMO and network slicing, enhancing network management and operational costs. Connected cars and autonomous vehicles, as well as enterprise deployment and remote monitoring, benefit from the low latency and high bandwidth offered by the Sub-6 GHz band. Spectrum licensing and allocation, carrier aggregation, and 5G advanced features like 5G NR further extend the capabilities of the Sub-6 GHz band. Future innovations in edge computing and frequency bands will continue to drive the growth of the 5G FWA market, with wireless routers and small cells playing a crucial role in residential deployment.
Overall, the Sub-6 GHz band's versatility and reliability make it a cornerstone of the 5G FWA market.
Market Dynamics
Our researchers analyzed the data with 2024 as the base year, along with the key drivers, trends, and challenges. A holistic analysis of drivers will help companies refine their marketing strategies to gain a competitive advantage.
The global 5G FWA market is witnessing significant growth, driven by dynamic 5G FWA market trends that highlight the increasing adoption of 5G Fixed Wireless Access. The expanding 5G FWA market size reflects robust demand, particularly for rural broadband deployment. This substantial 5G FWA market growth is fueled by the availability of efficient 5G FWA CPE (Customer Premises Equipment), delivering high-speed broadband wireless solutions.
Telecom operators 5G FWA are actively investing to provide crucial last-mile connectivity, leveraging both mmWave FWA and sub-6 GHz FWA technologies. This enables seamless home internet access 5G FWA and robust business connectivity 5G FWA. Key regions like the North America 5G FWA market and Asia-Pacific 5G FWA market are leading efforts in digital divide bridging. Advanced capabilities like network slicing 5G FWA and the deployment of powerful 5G FWA routers ensure low latency 5G FWA, revolutionizing connectivity worldwide.
What are the key market drivers leading to the rise in the adoption of 5G Fixed Wireless Access (FWA) Industry?
- The government's initiatives to promote high-speed Internet network connectivity serve as the primary catalyst for market growth in this sector.
- The global push towards next generation networks is fueling significant investments in advanced communication infrastructure. ICT infrastructure forms the foundation for data flows and information networks, making it a critical focus area for governments and businesses alike. The development of high-speed communication networks, including 5G Fixed Wireless Access (FWA), involves investments in antenna systems, power amplifiers, RF components, and network management solutions. Government initiatives to build smart cities and promote automation are driving demand for these technologies. For instance, in India, a high-level forum has been established to develop a vision, mission, and goals for 5G India 2020, along with a roadmap for future implementation.
- The automotive industry is also witnessing a surge in the adoption of connected cars, which necessitates robust communication networks. Rural broadband initiatives are another key application area for 5G FWA, as it offers a cost-effective and efficient solution for delivering high-speed internet to remote areas. Market participants are collaborating with governments and other stakeholders to build advanced network infrastructure. The technology roadmap for 5G FWA includes the deployment of user equipment (UE) and network management solutions to ensure seamless connectivity and optimal network performance. In conclusion, the market dynamics for 5G FWA are driven by government initiatives, the need for high-speed communication networks in various industries, and the increasing adoption of connected devices.
- The technology offers significant potential for rural broadband and the automotive industry, making it an exciting area for innovation and growth.
What are the market trends shaping the 5G Fixed Wireless Access (FWA) Industry?
- Edge computing integration is gaining significant traction in the market. This trend reflects the increasing demand for real-time data processing and reduced latency in applications.
- The market is experiencing significant growth due to the integration of edge computing technology. Edge computing allows data processing closer to the source, reducing latency and improving application performance. This convergence of 5G FWA and edge computing is transforming industries such as manufacturing, healthcare, retail, gaming, smart cities, and agriculture. With data processing occurring near end-users and connected devices, latency is significantly reduced, enabling real-time applications like augmented reality (AR), virtual reality (VR), autonomous vehicles, remote healthcare, and smart city infrastructure. Massive MIMO technology and microwave backhaul are crucial components of 5G FWA, ensuring high-speed data transmission and reliable connectivity.
- Spectrum licensing and private networks are also essential for businesses seeking secure and dedicated connectivity. Operational costs can be minimized through remote monitoring and management of networks, while 5G advanced features such as ultra-reliable low-latency communications (URLLC) and massive machine-type communications (mMTC) offer new opportunities for innovation. In conclusion, the integration of 5G FWA with edge computing is a game-changer for various industries, enabling real-time data processing and low-latency applications. The use of Massive MIMO, microwave backhaul, spectrum licensing, and private networks further strengthens the market's potential. Businesses can look forward to operational cost savings, remote monitoring, and the implementation of future innovations in their operations.
What challenges does the 5G Fixed Wireless Access (FWA) Industry face during its growth?
- The growth of the industry is significantly impacted by challenges related to spectrum availability and allocation. This issue necessitates careful consideration and efficient management to ensure the optimal utilization of this precious resource.
- The market faces significant challenges due to spectrum availability and allocation. The demand for suitable spectrum for 5G FWA deployments often surpasses the resources, leading to competition and regulatory hurdles. Different regions encounter unique challenges in making available the necessary spectrum bands for 5G FWA. For instance, the U.S. Has limited mid-band spectrum, Europe faces fragmented allocation, Asia requires balancing urban and rural areas, and Africa grapples with financial constraints. The most suitable spectrum for 5G FWA, primarily in the millimeter-wave (mm-Wave) bands (e.G., 24 GHz, 28 GHz, and 39 GHz), provides high data transfer rates but has limitations in signal propagation and range.
- As a result, denser infrastructure deployment is necessary. Technologies like network slicing and carrier aggregation can help optimize spectrum usage and improve network performance. Edge computing and small cells also play essential roles in enhancing 5G FWA capabilities. Wireless routers and frequency bands are crucial components in delivering 5G FWA services. Despite these challenges, the potential benefits of 5G FWA, such as faster speeds and lower latency, make it an attractive alternative to fiber backhaul for autonomous vehicles and other applications.
Exclusive Customer Landscape
The 5g fixed wireless access (fwa) market forecasting report includes the adoption lifecycle of the market, covering from the innovator's stage to the laggard's stage. It focuses on adoption rates in different regions based on penetration. Furthermore, the 5g fixed wireless access (fwa) market report also includes key purchase criteria and drivers of price sensitivity to help companies evaluate and develop their market growth analysis strategies.
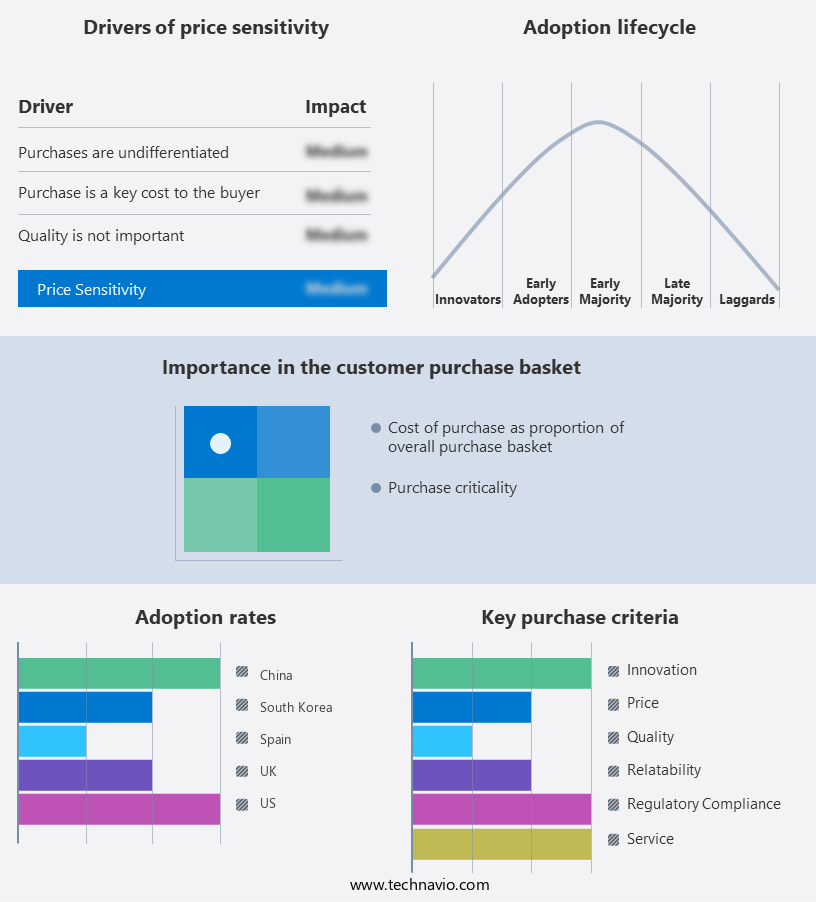
Customer Landscape
Key Companies & Market Insights
Companies are implementing various strategies, such as strategic alliances, 5g fixed wireless access (fwa) market forecast, partnerships, mergers and acquisitions, geographical expansion, and product/service launches, to enhance their presence in the industry.
AT&T Inc. - The company delivers 5G fixed wireless access services, enabling high-speed internet connectivity with a minimum download speed of 10Mbps and 1Mbps upload speed. This cutting-edge technology empowers users with reliable, fast, and flexible internet solutions. By leveraging the latest 5G infrastructure, the company ensures consistent performance and reduced latency, enhancing productivity and seamless online experiences.
The industry research and growth report includes detailed analyses of the competitive landscape of the market and information about key companies, including:
- AT&T Inc.
- Cisco Systems Inc.
- CommScope
- Ericsson
- Huawei Technologies Co., Ltd.
- Hrvatski Telekom
- Inseego Corp.
- Mimosa Networks, Inc.
- MTN Group
- Nokia Corporation
- Orange S.A.
- Qualcomm Technologies, Inc.
- Reliance Jio Infocomm Ltd.
- Samsung Electronics Co., Ltd.
- Siklu Communication Ltd.
- T-Mobile US, Inc.
- Telefónica S.A.
- Telus Corporation
- Verizon Communications Inc.
- ZTE Corporation
Qualitative and quantitative analysis of companies has been conducted to help clients understand the wider business environment as well as the strengths and weaknesses of key industry players. Data is qualitatively analyzed to categorize companies as pure play, category-focused, industry-focused, and diversified; it is quantitatively analyzed to categorize companies as dominant, leading, strong, tentative, and weak.
Recent Development and News in 5G Fixed Wireless Access (FWA) Market
- In January 2024, Verizon Communications announced the launch of its 5G Fixed Wireless Access (FWA) service in select US cities, marking a significant expansion of its 5G network capabilities (Verizon Communications Press Release). This move aimed to provide high-speed internet connectivity to homes and businesses without the need for traditional wired infrastructure.
- In March 2024, Nokia and T-Mobile US signed a strategic partnership to accelerate the rollout of 5G FWA services in the US. Under the agreement, Nokia supplied T-Mobile with 5G FWA equipment, enabling T-Mobile to expand its 5G network coverage and capacity (Nokia Press Release).
- In May 2024, Qualcomm, a leading semiconductor company, announced the successful demonstration of a 5G FWA solution that could deliver multi-gigabit speeds using a single 5G antenna. This technological advancement could significantly reduce the cost and complexity of deploying 5G FWA networks (Qualcomm Press Release).
- In April 2025, the European Union (EU) approved a â¬4 billion funding program to support the deployment of 5G FWA networks across Europe. The initiative, known as the "5G Connect" program, aimed to improve digital infrastructure and connectivity, particularly in rural areas, where traditional broadband coverage is limited (European Commission Press Release).
Research Analyst Overview
- The market is experiencing significant growth, driven by consumer behavior shifts towards remote work and increased demand for high-speed, reliable internet connections. Energy efficiency is a key consideration as FWA providers adopt 5G Non-Standalone (NSA) and Standalone (SA) technologies to enhance network coverage and capacity. Competition analysis reveals intense rivalry among players, with cognitive radio and machine learning (ML) technologies utilized for fault management and performance optimization. Standards compliance, customer support, and network security are essential for market penetration, while technology adoption is facilitated by network slicing, open interfaces, and dynamic spectrum access. Capacity planning and upgrade services are crucial for managing power consumption and ensuring network optimization.
- Data analytics and billing systems enable predictive analytics and performance management, while installation, technical support, and maintenance services ensure seamless user experience. Environmental impact is a growing concern, with providers implementing green initiatives to minimize their carbon footprint. Network security remains a priority, with AI and ML-driven predictive analytics enhancing service assurance. Overall, the FWA market is characterized by ongoing innovation, with sub-6 GHz spectrum and performance management playing critical roles in delivering superior user experiences.
Dive into Technavio's robust research methodology, blending expert interviews, extensive data synthesis, and validated models for unparalleled 5G Fixed Wireless Access (FWA) Market insights. See full methodology.
Market Scope
|
Report Coverage
|
Details
|
Page number
|
227
|
Base year
|
2024
|
Historic period
|
2019-2023 |
Forecast period
|
2025-2029
|
Growth momentum & CAGR
|
Accelerate at a CAGR of 37.7%
|
Market growth 2025-2029
|
USD 162551.2 million
|
Market structure
|
Fragmented
|
YoY growth 2024-2025(%)
|
36.3
|
Key countries
|
US, Canada, Germany, UK, Italy, France, China, India, Japan, Brazil, Egypt, UAE, Oman, Argentina, KSA, UAE, Brazil, and Rest of World (ROW)
|
Competitive landscape
|
Leading Companies, Market Positioning of Companies, Competitive Strategies, and Industry Risks
|
Request Free Sample
What are the Key Data Covered in this 5G Fixed Wireless Access (FWA) Market Research and Growth Report?
- CAGR of the 5G Fixed Wireless Access (FWA) industry during the forecast period
- Detailed information on factors that will drive the growth and forecasting between 2025 and 2029
- Precise estimation of the size of the market and its contribution of the industry in focus to the parent market
- Accurate predictions about upcoming growth and trends and changes in consumer behaviour
- Growth of the market across North America, Europe, APAC, Middle East and Africa, and South America
- Thorough analysis of the market's competitive landscape and detailed information about companies
- Comprehensive analysis of factors that will challenge the 5g fixed wireless access (fwa) market growth of industry companies
We can help! Our analysts can customize this 5g fixed wireless access (fwa) market research report to meet your requirements.
Get in touch
1 Executive Summary
- 1.1 Market overview
- Executive Summary - Chart on Market Overview
- Executive Summary - Data Table on Market Overview
- Executive Summary - Chart on Global Market Characteristics
- Executive Summary - Chart on Market by Geography
- Executive Summary - Chart on Market Segmentation by Type
- Executive Summary - Chart on Market Segmentation by Application
- Executive Summary - Chart on Market Segmentation by Frequency Range
- Executive Summary - Chart on Market Segmentation by Consumer
- Executive Summary - Chart on Incremental Growth
- Executive Summary - Data Table on Incremental Growth
- Executive Summary - Chart on Company Market Positioning
2 Technavio Analysis
- 2.1 Analysis of price sensitivity, lifecycle, customer purchase basket, adoption rates, and purchase criteria
- Analysis of price sensitivity, lifecycle, customer purchase basket, adoption rates, and purchase criteria
- 2.2 Criticality of inputs and Factors of differentiation
- Overview on criticality of inputs and factors of differentiation
- 2.3 Factors of disruption
- Overview on factors of disruption
- 2.4 Impact of drivers and challenges
- Impact of drivers and challenges in 2024 and 2029
3 Market Landscape
- 3.1 Market ecosystem
- Parent Market
- Data Table on - Parent Market
- 3.2 Market characteristics
- Market characteristics analysis
4 Market Sizing
- 4.1 Market definition
- Offerings of companies included in the market definition
- 4.2 Market segment analysis
- 4.4 Market outlook: Forecast for 2024-2029
- Chart on Global - Market size and forecast 2024-2029 ($ million)
- Data Table on Global - Market size and forecast 2024-2029 ($ million)
- Chart on Global Market: Year-over-year growth 2024-2029 (%)
- Data Table on Global Market: Year-over-year growth 2024-2029 (%)
5 Historic Market Size
- 5.1 Global 5G Fixed Wireless Access (FWA) Market 2019 - 2023
- Historic Market Size - Data Table on Global 5G Fixed Wireless Access (FWA) Market 2019 - 2023 ($ million)
- 5.2 Type segment analysis 2019 - 2023
- Historic Market Size - Type Segment 2019 - 2023 ($ million)
- 5.3 Application segment analysis 2019 - 2023
- Historic Market Size - Application Segment 2019 - 2023 ($ million)
- 5.4 Frequency Range segment analysis 2019 - 2023
- Historic Market Size - Frequency Range Segment 2019 - 2023 ($ million)
- 5.5 Consumer segment analysis 2019 - 2023
- Historic Market Size - Consumer Segment 2019 - 2023 ($ million)
- 5.6 Geography segment analysis 2019 - 2023
- Historic Market Size - Geography Segment 2019 - 2023 ($ million)
- 5.7 Country segment analysis 2019 - 2023
- Historic Market Size - Country Segment 2019 - 2023 ($ million)
6 Qualitative Analysis
- 6.1 The AI impact on global 5G Fixed Wireless Access (FWA) market
7 Five Forces Analysis
- 7.1 Five forces summary
- Five forces analysis - Comparison between 2024 and 2029
- 7.2 Bargaining power of buyers
- Bargaining power of buyers - Impact of key factors 2024 and 2029
- 7.3 Bargaining power of suppliers
- Bargaining power of suppliers - Impact of key factors in 2024 and 2029
- 7.4 Threat of new entrants
- Threat of new entrants - Impact of key factors in 2024 and 2029
- 7.5 Threat of substitutes
- Threat of substitutes - Impact of key factors in 2024 and 2029
- 7.6 Threat of rivalry
- Threat of rivalry - Impact of key factors in 2024 and 2029
- 7.7 Market condition
- Chart on Market condition - Five forces 2024 and 2029
8 Market Segmentation by Type
- 8.1 Market segments
- Chart on Type - Market share (2024-2029) (%)
- Data Table on Type - Market share (2024-2029) (%)
- 8.2 Comparison by Type
- Chart on Comparison by Type
- Data Table on Comparison by Type
- 8.3 Services - Market size and forecast (2024-2029)
- Chart on Services - Market size and forecast (2024-2029) ($ million)
- Data Table on Services - Market size and forecast (2024-2029) ($ million)
- Chart on Services - Year-over-year growth (2024-2029) (%)
- Data Table on Services - Year-over-year growth (2024-2029) (%)
- 8.4 Hardware - Market size and forecast (2024-2029)
- Chart on Hardware - Market size and forecast (2024-2029) ($ million)
- Data Table on Hardware - Market size and forecast (2024-2029) ($ million)
- Chart on Hardware - Year-over-year growth (2024-2029) (%)
- Data Table on Hardware - Year-over-year growth (2024-2029) (%)
- 8.5 Market opportunity by Type
- Market opportunity by Type ($ million)
- Data Table on Market opportunity by Type ($ million)
9 Market Segmentation by Application
- 9.1 Market segments
- Chart on Application - Market share (2024-2029) (%)
- Data Table on Application - Market share (2024-2029) (%)
- 9.2 Comparison by Application
- Chart on Comparison by Application
- Data Table on Comparison by Application
- 9.3 Residential - Market size and forecast (2024-2029)
- Chart on Residential - Market size and forecast (2024-2029) ($ million)
- Data Table on Residential - Market size and forecast (2024-2029) ($ million)
- Chart on Residential - Year-over-year growth (2024-2029) (%)
- Data Table on Residential - Year-over-year growth (2024-2029) (%)
- 9.4 Commercial - Market size and forecast (2024-2029)
- Chart on Commercial - Market size and forecast (2024-2029) ($ million)
- Data Table on Commercial - Market size and forecast (2024-2029) ($ million)
- Chart on Commercial - Year-over-year growth (2024-2029) (%)
- Data Table on Commercial - Year-over-year growth (2024-2029) (%)
- 9.5 Industrial - Market size and forecast (2024-2029)
- Chart on Industrial - Market size and forecast (2024-2029) ($ million)
- Data Table on Industrial - Market size and forecast (2024-2029) ($ million)
- Chart on Industrial - Year-over-year growth (2024-2029) (%)
- Data Table on Industrial - Year-over-year growth (2024-2029) (%)
- 9.6 Government - Market size and forecast (2024-2029)
- Chart on Government - Market size and forecast (2024-2029) ($ million)
- Data Table on Government - Market size and forecast (2024-2029) ($ million)
- Chart on Government - Year-over-year growth (2024-2029) (%)
- Data Table on Government - Year-over-year growth (2024-2029) (%)
- 9.7 Market opportunity by Application
- Market opportunity by Application ($ million)
- Data Table on Market opportunity by Application ($ million)
10 Market Segmentation by Frequency Range
- 10.1 Market segments
- Chart on Frequency Range - Market share (2024-2029) (%)
- Data Table on Frequency Range - Market share (2024-2029) (%)
- 10.2 Comparison by Frequency Range
- Chart on Comparison by Frequency Range
- Data Table on Comparison by Frequency Range
- 10.3 Sub 6GHz - Market size and forecast (2024-2029)
- Chart on Sub 6GHz - Market size and forecast (2024-2029) ($ million)
- Data Table on Sub 6GHz - Market size and forecast (2024-2029) ($ million)
- Chart on Sub 6GHz - Year-over-year growth (2024-2029) (%)
- Data Table on Sub 6GHz - Year-over-year growth (2024-2029) (%)
- 24-39 GHz - Market size and forecast (2024-2029)
- Chart on 24-39 GHz - Market size and forecast (2024-2029) ($ million)
- Data Table on 24-39 GHz - Market size and forecast (2024-2029) ($ million)
- Chart on 24-39 GHz - Year-over-year growth (2024-2029) (%)
- Data Table on 24-39 GHz - Year-over-year growth (2024-2029) (%)
- 10.5 Above 39 GHz - Market size and forecast (2024-2029)
- Chart on Above 39 GHz - Market size and forecast (2024-2029) ($ million)
- Data Table on Above 39 GHz - Market size and forecast (2024-2029) ($ million)
- Chart on Above 39 GHz - Year-over-year growth (2024-2029) (%)
- Data Table on Above 39 GHz - Year-over-year growth (2024-2029) (%)
- 10.6 Market opportunity by Frequency Range
- Market opportunity by Frequency Range ($ million)
- Data Table on Market opportunity by Frequency Range ($ million)
11 Market Segmentation by Consumer
- 11.1 Market segments
- Chart on Consumer - Market share (2024-2029) (%)
- Data Table on Consumer - Market share (2024-2029) (%)
- 11.2 Comparison by Consumer
- Chart on Comparison by Consumer
- Data Table on Comparison by Consumer
- 11.3 Urban - Market size and forecast (2024-2029)
- Chart on Urban - Market size and forecast (2024-2029) ($ million)
- Data Table on Urban - Market size and forecast (2024-2029) ($ million)
- Chart on Urban - Year-over-year growth (2024-2029) (%)
- Data Table on Urban - Year-over-year growth (2024-2029) (%)
- 11.4 Semi-urban - Market size and forecast (2024-2029)
- Chart on Semi-urban - Market size and forecast (2024-2029) ($ million)
- Data Table on Semi-urban - Market size and forecast (2024-2029) ($ million)
- Chart on Semi-urban - Year-over-year growth (2024-2029) (%)
- Data Table on Semi-urban - Year-over-year growth (2024-2029) (%)
- 11.5 Rural - Market size and forecast (2024-2029)
- Chart on Rural - Market size and forecast (2024-2029) ($ million)
- Data Table on Rural - Market size and forecast (2024-2029) ($ million)
- Chart on Rural - Year-over-year growth (2024-2029) (%)
- Data Table on Rural - Year-over-year growth (2024-2029) (%)
- 11.6 Market opportunity by Consumer
- Market opportunity by Consumer ($ million)
- Data Table on Market opportunity by Consumer ($ million)
12 Customer Landscape
- 12.1 Customer landscape overview
- Analysis of price sensitivity, lifecycle, customer purchase basket, adoption rates, and purchase criteria
13 Geographic Landscape
- 13.1 Geographic segmentation
- Chart on Market share by geography 2024-2029 (%)
- Data Table on Market share by geography 2024-2029 (%)
- 13.2 Geographic comparison
- Chart on Geographic comparison
- Data Table on Geographic comparison
- 13.3 North America - Market size and forecast 2024-2029
- Chart on North America - Market size and forecast 2024-2029 ($ million)
- Data Table on North America - Market size and forecast 2024-2029 ($ million)
- Chart on North America - Year-over-year growth 2024-2029 (%)
- Data Table on North America - Year-over-year growth 2024-2029 (%)
- 13.4 Europe - Market size and forecast 2024-2029
- Chart on Europe - Market size and forecast 2024-2029 ($ million)
- Data Table on Europe - Market size and forecast 2024-2029 ($ million)
- Chart on Europe - Year-over-year growth 2024-2029 (%)
- Data Table on Europe - Year-over-year growth 2024-2029 (%)
- 13.5 APAC - Market size and forecast 2024-2029
- Chart on APAC - Market size and forecast 2024-2029 ($ million)
- Data Table on APAC - Market size and forecast 2024-2029 ($ million)
- Chart on APAC - Year-over-year growth 2024-2029 (%)
- Data Table on APAC - Year-over-year growth 2024-2029 (%)
- 13.6 Middle East and Africa - Market size and forecast 2024-2029
- Chart on Middle East and Africa - Market size and forecast 2024-2029 ($ million)
- Data Table on Middle East and Africa - Market size and forecast 2024-2029 ($ million)
- Chart on Middle East and Africa - Year-over-year growth 2024-2029 (%)
- Data Table on Middle East and Africa - Year-over-year growth 2024-2029 (%)
- 13.7 South America - Market size and forecast 2024-2029
- Chart on South America - Market size and forecast 2024-2029 ($ million)
- Data Table on South America - Market size and forecast 2024-2029 ($ million)
- Chart on South America - Year-over-year growth 2024-2029 (%)
- Data Table on South America - Year-over-year growth 2024-2029 (%)
- 13.8 US - Market size and forecast 2024-2029
- Chart on US - Market size and forecast 2024-2029 ($ million)
- Data Table on US - Market size and forecast 2024-2029 ($ million)
- Chart on US - Year-over-year growth 2024-2029 (%)
- Data Table on US - Year-over-year growth 2024-2029 (%)
- 13.9 China - Market size and forecast 2024-2029
- Chart on China - Market size and forecast 2024-2029 ($ million)
- Data Table on China - Market size and forecast 2024-2029 ($ million)
- Chart on China - Year-over-year growth 2024-2029 (%)
- Data Table on China - Year-over-year growth 2024-2029 (%)
- 13.10 Germany - Market size and forecast 2024-2029
- Chart on Germany - Market size and forecast 2024-2029 ($ million)
- Data Table on Germany - Market size and forecast 2024-2029 ($ million)
- Chart on Germany - Year-over-year growth 2024-2029 (%)
- Data Table on Germany - Year-over-year growth 2024-2029 (%)
- 13.11 Canada - Market size and forecast 2024-2029
- Chart on Canada - Market size and forecast 2024-2029 ($ million)
- Data Table on Canada - Market size and forecast 2024-2029 ($ million)
- Chart on Canada - Year-over-year growth 2024-2029 (%)
- Data Table on Canada - Year-over-year growth 2024-2029 (%)
- 13.12 UK - Market size and forecast 2024-2029
- Chart on UK - Market size and forecast 2024-2029 ($ million)
- Data Table on UK - Market size and forecast 2024-2029 ($ million)
- Chart on UK - Year-over-year growth 2024-2029 (%)
- Data Table on UK - Year-over-year growth 2024-2029 (%)
- 13.13 France - Market size and forecast 2024-2029
- Chart on France - Market size and forecast 2024-2029 ($ million)
- Data Table on France - Market size and forecast 2024-2029 ($ million)
- Chart on France - Year-over-year growth 2024-2029 (%)
- Data Table on France - Year-over-year growth 2024-2029 (%)
- 13.14 Japan - Market size and forecast 2024-2029
- Chart on Japan - Market size and forecast 2024-2029 ($ million)
- Data Table on Japan - Market size and forecast 2024-2029 ($ million)
- Chart on Japan - Year-over-year growth 2024-2029 (%)
- Data Table on Japan - Year-over-year growth 2024-2029 (%)
- 13.15 India - Market size and forecast 2024-2029
- Chart on India - Market size and forecast 2024-2029 ($ million)
- Data Table on India - Market size and forecast 2024-2029 ($ million)
- Chart on India - Year-over-year growth 2024-2029 (%)
- Data Table on India - Year-over-year growth 2024-2029 (%)
- 13.16 Italy - Market size and forecast 2024-2029
- Chart on Italy - Market size and forecast 2024-2029 ($ million)
- Data Table on Italy - Market size and forecast 2024-2029 ($ million)
- Chart on Italy - Year-over-year growth 2024-2029 (%)
- Data Table on Italy - Year-over-year growth 2024-2029 (%)
- 13.17 South Korea - Market size and forecast 2024-2029
- Chart on South Korea - Market size and forecast 2024-2029 ($ million)
- Data Table on South Korea - Market size and forecast 2024-2029 ($ million)
- Chart on South Korea - Year-over-year growth 2024-2029 (%)
- Data Table on South Korea - Year-over-year growth 2024-2029 (%)
- 13.18 Market opportunity by geography
- Market opportunity by geography ($ million)
- Data Tables on Market opportunity by geography ($ million)
- 13.19 Brazil - Market size and forecast (2024-2029)
- Chart on Brazil - Market size and forecast (2024-2029) ($ million)
- Data Table on Brazil - Market size and forecast (2024-2029) ($ million)
- Chart on Brazil - Year-over-year growth (2024-2029) (%)
- Data Table on Brazil - Year-over-year growth (2024-2029) (%)
- 13.20 Egypt - Market size and forecast (2024-2029)
- Chart on Egypt - Market size and forecast (2024-2029) ($ million)
- Data Table on Egypt - Market size and forecast (2024-2029) ($ million)
- Chart on Egypt - Year-over-year growth (2024-2029) (%)
- Data Table on Egypt - Year-over-year growth (2024-2029) (%)
- 13.21 UAE - Market size and forecast (2024-2029)
- Chart on UAE - Market size and forecast (2024-2029) ($ million)
- Data Table on UAE - Market size and forecast (2024-2029) ($ million)
- Chart on UAE - Year-over-year growth (2024-2029) (%)
- Data Table on UAE - Year-over-year growth (2024-2029) (%)
- 13.22 Oman - Market size and forecast (2024-2029)
- Chart on Oman - Market size and forecast (2024-2029) ($ million)
- Data Table on Oman - Market size and forecast (2024-2029) ($ million)
- Chart on Oman - Year-over-year growth (2024-2029) (%)
- Data Table on Oman - Year-over-year growth (2024-2029) (%)
- 13.23 Argentina - Market size and forecast (2024-2029)
- Chart on Argentina - Market size and forecast (2024-2029) ($ million)
- Data Table on Argentina - Market size and forecast (2024-2029) ($ million)
- Chart on Argentina - Year-over-year growth (2024-2029) (%)
- Data Table on Argentina - Year-over-year growth (2024-2029) (%)
- 13.24 KSA - Market size and forecast (2024-2029)
- Chart on KSA - Market size and forecast (2024-2029) ($ million)
- Data Table on KSA - Market size and forecast (2024-2029) ($ million)
- Chart on KSA - Year-over-year growth (2024-2029) (%)
- Data Table on KSA - Year-over-year growth (2024-2029) (%)
- 13.25 Rest of World (ROW) - Market size and forecast (2024-2029)
- Chart on Rest of World (ROW) - Market size and forecast (2024-2029) ($ million)
- Data Table on Rest of World (ROW) - Market size and forecast (2024-2029) ($ million)
- Chart on Rest of World (ROW) - Year-over-year growth (2024-2029) (%)
- Data Table on Rest of World (ROW) - Year-over-year growth (2024-2029) (%)
14 Drivers, Challenges, and Opportunity/Restraints
- 14.3 Impact of drivers and challenges
- Impact of drivers and challenges in 2024 and 2029
- 14.4 Market opportunities/restraints
15 Competitive Landscape
- 15.2 Competitive Landscape
- Overview on criticality of inputs and factors of differentiation
- 15.3 Landscape disruption
- Overview on factors of disruption
- 15.4 Industry risks
- Impact of key risks on business
16 Competitive Analysis
- 16.2 Market positioning of companies
- Matrix on companies position and classification
- 16.3 AT&T Inc.
- AT&T Inc. - Overview
- AT&T Inc. - Product / Service
- AT&T Inc. - Key offerings
- 16.4 Cisco Systems Inc.
- Cisco Systems Inc. - Overview
- Cisco Systems Inc. - Product / Service
- Cisco Systems Inc. - Key offerings
- 16.5 CommScope
- CommScope - Overview
- CommScope - Product / Service
- CommScope - Key offerings
- 16.6 Ericsson
- Ericsson - Overview
- Ericsson - Product / Service
- Ericsson - Key offerings
- 16.7 Huawei Technologies Co., Ltd.
- Huawei Technologies Co., Ltd. - Overview
- Huawei Technologies Co., Ltd. - Product / Service
- Huawei Technologies Co., Ltd. - Key offerings
- 16.8 Hrvatski Telekom
- Hrvatski Telekom - Overview
- Hrvatski Telekom - Product / Service
- Hrvatski Telekom - Key offerings
- 16.9 Inseego Corp.
- Inseego Corp. - Overview
- Inseego Corp. - Product / Service
- Inseego Corp. - Key offerings
- 16.10 Mimosa Networks, Inc.
- Mimosa Networks, Inc. - Overview
- Mimosa Networks, Inc. - Product / Service
- Mimosa Networks, Inc. - Key offerings
- 16.11 MTN Group
- MTN Group - Overview
- MTN Group - Product / Service
- MTN Group - Key offerings
- 16.12 Nokia Corporation
- Nokia Corporation - Overview
- Nokia Corporation - Product / Service
- Nokia Corporation - Key offerings
- 16.13 Orange S.A.
- Orange S.A. - Overview
- Orange S.A. - Product / Service
- Orange S.A. - Key offerings
- 16.14 Qualcomm Technologies, Inc.
- Qualcomm Technologies, Inc. - Overview
- Qualcomm Technologies, Inc. - Product / Service
- Qualcomm Technologies, Inc. - Key offerings
- 16.15 Reliance Jio Infocomm Ltd.
- Reliance Jio Infocomm Ltd. - Overview
- Reliance Jio Infocomm Ltd. - Product / Service
- Reliance Jio Infocomm Ltd. - Key offerings
- 16.16 Samsung Electronics Co., Ltd.
- Samsung Electronics Co., Ltd. - Overview
- Samsung Electronics Co., Ltd. - Product / Service
- Samsung Electronics Co., Ltd. - Key offerings
- 16.17 Siklu Communication Ltd.
- Siklu Communication Ltd. - Overview
- Siklu Communication Ltd. - Product / Service
- Siklu Communication Ltd. - Key offerings
- 16.18 T-Mobile US, Inc.
- T-Mobile US, Inc. - Overview
- T-Mobile US, Inc. - Product / Service
- T-Mobile US, Inc. - Key offerings
- 16.19 Telefónica S.A.
- Telefónica S.A. - Overview
- Telefónica S.A. - Product / Service
- Telefónica S.A. - Key offerings
- 16.20 Telus Corporation
- Telus Corporation - Overview
- Telus Corporation - Product / Service
- Telus Corporation - Key offerings
- 16.21 Verizon Communications Inc.
- Verizon Communications Inc. - Overview
- Verizon Communications Inc. - Product / Service
- Verizon Communications Inc. - Key offerings
- 16.22 ZTE Corporation
- ZTE Corporation - Overview
- ZTE Corporation - Product / Service
- ZTE Corporation - Key offerings
- 16.23 AT and T Inc.
- AT and T Inc. - Overview
- AT and T Inc. - Product / Service
- AT and T Inc. - Key offerings
- 16.24 Ceragon Networks Ltd.
- Ceragon Networks Ltd. - Overview
- Ceragon Networks Ltd. - Product / Service
- Ceragon Networks Ltd. - Key offerings
- 16.25 Cisco Systems Inc.
- Cisco Systems Inc. - Overview
- Cisco Systems Inc. - Product / Service
- Cisco Systems Inc. - Key offerings
- 16.26 Cohere Technologies
- Cohere Technologies - Overview
- Cohere Technologies - Product / Service
- Cohere Technologies - Key offerings
- 16.27 CommScope Holding Co. Inc.
- CommScope Holding Co. Inc. - Overview
- CommScope Holding Co. Inc. - Product / Service
- CommScope Holding Co. Inc. - Key offerings
- 16.28 Huawei Technologies Co. Ltd.
- Huawei Technologies Co. Ltd. - Overview
- Huawei Technologies Co. Ltd. - Product / Service
- Huawei Technologies Co. Ltd. - Key offerings
- 16.29 Inseego Corp.
- Inseego Corp. - Overview
- Inseego Corp. - Product / Service
- Inseego Corp. - Key offerings
- 16.30 Nokia Corp.
- Nokia Corp. - Overview
- Nokia Corp. - Product / Service
- Nokia Corp. - Key offerings
- 16.31 Qualcomm Inc.
- Qualcomm Inc. - Overview
- Qualcomm Inc. - Product / Service
- Qualcomm Inc. - Key offerings
- 16.32 Reliance Industries Ltd.
- Reliance Industries Ltd. - Overview
- Reliance Industries Ltd. - Product / Service
- Reliance Industries Ltd. - Key offerings
- 16.33 Samsung Electronics Co. Ltd.
- Samsung Electronics Co. Ltd. - Overview
- Samsung Electronics Co. Ltd. - Product / Service
- Samsung Electronics Co. Ltd. - Key offerings
- 16.34 Singapore Telecommunications Ltd.
- Singapore Telecommunications Ltd. - Overview
- Singapore Telecommunications Ltd. - Product / Service
- Singapore Telecommunications Ltd. - Key offerings
- 16.35 Telefonaktiebolaget LM Ericsson
- Telefonaktiebolaget LM Ericsson - Overview
- Telefonaktiebolaget LM Ericsson - Product / Service
- Telefonaktiebolaget LM Ericsson - Key offerings
- 16.36 Telephone and Data Systems Inc.
- Telephone and Data Systems Inc. - Overview
- Telephone and Data Systems Inc. - Product / Service
- Telephone and Data Systems Inc. - Key offerings
- 16.37 Ubiquiti Inc.
- Ubiquiti Inc. - Overview
- Ubiquiti Inc. - Product / Service
- Ubiquiti Inc. - Key offerings
- 16.38 Verizon Communications Inc.
- Verizon Communications Inc. - Overview
- Verizon Communications Inc. - Product / Service
- Verizon Communications Inc. - Key offerings
- 16.39 Vodafone Group Plc
- Vodafone Group Plc - Overview
- Vodafone Group Plc - Product / Service
- Vodafone Group Plc - Key offerings
- 16.40 Wireless Excellence Ltd.
- Wireless Excellence Ltd. - Overview
- Wireless Excellence Ltd. - Product / Service
- Wireless Excellence Ltd. - Key offerings
- 16.41 ZTE Corp.
- ZTE Corp. - Overview
- ZTE Corp. - Product / Service
- ZTE Corp. - Key offerings
17 Appendix
- 17.2 Inclusions and exclusions checklist
- Inclusions checklist
- Exclusions checklist
- 17.3 Currency conversion rates for US$
- Currency conversion rates for US$
- 17.4 Research methodology
- 17.7 Validation techniques employed for market sizing
- Validation techniques employed for market sizing
- 17.9 360 degree market analysis
- 360 degree market analysis
- 17.10 List of abbreviations