
Digital Signage In Education Sector Market Size 2026-2030
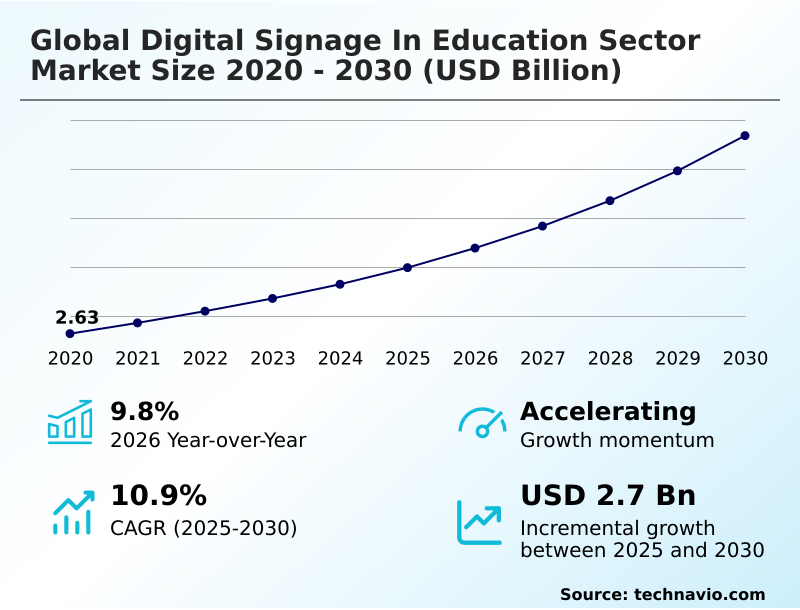
The digital signage in education sector market size is valued to increase by USD 2.70 billion, at a CAGR of 10.9% from 2025 to 2030. Rising demand for enhanced campus safety and rapid emergency notification systems will drive the digital signage in education sector market.
Major Market Trends & Insights
- North America dominated the market and accounted for a 31.2% growth during the forecast period.
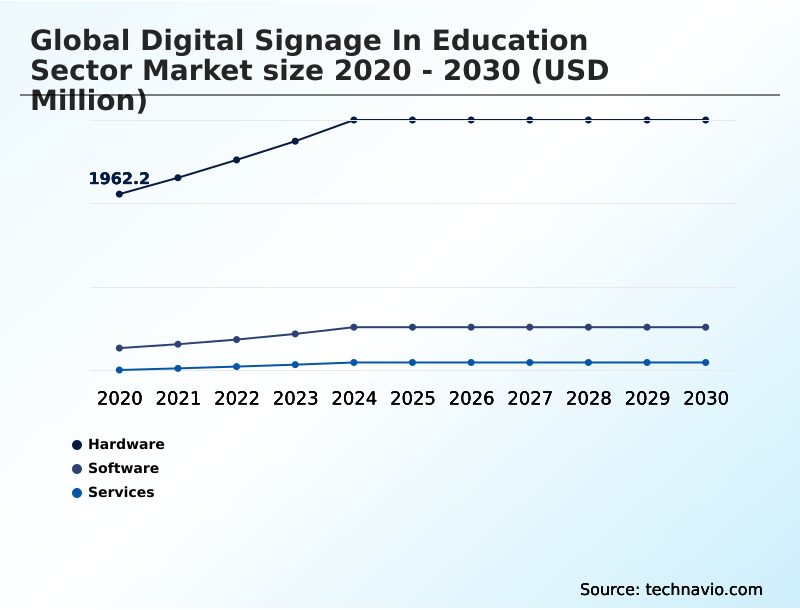
- By Component - Hardware segment was valued at USD 2.69 billion in 2024
- By End-user - K-12 schools segment accounted for the largest market revenue share in 2024
Market Size & Forecast
- Market Opportunities: USD 4.05 billion
- Market Future Opportunities: USD 2.70 billion
- CAGR from 2025 to 2030 : 10.9%
Market Summary
- The digital signage in education sector market is witnessing robust expansion as institutions prioritize modern communication infrastructures. This growth is driven by the need for enhanced campus safety and the adoption of collaborative learning environments. Digital signage functions as a centralized network, enabling the instant broadcast of emergency alerts and daily announcements, which is a significant improvement over traditional methods.
- In classrooms, interactive flat panel displays are transforming instructional delivery methods, fostering student engagement through dynamic multimedia content. For instance, a university can leverage its campus communication network for more than just announcements; it can use real-time data feeds to display transit schedules, library availability, and event promotions, optimizing campus logistics and improving the student experience.
- This shift reflects a broader institutional commitment to creating a secure and efficient learning environment. The market is also benefiting from the development of more intuitive cloud-based content management systems, making it easier for non-technical staff to manage and update content across numerous displays.
- As technology costs decline, adoption is broadening, positioning digital signage as an essential component of the modern smart campus ecosystem and a key tool for improving student retention rates.
What will be the Size of the Digital Signage In Education Sector Market during the forecast period?
Get Key Insights on Market Forecast (PDF) Get Free Sample
How is the Digital Signage In Education Sector Market Segmented?
The digital signage in education sector industry research report provides comprehensive data (region-wise segment analysis), with forecasts and estimates in "USD million" for the period 2026-2030, as well as historical data from 2020-2024 for the following segments.
- Component
- Hardware
- Software
- Services
- End-user
- K-12 schools
- Higher education institutions
- Vocational and continuing education
- Technology
- LCD technology
- LED technology
- Projection technology
- Media players
- Application
- Classrooms
- Campus communication
- Libraries
- Auditoriums
- Geography
- North America
- US
- Canada
- Mexico
- Europe
- Germany
- UK
- France
- APAC
- China
- Japan
- India
- South America
- Brazil
- Argentina
- Middle East and Africa
- Saudi Arabia
- UAE
- South Africa
- Rest of World (ROW)
- North America
By Component Insights
The hardware segment is estimated to witness significant growth during the forecast period.
The hardware segment is a foundational pillar, encompassing tangible components that enable visual communication. Institutions are progressively investing in high-brightness displays and 4k resolution video wall installations to create dynamic information hubs, moving beyond basic lcd display technology.
The adoption of system-on-a-chip displays simplifies deployment, reducing the need for separate media player hardware and contributing to operational efficiency gains. These integrated solutions, which often include multi-touch screen capability, are transforming static spaces into interactive learning tools.
The use of robust outdoor digital signage is also expanding for campus-wide notifications. For instance, facilities with interactive learning tools report a 15% increase in student space utilization.
The focus on a favorable total cost of ownership drives procurement cycles toward more integrated and durable hardware solutions.
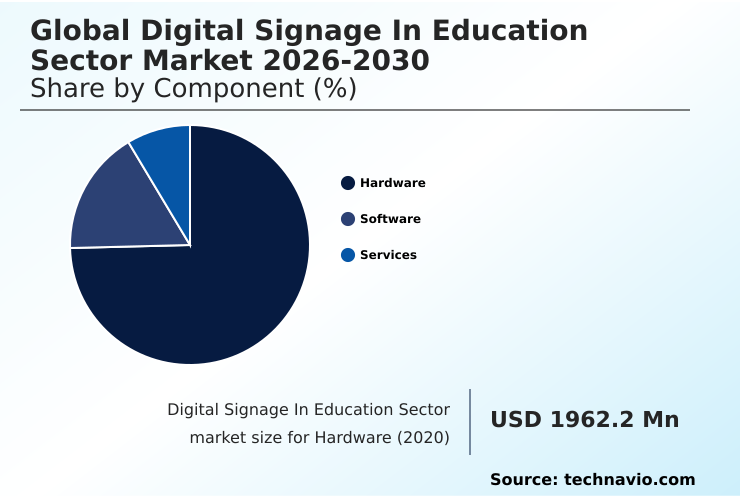
The Hardware segment was valued at USD 2.69 billion in 2024 and showed a gradual increase during the forecast period.
Regional Analysis
North America is estimated to contribute 31.2% to the growth of the global market during the forecast period.Technavio’s analysts have elaborately explained the regional trends and drivers that shape the market during the forecast period.

See How Digital Signage In Education Sector Market Demand is Rising in North America Get Free Sample
The geographic landscape of the digital signage in education sector market reflects diverse adoption rates and investment priorities. North America commands over 31% of the market opportunity, driven by high technology adoption and a strong focus on enhancing campus safety.
In this region, emergency alert integration is a key factor, with some districts achieving a 99% success rate in alert delivery confirmation via their digital display networks.
Europe is also a mature market, with a focus on data privacy and creating collaborative learning environments. The APAC region is projected to be the fastest-growing, fueled by government-led smart campus initiatives and a massive student population.
These initiatives promote digital literacy and are leading to large-scale deployments of interactive flat panel display technology and content scheduling automation to improve instructional delivery methods and achieve operational efficiency gains.
The strategic transition to future-proof facilities is a global phenomenon.
Market Dynamics
Our researchers analyzed the data with 2025 as the base year, along with the key drivers, trends, and challenges. A holistic analysis of drivers will help companies refine their marketing strategies to gain a competitive advantage.
- Successfully navigating the digital signage in education sector market requires a strategic approach that addresses specific institutional needs. Best practices for digital signage in K-12, for example, emphasize ease of use and robust security protocols for campus signage, whereas higher education content strategies for digital signage focus more on student retention rates and institutional branding.
- A key decision point is choosing between cloud vs on-premise digital signage cms, with cloud options offering greater scalability for managing digital signage content remotely across entire school districts. The implementation of interactive display technology for science labs and other specialized areas demonstrates the shift from passive information to active engagement.
- To justify investment, decision-makers are increasingly focused on measuring roi of university digital signage. Analytics for digital signage viewership are crucial for this, providing data to optimize content. A crucial application is using digital signage for campus safety alerts, where integrating digital signage with student information systems allows for targeted, timely communication.
- Even practical applications like deploying digital menu boards for cafeterias provide a clear return, with some institutions reducing annual printing and labor costs by over 85% compared to static signage. Ultimately, the cost of digital signage implementation must be weighed against these tangible benefits in efficiency, engagement, and safety.
What are the key market drivers leading to the rise in the adoption of Digital Signage In Education Sector Industry?
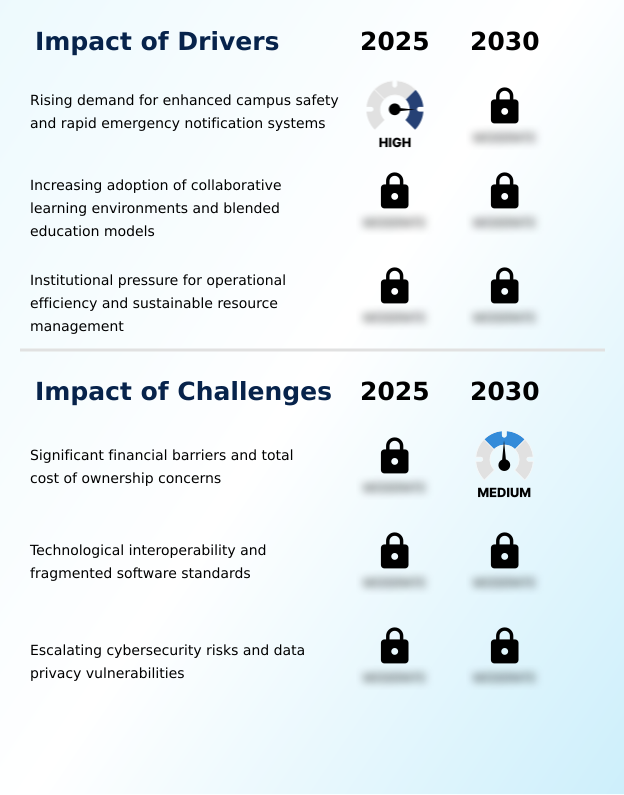
- A primary market driver is the rising demand for enhanced campus safety and rapid emergency notification systems, compelling institutional investment in modern communication infrastructures.
- Market growth is significantly driven by the pedagogical shift toward blended education models and collaborative learning environments. This requires versatile interactive learning tools that support group work and the seamless integration of digital resources.
- The demand for real-time data feeds and content scheduling automation allows educators to display diverse multimedia content, improving instructional efficacy.
- This drive for operational excellence also fuels the transition to paperless campus initiatives, where digital displays eliminate the waste and labor associated with printed materials.
- Institutions adopting these systems have reported a reduction in paper-related expenditures by as much as 90%.
- This pursuit of sustainable resource management, combined with the need to future-proof facilities and enhance proactive risk management through reliable communication, ensures that digital signage is viewed as a critical long-term investment.
What are the market trends shaping the Digital Signage In Education Sector Industry?
- A key market trend is the proliferation of AI and real-time data analytics. These technologies are increasingly used to enable personalized pedagogy and create responsive learning environments.
- Key market trends are driven by the integration of artificial intelligence and advanced data analytics, transforming static displays into intelligent communication hubs. This move toward data-driven content delivery is evident in the use of AI to enable personalized pedagogy, with systems tailoring messages based on real-time environmental data.
- The proliferation of augmented reality overlay and gesture control interface technologies is creating more immersive and participatory learning environments. A core part of this trend is the adoption of a unified communication platform, which ensures that all digital touchpoints are synchronized.
- This technological interoperability allows for a more cohesive student experience, with institutions that effectively integrate their systems seeing a 20% higher student satisfaction rate with campus communications. The wider adoption of google edla certification and pantone validation further signals a move toward higher quality and standardized display performance.
What challenges does the Digital Signage In Education Sector Industry face during its growth?
- A key challenge affecting industry growth involves significant financial barriers and concerns regarding the total cost of ownership for deploying and maintaining digital signage networks.
- Significant financial barriers and concerns over the total cost of ownership remain primary market challenges, often leading to prolonged procurement cycles. The lack of standardization across hardware and software platforms creates issues with technological interoperability, locking institutions into proprietary ecosystems and complicating the integration of systems like learning management platforms.
- This fragmentation increases the administrative burden, requiring specialized training for staff. Furthermore, as these networks become more connected, they introduce cybersecurity vulnerabilities. A single compromised media player with outdated firmware could serve as an entry point for a network-wide attack, a risk that increases operational costs. Ensuring accessibility compliance across all displays adds another layer of complexity.
- These factors can deter investment, with some institutions delaying full-scale deployments by up to 18 months due to these combined challenges.
Exclusive Technavio Analysis on Customer Landscape
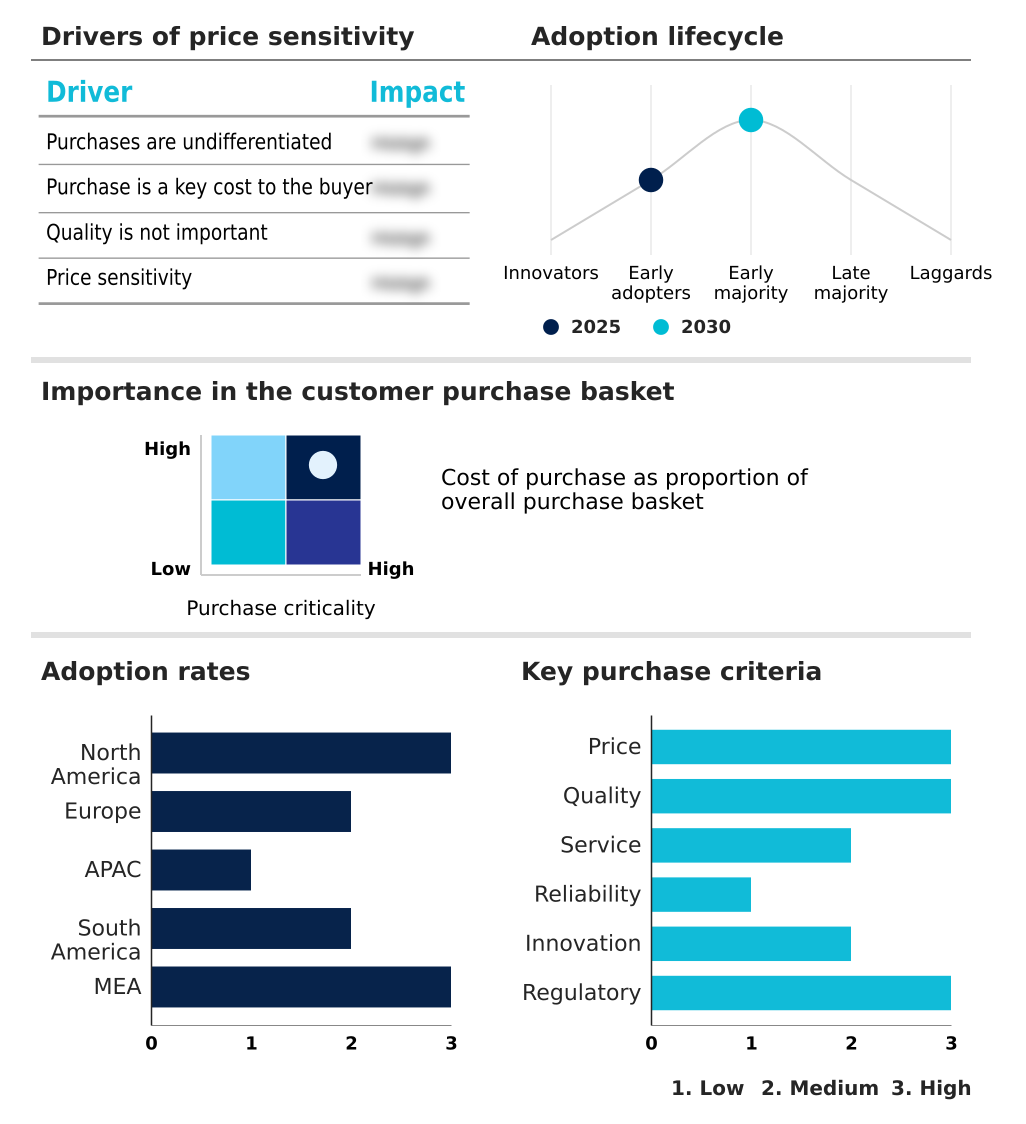
The digital signage in education sector market forecasting report includes the adoption lifecycle of the market, covering from the innovator’s stage to the laggard’s stage. It focuses on adoption rates in different regions based on penetration. Furthermore, the digital signage in education sector market report also includes key purchase criteria and drivers of price sensitivity to help companies evaluate and develop their market growth analysis strategies.
Customer Landscape of Digital Signage In Education Sector Industry
Competitive Landscape
Companies are implementing various strategies, such as strategic alliances, digital signage in education sector market forecast, partnerships, mergers and acquisitions, geographical expansion, and product/service launches, to enhance their presence in the industry.
Advantech Co. Ltd. - Offerings include specialized digital signage players and embedded computing solutions designed to power reliable and high-performance educational display networks.
The industry research and growth report includes detailed analyses of the competitive landscape of the market and information about key companies, including:
- Advantech Co. Ltd.
- Appspace Inc.
- Barco NV
- BenQ Corp.
- BrightSign LLC
- Christie Digital Systems Inc.
- Elo Touch Solutions Inc.
- LG Electronics Inc.
- Mvix USA Inc.
- Navori Labs SA
- Panasonic Holdings Corp.
- Planar Systems Inc.
- Poppulo Limited
- Promethean World Ltd.
- Rise Vision Inc.
- Samsung Electronics Co. Ltd.
- Scala
- Sharp Corp.
- Skykit LLC
- SMART Technologies ULC
Qualitative and quantitative analysis of companies has been conducted to help clients understand the wider business environment as well as the strengths and weaknesses of key industry players. Data is qualitatively analyzed to categorize companies as pure play, category-focused, industry-focused, and diversified; it is quantitatively analyzed to categorize companies as dominant, leading, strong, tentative, and weak.
Recent Development and News in Digital signage in education sector market
- In November 2024, Samsung Electronics Co. Ltd. unveiled an update to its VXT cloud-native Content Management System (CMS), introducing AI-powered content creation tools and enhanced security features designed for K-12 and higher education clients.
- In January 2025, Christie Digital Systems Inc. introduced its Jazz series of 1-chip DLP projectors, featuring new technology to deliver higher brightness from a more compact and cost-effective form factor for educational institutions.
- In March 2025, Appspace Inc. announced a strategic partnership with a leading interactive display manufacturer to bundle its workplace experience platform with new hardware, offering a unified solution for campus communication and room booking.
- In April 2025, BenQ launched its SL04 and SH04 series, the first digital signage displays to receive Google Education Device License Agreement (EDLA) certification, targeting seamless integration with educational software ecosystems.
Dive into Technavio’s robust research methodology, blending expert interviews, extensive data synthesis, and validated models for unparalleled Digital Signage In Education Sector Market insights. See full methodology.
| Market Scope | |
|---|---|
| Page number | 326 |
| Base year | 2025 |
| Historic period | 2020-2024 |
| Forecast period | 2026-2030 |
| Growth momentum & CAGR | Accelerate at a CAGR of 10.9% |
| Market growth 2026-2030 | USD 2698.2 million |
| Market structure | Fragmented |
| YoY growth 2025-2026(%) | 9.8% |
| Key countries | US, Canada, Mexico, Germany, UK, France, Italy, Spain, The Netherlands, China, Japan, India, South Korea, Australia, Indonesia, Brazil, Argentina, Chile, Saudi Arabia, UAE, South Africa, Israel and Turkey |
| Competitive landscape | Leading Companies, Market Positioning of Companies, Competitive Strategies, and Industry Risks |
Research Analyst Overview
- The digital signage in education sector market is characterized by a rapid technological evolution, compelling institutions to strategically invest in modern communication infrastructures. Central to this is the adoption of cloud-based content management platforms, which provide centralized remote management and robust user permission controls, ensuring both flexibility and security.
- The hardware landscape is also advancing, with a clear trend toward bezel-less video wall configurations and power-over-ethernet devices that simplify installation. The integration of audience analytics sensors and playback log analysis is shifting boardroom conversations toward data-driven decision-making, where the effectiveness of communication can be quantifiably measured.
- For example, implementing comprehensive asset management software has been shown to reduce device downtime by up to 40%, directly impacting operational continuity. This focus on verifiable performance metrics, enabled by advanced firmware update management and device provisioning tools, allows institutions to maximize the return on their technology investments and build a truly connected and responsive smart campus ecosystem.
What are the Key Data Covered in this Digital Signage In Education Sector Market Research and Growth Report?
-
What is the expected growth of the Digital Signage In Education Sector Market between 2026 and 2030?
-
USD 2.70 billion, at a CAGR of 10.9%
-
-
What segmentation does the market report cover?
-
The report is segmented by Component (Hardware, Software, and Services), End-user (K-12 schools, Higher education institutions, and Vocational and continuing education), Technology (LCD technology, LED technology, Projection technology, and Media players), Application (Classrooms, Campus communication, Libraries, and Auditoriums) and Geography (North America, Europe, APAC, South America, Middle East and Africa)
-
-
Which regions are analyzed in the report?
-
North America, Europe, APAC, South America and Middle East and Africa
-
-
What are the key growth drivers and market challenges?
-
Rising demand for enhanced campus safety and rapid emergency notification systems, Significant financial barriers and total cost of ownership concerns
-
-
Who are the major players in the Digital Signage In Education Sector Market?
-
Advantech Co. Ltd., Appspace Inc., Barco NV, BenQ Corp., BrightSign LLC, Christie Digital Systems Inc., Elo Touch Solutions Inc., LG Electronics Inc., Mvix USA Inc., Navori Labs SA, Panasonic Holdings Corp., Planar Systems Inc., Poppulo Limited, Promethean World Ltd., Rise Vision Inc., Samsung Electronics Co. Ltd., Scala, Sharp Corp., Skykit LLC and SMART Technologies ULC
-
Market Research Insights
- The market dynamics are shaped by a strategic push toward creating more connected and efficient educational environments. The adoption of a unified communication platform is critical, with institutions leveraging these systems to ensure brand consistency and streamline administrative workflows.
- This pedagogical shift toward digital tools is yielding measurable results; schools implementing gamified learning experiences report student engagement metrics that are up to 25% higher than those using traditional methods.
- Concurrently, the drive for operational efficiency gains is compelling, as the use of centralized remote management for content updates reduces associated labor costs by over 40% compared to manual, location-by-location changes. These dynamics underscore a move toward integrated, data-driven strategies for stakeholder communication and campus management.
We can help! Our analysts can customize this digital signage in education sector market research report to meet your requirements.
 RIA -
RIA - 
